

What are the visuo-motor tendencies of omnidirectional scene free-viewing in virtual reality?
- PMID: 35323868
- PMCID: PMC8963670
- DOI: 10.1167/jov.22.4.12
What are the visuo-motor tendencies of omnidirectional scene free-viewing in virtual reality?
Abstract
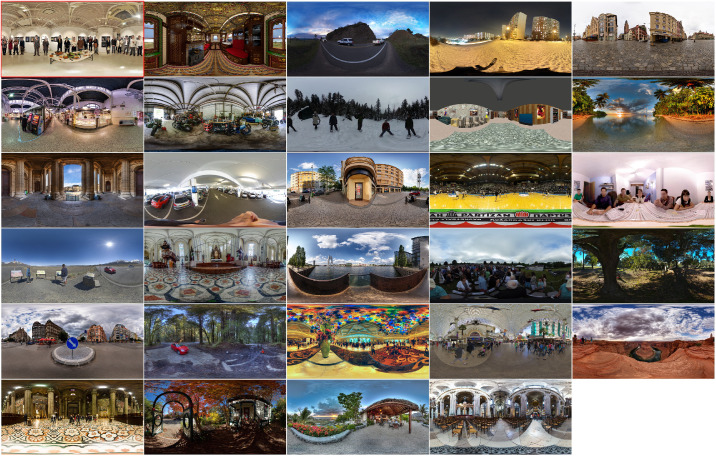
Central and peripheral vision during visual tasks have been extensively studied on two-dimensional screens, highlighting their perceptual and functional disparities. This study has two objectives: replicating on-screen gaze-contingent experiments removing central or peripheral field of view in virtual reality, and identifying visuo-motor biases specific to the exploration of 360 scenes with a wide field of view. Our results are useful for vision modelling, with applications in gaze position prediction (e.g., content compression and streaming). We ask how previous on-screen findings translate to conditions where observers can use their head to explore stimuli. We implemented a gaze-contingent paradigm to simulate loss of vision in virtual reality, participants could freely view omnidirectional natural scenes. This protocol allows the simulation of vision loss with an extended field of view (\(\gt \)80°) and studying the head's contributions to visual attention. The time-course of visuo-motor variables in our pure free-viewing task reveals long fixations and short saccades during first seconds of exploration, contrary to literature in visual tasks guided by instructions. We show that the effect of vision loss is reflected primarily on eye movements, in a manner consistent with two-dimensional screens literature. We hypothesize that head movements mainly serve to explore the scenes during free-viewing, the presence of masks did not significantly impact head scanning behaviours. We present new fixational and saccadic visuo-motor tendencies in a 360° context that we hope will help in the creation of gaze prediction models dedicated to virtual reality.
Figures
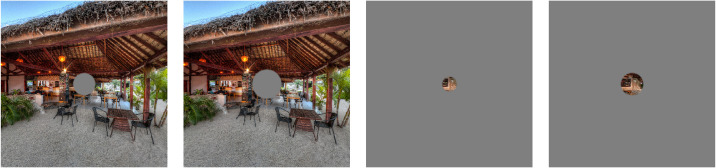
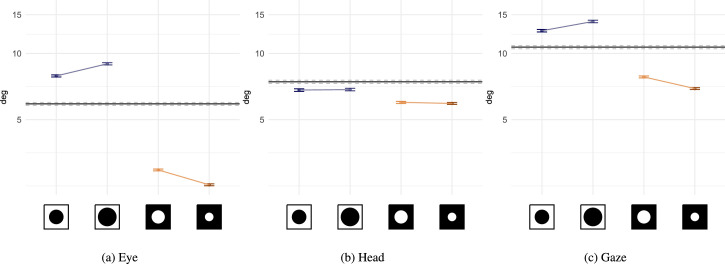
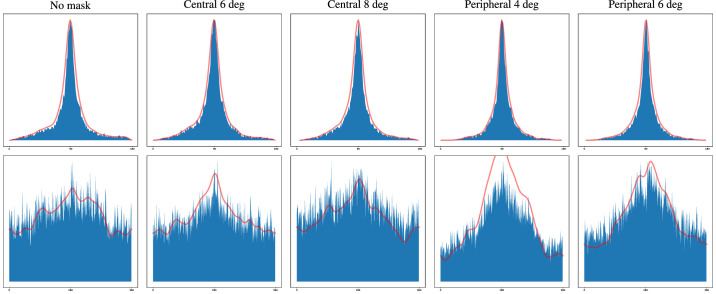
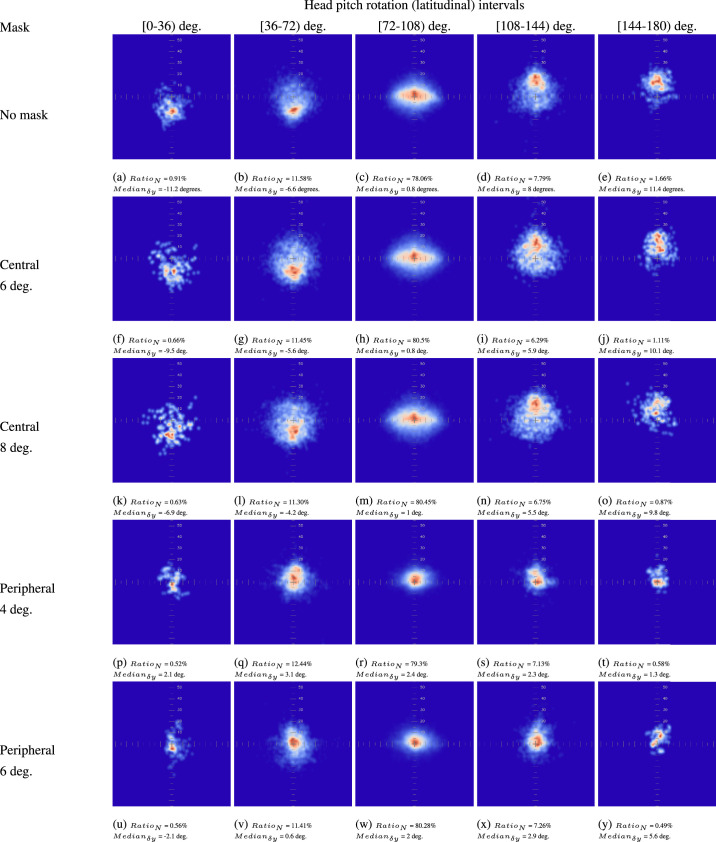
 no-mask,
  central 6°,
  central 8°,
  peripheral 6°,
  peripheral 4°.
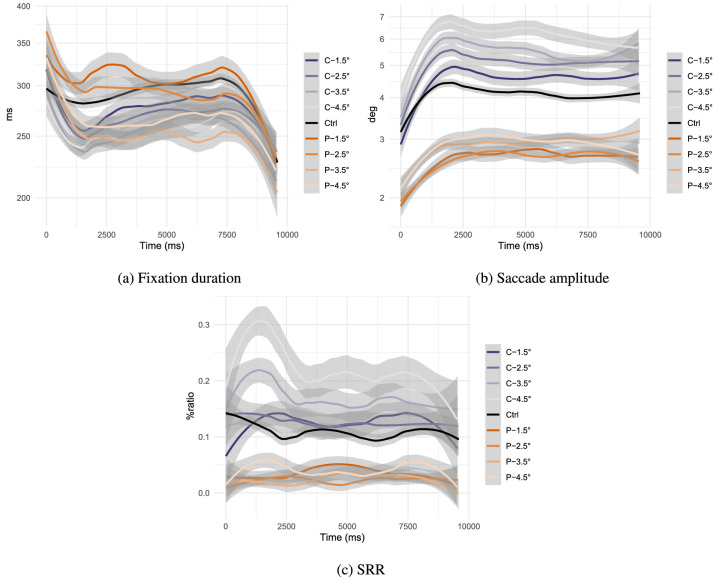
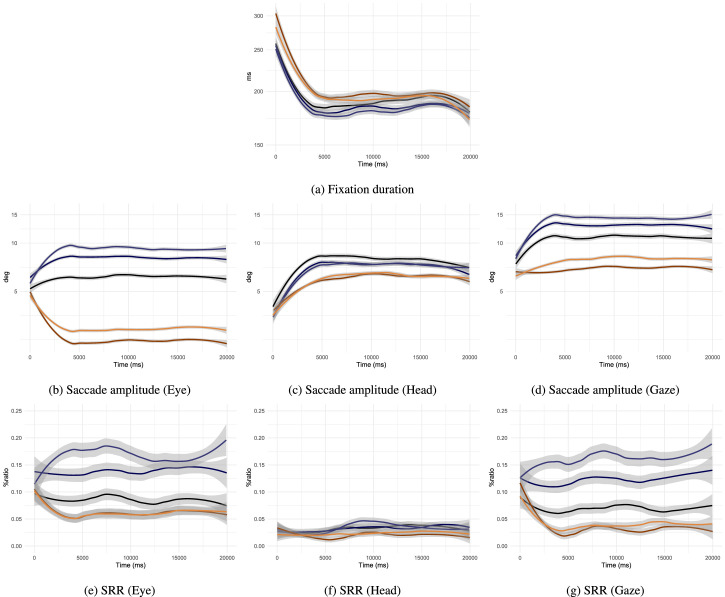 no-mask, central 6°, central 8°, peripheral 6°, peripheral 4°. Fixation durations and saccade amplitudes are displayed on a log-scale.
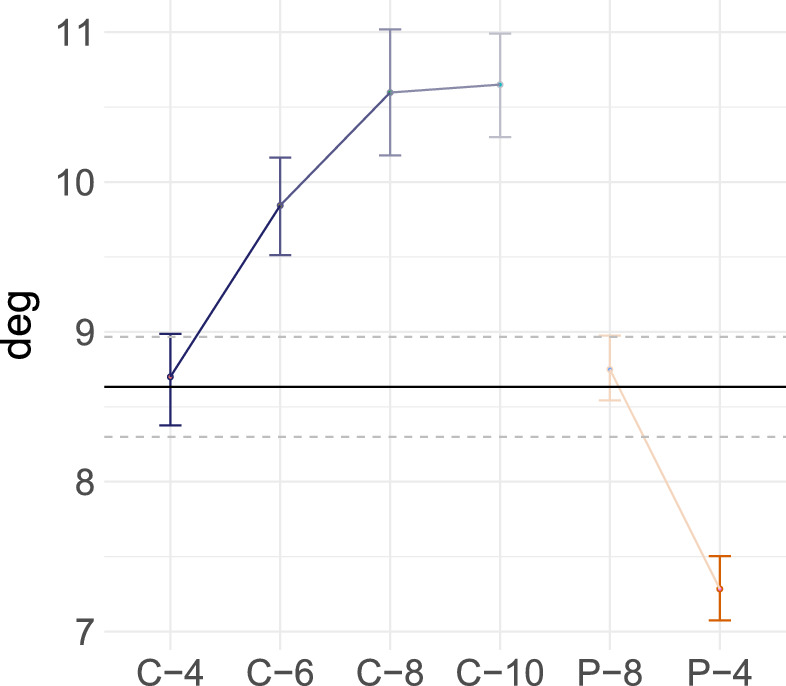
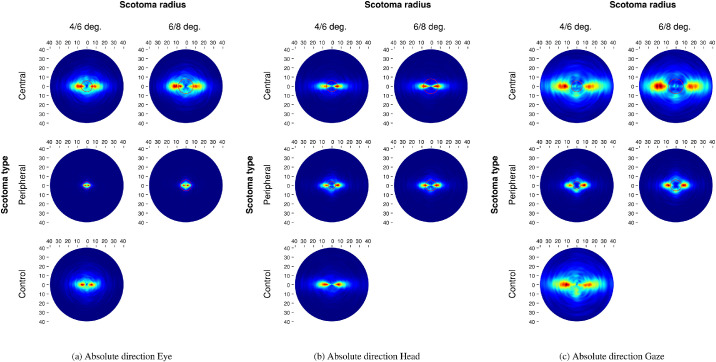
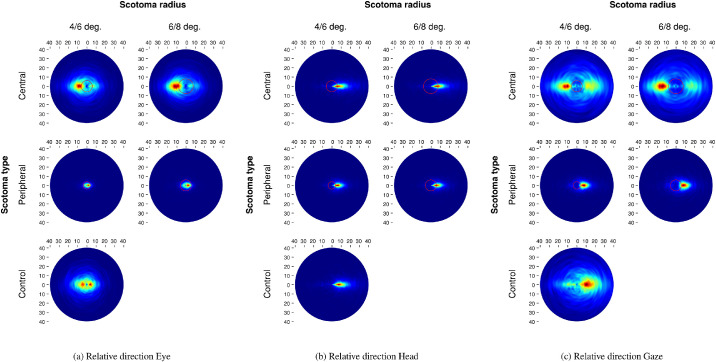
 no-mask, central 6°, central 8°, peripheral 6°, and peripheral 4°.
Similar articles
-
Effects of Transient Loss of Vision on Head and Eye Movements during Visual Search in a Virtual Environment.Brain Sci. 2020 Nov 12;10(11):841. doi: 10.3390/brainsci10110841. Brain Sci. 2020. PMID: 33198116 Free PMC article.
-
How central and peripheral vision influence focal and ambient processing during scene viewing.J Vis. 2022 Nov 1;22(12):4. doi: 10.1167/jov.22.12.4. J Vis. 2022. PMID: 36322076 Free PMC article.
-
The importance of peripheral vision when searching 3D real-world scenes: A gaze-contingent study in virtual reality.J Vis. 2021 Jul 6;21(7):3. doi: 10.1167/jov.21.7.3. J Vis. 2021. PMID: 34251433 Free PMC article.
-
A physiological perspective on fixational eye movements.Vision Res. 2016 Jan;118:31-47. doi: 10.1016/j.visres.2014.12.006. Epub 2014 Dec 20. Vision Res. 2016. PMID: 25536465 Free PMC article. Review.
-
Gaze Control as Prediction.Trends Cogn Sci. 2017 Jan;21(1):15-23. doi: 10.1016/j.tics.2016.11.003. Epub 2016 Dec 5. Trends Cogn Sci. 2017. PMID: 27931846 Review.
Cited by
-
Eye and head movements while encoding and recognizing panoramic scenes in virtual reality.PLoS One. 2023 Feb 17;18(2):e0282030. doi: 10.1371/journal.pone.0282030. eCollection 2023. PLoS One. 2023. PMID: 36800398 Free PMC article.
-
Eye Tracking in Virtual Reality.Curr Top Behav Neurosci. 2023;65:73-100. doi: 10.1007/7854_2022_409. Curr Top Behav Neurosci. 2023. PMID: 36710302
-
Effects of Transient Loss of Vision on Head and Eye Movements during Visual Search in a Virtual Environment.Brain Sci. 2020 Nov 12;10(11):841. doi: 10.3390/brainsci10110841. Brain Sci. 2020. PMID: 33198116 Free PMC article.
-
Influence of open-source virtual-reality based gaze training on navigation performance in Retinitis pigmentosa patients in a crossover randomized controlled trial.PLoS One. 2024 Feb 1;19(2):e0291902. doi: 10.1371/journal.pone.0291902. eCollection 2024. PLoS One. 2024. PMID: 38300913 Free PMC article. Clinical Trial.
-
Flipping the world upside down: Using eye tracking in virtual reality to study visual search in inverted scenes.J Eye Mov Res. 2023 Mar 31;15(3):10.16910/jemr.15.3.5. doi: 10.16910/jemr.15.3.5. eCollection 2022. J Eye Mov Res. 2023. PMID: 37215533 Free PMC article.
References
-
- Aguilar, C., & Castet, E. (2011). Gaze-contingent simulation of retinopathy: Some potential pitfalls and remedies. Vision Research, 51(9), 997–1012. - PubMed
-
- Albert, R., Patney, A., Luebke, D., & Kim, J. (2017). Latency requirements for foveated rendering in virtual reality. ACM Transactions on Applied Perception (TAP), 14(4), 25.
-
- Antes, J. R. (1974). The time course of picture viewing. Journal of Experimental Psychology, 103(1), 62. - PubMed
-
- Asfaw, D. S., Jones, P. R., Mönter, V. M., Smith, N. D., & Crabb, D. P. (2018). Does glaucoma alter eye movements when viewing images of natural scenes? a between-eye study. Investigative Ophthalmology & Visual Science, 59(8), 3189–3198. - PubMed
Publication types
MeSH terms
LinkOut - more resources
Full Text Sources
Miscellaneous
