. 2022 Mar 25;375(6587):1378-1385.
doi: 10.1126/science.abn0532. Epub 2022 Mar 24.

An action potential initiation mechanism in distal axons for the control of dopamine release

Affiliations

An action potential initiation mechanism in distal axons for the control of dopamine release

Changliang Liu et al. Science. .

Abstract

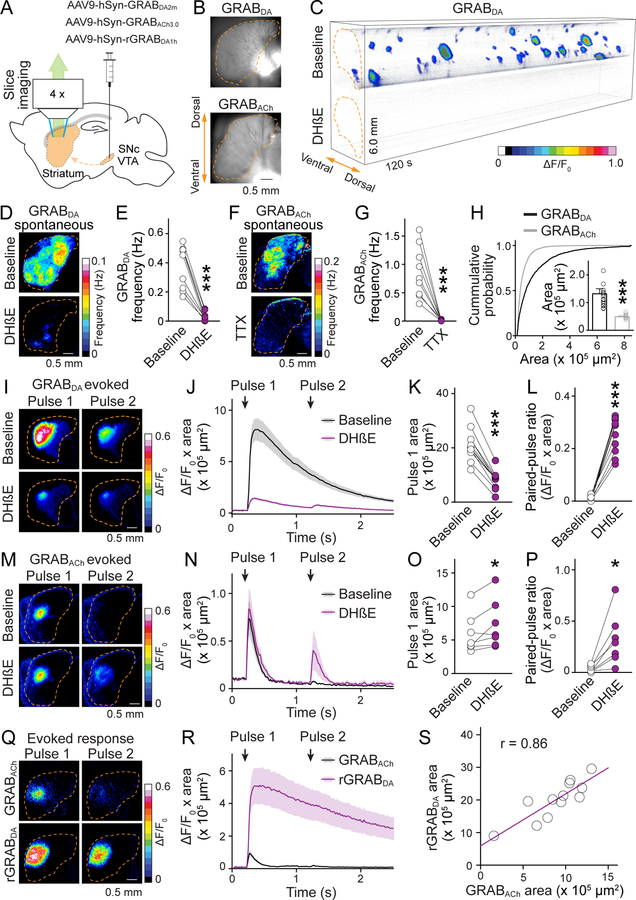
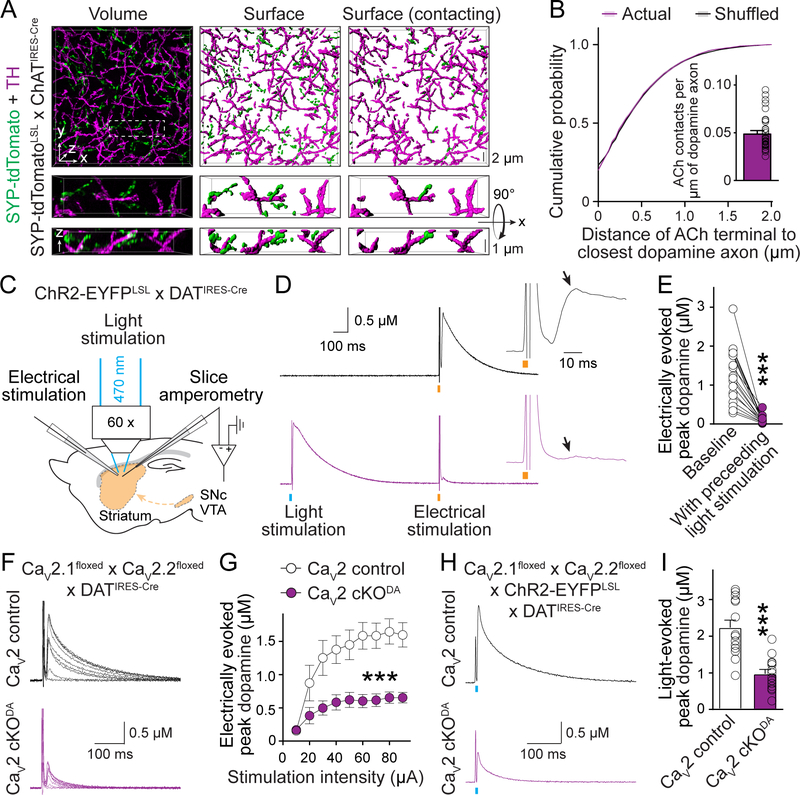
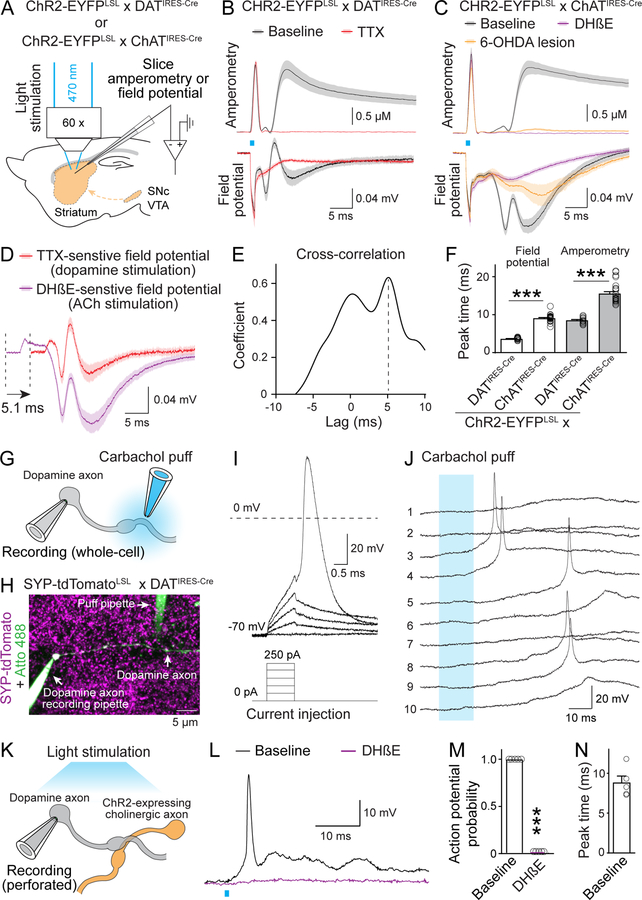
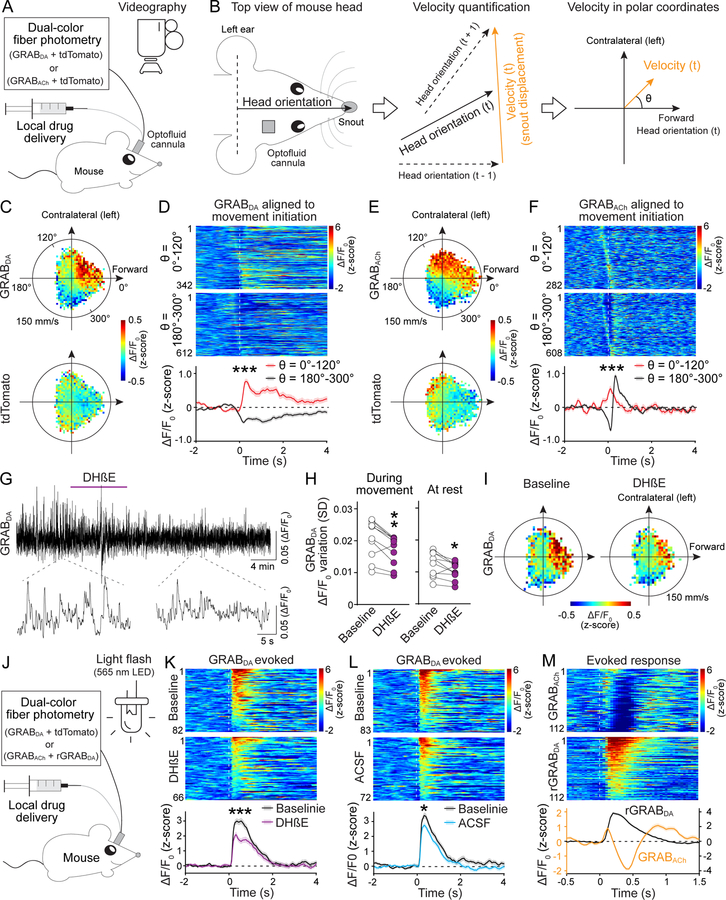
Information flow in neurons proceeds by integrating inputs in dendrites, generating action potentials near the soma, and releasing neurotransmitters from nerve terminals in the axon. We found that in the striatum, acetylcholine-releasing neurons induce action potential firing in distal dopamine axons. Spontaneous activity of cholinergic neurons produced dopamine release that extended beyond acetylcholine-signaling domains, and traveling action potentials were readily recorded from dopamine axons in response to cholinergic activation. In freely moving mice, dopamine and acetylcholine covaried with movement direction. Local inhibition of nicotinic acetylcholine receptors impaired dopamine dynamics and affected movement. Our findings uncover an endogenous mechanism for action potential initiation independent of somatodendritic integration and establish that this mechanism segregates the control of dopamine signaling between axons and somata.


Conflict of interest statement

Competing interests: YL is listed as an inventor on a patent application (PCT/CN2018/107533) describing GRAB probes. The other authors declare no competing interests.

Figures

Fig. 1.
Fig. 1.. ACh-induced dopamine secretion expands beyond ACh release.
(A) Schematic of midbrain AAV injection for dopamine axonal expression of GRABDA, rGRABDA or GRABACh sensors followed by widefield fluorescence imaging in parasagittal striatal slices. (B) GRABDA and GRABACh expression in striatal slices. Dashed lines (orange) outline the striatum. (C) Volume-rendered time series of spontaneous GRABDA fluctuations (expressed as ΔF/F0, color-coded for magnitude) before (top) and after (bottom) application of DHβE (1 μM). Areas with ΔF/F0 < 0.02 were made transparent for clarity. (D, E) Example frequency maps (D) and quantification (E) of spontaneous GRABDA events detected before and after 1 μM DHβE; n = 9 slices/4 mice. (F, G) As (D, E), but for GRABACh before and after 1 μM TTX; n = 9/3. (H) Comparison of the area covered by GRABDA and GRABACh events; n = 1010 events/17 slices/4 mice for GRABDA, 2087/14/4 for GRABACh. (I to L) Example images (I) and quantification (J to L) of GRABDA fluorescence evoked by paired electrical stimuli (1-s interval) before and after 1 μM DhβE; n = 11/4. (M to P) As I to L, but for GRABACh; n = 7/3. (Q, R) As (I, J), but for simultaneous assessment of GRABACh and rGRABDA; n = 12/4. (S) Correlation of areas in (R). Data are mean ± SEM; * p < 0.05, *** p < 0.001; Wilcoxon signed-rank tests for (E), (G), (K), (L), (O), and (P); Mann-Whitney rank-sum test for (H).
Fig. 2.
Fig. 2.. ACh triggers dopamine secretion through the same release mechanisms as dopamine neuron action potentials.
(A) Example 3D-SIM images of dorsal striatal slices showing dopamine axons (labeled with TH antibodies) and ACh nerve terminals (labeled by crossing Cre-dependent Synpatophysin-tdTomato mice, SYP-tdTomatoLSL, with ChATIRES-Cre mice). Images were obtained by volume rendering of an image stack (left), surface rendering of detected objects (middle), and surface rendering of ACh terminals that contact dopamine axons (right, > 0 voxel overlap). (B) Comparison of the minimal distance of ACh terminals from the nearest dopamine axons. Controls were generated by averaging 1000 rounds of local shuffling and distance calculation of each ACh terminal within 5 × 5 × 1 μm3; n = 5482 objects/33 images/4 mice. (C) Schematic of slice recordings. ChR2-EYFP was expressed in dopamine neurons (by crossing ChR2-EYFPLSL with DATIRES-Cre mice), and dopamine release was measured using amperometry in dorsal striatal slices in the area of light stimulation. (D, E) Example traces (D) and quantification (E) of peak amplitude of the second dopamine release phase (arrows) evoked by electrical stimulation (orange bar) with (bottom) or without (top) a preceding 1-ms light stimulus (blue bar, 1 s before); n = 18 slices/3 mice. (F, G) Example traces (F) and quantification of peak dopamine amplitude (G, second phase) evoked by electrical stimulation in CaV2 cKODA mice (CaV2.1 + 2.2 double floxed mice crossed to DATIRES-Cre mice) and sibling CaV2 control mice; n = 1¾ each (p < 0.001 for genotype, stimulation intensity and interaction; two-way ANOVA; genotype effect reported in the figure). (H, I) Similar to (F, G), but with dopamine release evoked by light stimulation in mice expressing ChR2-EYFP transgenically in dopamine neurons; n = 14/5 each. Data are mean ± SEM; *** p < 0.001; Kolmogorov-Smirnov test for (B); Wilcoxon signed-rank test for (E); Mann-Whitney rank-sum test for (I).
Fig. 3.
Fig. 3.. Activation of nAChR triggers action potentials in striatal dopamine axons.
(A) Schematic of recordings with carbon fiber electrodes in voltage-clamp (0.6 V, amperometric recordings) or current-clamp (no current injection, field potential recordings). (B, C) Average traces of light-evoked dopamine release (top, amperometry) and field potentials (bottom) in brain slices of mice with CHR2-EYFP in dopamine axons (B) or ACh neurons (C). Example traces are in fig. S7, B and C. Recordings were in ACSF (baseline), in 1 μM TTX (B), in 1 μM DHβE (C) or after 6-OHDA injection (C); B, n = 12 slices/3 mice each; C, 25/6 (each) for baseline, 21/6 (amperometry) and 9/4 (field potentials) for DHβE, and 11/6 each for 6-OHDA. (D) Comparison of TTX-sensitive and DHβE-sensitive field potentials (obtained by subtraction; fig. S7, B and C). TTX-sensitive components are right-shifted by 5.1 ms (lag detected in E); n as in (B) and (C). (E) Cross-correlation of TTX- and DHβE-sensitive components shown in (D). (F) Lag of peak response from the start of the light stimulus; n as in (B) and (C). (G, H) Schematic (G) and example two-photon image (H) of direct recording from dopamine axons. Synaptophysin-tdTomato was expressed using mouse genetics in dopamine axons, the recorded axon was filled with Atto 488 (green) through the recording pipette, and the puff pipette contained carbachol and Atto 488. (I, J) Example responses of a dopamine axon to current injections through the whole-cell pipette (I) or to 10 consecutive carbachol puffs (100 μM, numbered, 10-s intervals, J). (K) Schematic of dopamine axon perforated patch recording in mice expressing ChR2-EYFP in ACh neurons. (L to N) Example traces (L), probability of action potential firing (M) and lag of action potential peak times to light onset (N) in dopamine axon recordings with optogenetic ACh interneuron activation before and after 1 μM DHβE; n = 5 axons/3 mice. Data are mean ± SEM; *** p < 0.001; Kruskal-Wallis analysis of variance with post hoc Dunn’s test for (F); Mann-Whitney rank-sum test for (M).
Fig. 4.
Fig. 4.. Dopamine and ACh dynamics correlate with movement direction, and dopamine dynamics are attenuated after blocking nAChRs.
(A) Strategy for simultaneous measurements of dopamine or ACh dynamics and behavior in freely moving mice. (B) Fiber photometry and drug delivery were in the right dorsal striatum using an optofluid cannula. Head orientation was defined as the direction from the center point between the ears to the snout. Instantaneous velocity at time point t was calculated from the displacement of the snout from t − 1 to t + 1 and plotted in polar coordinates with head orientation at t defined as θ = 0°. (C) Average GRABDA and tdTomato signals registered to their concurrent velocities in polar coordinates; n = 10 mice. (D) Individual (heatmap) and average GRABDA fluctuations aligned to movement initiation (dashed line) with θ = 0°–120° (top) or 180°–300° (bottom). Heatmaps were sorted by peak time; n = 342 events/10 mice for θ = 0°–120°, 612/10 for θ = 180°–300°. (E, F) As (C, D), but for GRABACh; n = 282/11 for θ = 0°–120°, 608/11 for θ = 180°–300°. (G, H) Example trace (G) and quantification (H, standard deviation of ΔF/F0) of GRABDA fluorescence before and after DHβE (50 μM, 1 μl) delivered via the optofluid canula; n = 10 mice. (I) Average GRABDA signals registered to concurrent velocities before and after DHβE; n = 10. (J) Schematic for measurements of dopamine release induced by 200-ms light flashes in freely moving mice. (K, L) Individual (heatmap) and average GRABDA fluctuations aligned to the light flash (dashed line) before and after local infusion of DhβE (K) or ACSF (L); K, n = 82 responses/10 mice for baseline, 66/10 for DhβE; L, 83/10 for baseline, 72/10 for ACSF. (M) Similar to K but for simultaneous assessment of GRABACh and rGRABDA; n = 112/4. Data are mean ± SEM; *** p < 0.001, ** p < 0.01, * p < 0.05; Mann-Whitney rank-sum tests for areas under the curve (0–400 ms) in (D), (F), (K) and (L). Wilcoxon signed-rank test for (H).

References

    1. Matsuda W et al., J. Neurosci. 29, 444–53 (2009). - PMC - PubMed
    1. Berke JD, What does dopamine mean? Nat. Neurosci. 21 (2018), pp. 787–793. - PMC - PubMed
    1. Liu C, Goel P, Kaeser PS, Nat. Rev. Neurosci. 22, 345–358 (2021). - PMC - PubMed
    1. Bromberg-Martin ES, Matsumoto M, Hikosaka O, Neuron. 68, 815–34 (2010). - PMC - PubMed
    1. Wilson CJ, Neuron. 45, 575–585 (2005). - PubMed

Publication types