. 2022 Mar 29;119(13):e2200099119.
doi: 10.1073/pnas.2200099119. Epub 2022 Mar 24.

Engineered CaM2 modulates nuclear calcium oscillation and enhances legume root nodule symbiosis

Affiliations

Engineered CaM2 modulates nuclear calcium oscillation and enhances legume root nodule symbiosis

Pablo Del Cerro et al. Proc Natl Acad Sci U S A. .

Abstract

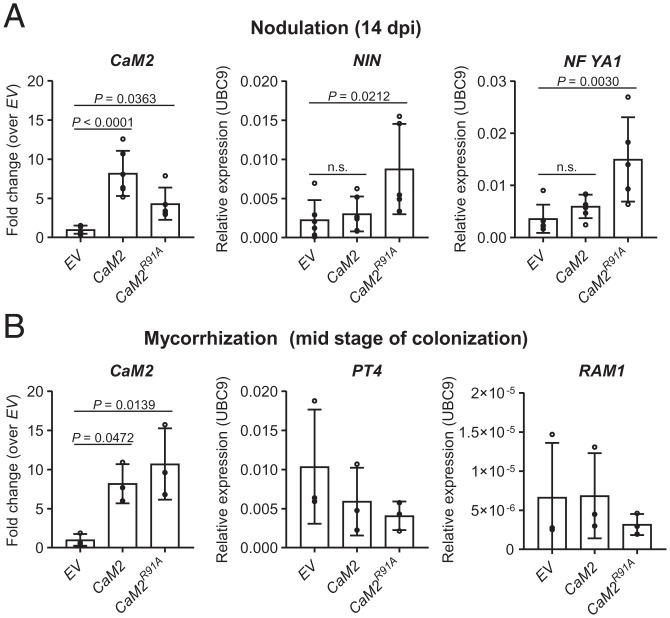
SignificanceOscillations in intracellular calcium concentration play an essential role in the regulation of multiple cellular processes. In plants capable of root endosymbiosis with nitrogen-fixing bacteria and/or arbuscular mycorrhizal fungi, nuclear localized calcium oscillations are essential to transduce the microbial signal. Although the ion channels required to generate the nuclear localized calcium oscillations have been identified, their mechanisms of regulation are unknown. Here, we combined proteomics and engineering approaches to demonstrate that the calcium-bound form of the calmodulin 2 (CaM2) associates with CYCLIC NUCLEOTIDE GATED CHANNEL 15 (CNGC15s), closing the channels and providing the negative feedback to sustain the oscillatory mechanism. We further unraveled that the engineered CaM2 accelerates early endosymbioses and enhanced root nodule symbiosis but not arbuscular mycorrhization.

Keywords: calcium signaling; calmodulin; root legume symbiosis.


Conflict of interest statement

The authors declare no competing interest.

Figures

Fig. 1.
Fig. 1.
HoloCaM2 interacts with CNGC15a, -b, and -c. (A) Representative mass spectra of specific peptide of CaM2, ADQLTDEQISEFK, identified by IP of CNGC15a in M. truncatula roots in the presence of calcium, with a probability of 100%. (B) Biolayer interferometry analyses of CaM2 binding to CtermCNGC15a, CtermCNGC15b, or CtermCNGC15c. CaM2 binds to CtermCNGC15s specifically in the presence of calcium. The interactions are assessed with 50 µM of CtermCNGC15a, CtermCNGC15b, or CtermCNGC15c and 150 µM of CaM2 in the absence or presence of CaCl2 at the concentration indicated. The raw curves represent the average of three replicates normalized to control run and performed using three independent protein purifications. Graphs show the association (0 to 20 s) and dissociation (20 to 40 s) steps of the interaction. (C) Bimolecular fluorescence complementation (BiFC) assessed in root hair cells of the M. truncatula transgenic line CNGC15a:Myc:YFPN expressing under the promoter CaM2 CtermYFP (YFPC) fused or not to CaM2. The interactions are visualized in the absence (−) or presence (+) of 10−8 M of Nod factor (NF) incubated for 1 h. Representative pictures of three biological replicates. (Scale bar, 20 µm.)
Fig. 2.
Fig. 2.
Mutation R91A increases holoCaM2 binding affinity and association rate for CNGC15a, CNGC15b, and CNGC15c. (A) Structure homology models of CaM2 and CaM2R91A. The R91A mutation abolishes contacts with the side chains of E86, K87, and E83, causing E83 to form a different orientation. The R91 residue is shown in blue and mutated R91A in red, with amino acid contacts shown in green. Contacts between amino acid side chains are shown by black dashed lines. (B) Isothermal titration calorimetry of CaM2 (100 µM) and CaM2R91A (100 µM) with 5 mM CaCl2. Top shows representative thermogram obtained for automatic injections of CaCl2 over time. Differential power, DP. Bottom presents the integrated curve of the experimental points (black circle); Kd, average dissociation constant from five replicates using protein from two independent purifications. Enthalpy of interaction, ΔH. Student’s t test. No statistical differences were observed for CaM2 and CaM2R91A. (C) Kinetic parameters measured via Biolayer interferometry in the presence of 20 mM CaCl2. Data are determined by the global fit of the interaction with 25 µM, 50 µM, and 100 µM of CaMs and 20 µM of His6-MBP:CtermCNGC15s. kon (M−1s−1), association rate constant; koff (s−1), dissociation rate constant; R2, coefficient of determination; n, number of replicates performed using one protein purification. (D) Kd of CaM2 and CaM2R91A with 10 µM of CNGC15b-IQ peptide (AACFIQVAWRRTIQEKKG) or CNGC15c-IQ peptide (AACFIQAAWRRHKKRKEA) measured via isothermal titration calorimetry in the presence of 5 mM CaCl2. Three independent replicates were performed using proteins from two independent purifications. Error bars represent SD. Student’s t test. P < 0.05.
Fig. 3.
Fig. 3.
CaM2R91A increases nuclear calcium oscillation frequency. (A) Representative Nod factor (10−8 M) induced calcium oscillation in M. truncatula WT root hair cells expressing the nuclear localized yellow cameleon 3.6 (NLS:YC3.6) or coexpressing NLS:YC3.6 with CaM2 or CaM2R91A driven by the L. japonicus ubiquitin promoter. The traces show the ratio of YFP/CFP fluorescence in arbitrary units (A.U.). (BE) Analyses of the frequency (B), the amplitude (C), the duration of the spike’s upward slope (rise time) (D), and the duration of the spike’s downward slope (fall time) (E) of the nuclear calcium oscillations recorded in A with NLS:YC3.6 (n = 23), CaM2-NLS:YC3.6 (n = 28), and CaM2R91A-NLS:YC3.6 (n = 17). Different letters indicate different statistical groups (one-way ANOVA; post hoc Bonferroni). (F) Representative Nod factor (10−8 M) induced calcium oscillation in M. truncatula WT::YC3.6 root hair cells expressing CaM2 hairpin construct (RNAiCAMs) or the empty vector (EV). (GJ) Analyses of the frequency (G), the amplitude (H), the duration of the spike’s upward slope (I), and the duration of the spike’s downward slope (J) of the nuclear calcium oscillations recorded in F with EV (n = 17), RNAiCaMs (n = 16). Student’s t test. P ≤ 0.0001. (BJ) Error bars represent SD. YFP, yellow fluorescent protein; CFP, cyan fluorescent protein; ns, no significant difference. R.U., relative units.
Fig. 4.
Fig. 4.
CaM2R91A enhances root nodule symbiosis. (AG) M. truncatula roots overexpressing CaM2, CaM2R91A, or the empty vector (EV) were assessed for NIN expression in response to Nod factor (A), endosymbioses association with S. meliloti 2011 (BD), and arbuscular mycorrhiza (EG). (A) Expression analyses of the endosymbiosis-induced gene NIN by qRT-PCR in hairy roots expressing the indicated genetic construct. Hairy roots were harvested 6 h after treatment with 10−8 M Nod factor. Expression was normalized to UBC9 (TC106312). Bars, error bars, and circles represent mean, SD, and individual values, respectively (n = 3). P values (P) are shown (Dunnett’s test, comparison to EV). n.s., no significant difference. (B) Number of infection pockets and infection threads per root length at 6 d post inoculation (dpi) with Sm2011. (C and D) Number of nodules per plant after 14 dpi (C) and 28 dpi (D) with Sm2011. (EG) Percentage of root length colonization of R. irregularis including intraradical hyphae, arbuscule, and vesicle at early stage of colonization (E), mid stage of colonization (F), and later stage of colonization (G). Early, mid, and late stages of colonization correspond to 20, 36, and 50 d post inoculation (dpi), respectively. Results represent the average of three biological replicates. Different letters indicate significant differences (one-way ANOVA; post hoc Bonferroni). (B) n (EV) = 25, n (CaM2) = 24, n (CaM2R91A) = 27. (C) n (EV) = 31, n (CaM2) = 23, n (CaM2R91A) = 30. (D) n (EV) = 24, n (CaM2) = 31, n (CaM2R91A) = 28. (E) n (EV) = 30, n (CaM2) = 30, n (CaM2R91A) = 31. (F) n (EV) = 23, n (CaM2) = 28, n (CaM2R91A) = 23. (G) n (EV) = 28, n (CaM2) = 28, n (CaM2R91A) = 26. (BG) Error bars represent SD.
Fig. 5.
Fig. 5.
CaM2R91A amplifies transcriptional induction of nodulation genes. (A and B) Expression analyses of CaM2 and endosymbiosis-induced genes by qRT-PCR in hairy roots expressing the indicated genetic construct. Hairy roots were harvested 14 d post inoculation (dpi) with S. meliloti strain 2011 (A) or 36 d after inoculation (mid stage of colonization) with R. irregularis (B). Expression was normalized to UBC9 (TC106312). CaM2 expression is relative to EV. Bars, error bars, and circles represent mean, SD, and individual values, respectively. (A) n (EV) = 6, n (CaM2) = 6, n (CaM2R91A) = 5. (B) n = 3. P values (P) are shown (Dunnett’s test, comparison to EV). No statistical differences were observed for PT4 and RAM1 expressions in the mycorrhization assay. n.s., no significant difference.

References

    1. Tilman D., Cassman K. G., Matson P. A., Naylor R., Polasky S., Agricultural sustainability and intensive production practices. Nature 418, 671–677 (2002). - PubMed
    1. Bozsoki Z., et al. , Ligand-recognizing motifs in plant LysM receptors are major determinants of specificity. Science 369, 663–670 (2020). - PubMed
    1. Carotenuto G., et al. , The rice LysM receptor-like kinase OsCERK1 is required for the perception of short-chain chitin oligomers in arbuscular mycorrhizal signaling. New Phytol. 214, 1440–1446 (2017). - PubMed
    1. Madsen E. B., et al. , A receptor kinase gene of the LysM type is involved in legume perception of rhizobial signals. Nature 425, 637–640 (2003). - PubMed
    1. Radutoiu S., et al. , Plant recognition of symbiotic bacteria requires two LysM receptor-like kinases. Nature 425, 585–592 (2003). - PubMed