. 2022 Mar 29;119(13):e2112240119.
doi: 10.1073/pnas.2112240119. Epub 2022 Mar 24.

CHROMOMETHYLTRANSFERASE3/KRYPTONITE maintains the sulfurea paramutation in Solanum lycopersicum

Affiliations

CHROMOMETHYLTRANSFERASE3/KRYPTONITE maintains the sulfurea paramutation in Solanum lycopersicum

Cláudia Martinho et al. Proc Natl Acad Sci U S A. .

Abstract

SignificanceParamutation involves the transfer of a repressive epigenetic mark between silent and active alleles. It is best known from exceptional non-Mendelian inheritance of conspicuous phenotypes in maize but also in other plants and animals. Recent genomic studies, however, indicate that paramutation may be less exceptional. It may be a consequence of wide-cross hybridization and may contribute to quantitative trait variation or unstable phenotypes in crops. Using the sulfurea (sulf) locus in tomato, we demonstrate that a self-reinforcing feedback loop involving DNA- and histone-methyl transferases CHROMOMETHYLTRANSFERASE3 (CMT3) and KRYPTONITE (KYP) is required for paramutation of sulf and that there is a change in chromatin organization. These findings advance the understanding of non-Mendelian inheritance in plants.

Keywords: epigenetic memory; heredity; paramutation; tomato.


Conflict of interest statement

The authors declare no competing interest.

Figures
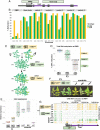
Fig. 1.
Fig. 1.
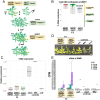
CMT3 maintains sulf. (A) Diagram illustrates TAB2 locus and relative DMR1 and gene body positions. These regions were used for analysis in Fig. 1B (refer to SI Appendix, Table S1 for precise coordinates). (B) Mean % DNA methylation in leaf tissue at CHG subcontext in DMR1, TAB2 gene body, and five random control regions within SL3.0ch02. M82: S. lycopersicum cv. M82 TAB2+ (green), n = 2; and sulf: S. lycopersicum cv. Lukullus TAB2sulf (yellow), n = 2. Coordinates are listed in SI Appendix, Table S1. (C) Diagram illustrates crossing scheme used to generate F3 populations (F3 pedigree). (D) Jittered dots depict % of DNA methylation at DMR1 in individual plants determined by McrBC-qPCR. Plants denote F3 siblings–4-wk-old leaf tissue. The summary of the data is shown as the horizontal line indicating the median. Gray boxes illustrate the data range. The × axis refers to CMT3 genotypes. CMT3/CMT3 TAB2sulf, n = 10; CMT3/cmt3 TAB2sulf, n = 30; cmt3/cmt3 TAB2+, n = 10. P value cmt3/cmt3 versus CMT3/CMT3 was calculated employing a Mann-Whitney–Wilcoxon test. (E) Jittered dots depict relative TAB2 expression in individual plants (4-wk-old leaf tissue) normalized to the geometric mean of the expression of two reference genes (SI Appendix, Table S3). The summary of the data is shown as horizontal line indicating the median. Gray boxes illustrate the data range. F3 plants: CMT3/CMT3 TAB2sulf, n = 11; CMT3/cmt3 TAB2sulf, n = 8; cmt3/cmt3 TAB2+, n = 9. Controls: M82- (S. lycopersicum cv. M82) CMT3/CMT3 TAB2+, n = 3; sulf- (S. lycopersicum cv. Lukullus) CMT3/CMT3 TAB2sulf, n = 3; cmt3- cmt3/cmt3 TAB2+, n = 3. (F) Young leaves from 6-mo-old plants. White bar, 2 cm.1E. (G) TAB2 Integrative Genomics Viewer (IGV) screenshot of bisulfite sequencing data exhibiting CHG DNA methylation (4-wk-old leaf tissue), range [0 to 100]; F3 plants and controls: same as in Fig. 1E. Green tracks refer to green leaf phenotype, and yellow tracks refer to plants that display chlorosis. (A and CG) Yellow boxes refer to plants displaying sulf chlorosis, and green boxes refer to green plants.
Fig. 2.
Fig. 2.
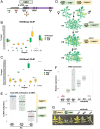
sulf maintenance remains unaffected in nrpe1 mutants. (A) Diagram illustrates crossing scheme used to obtain F3 populations (F3 pedigree). (B) Jittered dots depict % DNA methylation of individual plants at DMR1 determined by McrBC-qPCR. Plants denote F3 siblings–4-wk-old leaf tissue. The summary of the data is shown as horizontal line indicating the median. Gray boxes illustrate the data range. The × axis refers to NRPE1 genotypes. NRPE1/NRPE1 TAB2sulf, n = 35; NRPE1/nrpe1 TAB2sulf, n = 94; nrpe1/nrpe1 TAB2sulf, n = 12. P value nrpe1/nrpe1 versus NRPE1/NRPE1 was calculated employing a Mann-Whitney–Wilcoxon test. (C) Jittered dots depict relative TAB2 expression in individual plants (4-wk-old leaf tissue) normalized to the geometric mean of the expression of two reference genes (SI Appendix, Table S3). The summary of the data is shown as horizontal line indicating the median. Gray boxes illustrate the data range. F3 plants: NRPE1/NRPE1 TAB2sulf, n = 6; NRPE1/nrpe1 TAB2sulf, n = 4; nrpe1/nrpe1 TAB2sulf, n = 4. Controls: M82- (S. lycopersicum cv. M82) NRPE1/NRPE1 TAB2+, n = 2; sulf- (S. lycopersicum cv. Lukullus) NRPE1/NRPE1 TAB2sulf, n = 2; nrpe1-nrpe1/nrpe1 TAB2,+ n = 2. (D) Young leaves from 6-mo-old plants. White bar, 2 cm. (E) DMR1 sRNA size distribution in counts per million (CPM) in F3 plants and controls (4-wk-old leaf tissue). Genotypes are the same as in Fig. 2C. Jittered dots represent individual plants. The summary of the data is shown as horizontal line indicating the median. Errors bars represent the SD. Genotypes are the same as in Fig. 2C. (AE) Yellow boxes refer to plants displaying sulf chlorosis, and green boxes refer to green plants.
Fig. 3.
Fig. 3.
KYP maintains sulf. (A) Diagram represents the relative oligonucleotide position (arrows) spanning the TAB2 locus used for ChIP-qPCR experiments in Fig. 3B. The different letters represent the different TAB2 locus regions. (B) Box plot depicts H3K9me2 enrichment per % input normalized to CAC3 reference locus determined by Chip-qPCR. Jittered dots represent different biological replicates. M82- S. lycopersicum cv. M82 TAB2+ (green), n = 3; sulf- S. lycopersicum cv. Lukullus TAB2sulf (yellow), n = 3. The summary of the data is shown as horizontal line indicating the median of biological replicates. Error bars represent the SD. TE refers to T135 retrotransposon element. (C) Box plot depicts H3K4me3 enrichment per % input normalized to CAC3 reference locus determined by Chip-qPCR. Jittered dots represent different biological replicates. M82- S. lycopersicum cv. M82 TAB2+ (green), n = 2; sulf- S. lycopersicum cv. Lukullus TAB2sulf (yellow), n = 2. The summary of the data is shown as horizontal line indicating the median of biological replicates. Error bars represent the SD. (D) Diagram illustrates crossing scheme used to obtain F3 populations (F3 pedigree). (E) Jittered dots depict % DNA methylation at DMR1 individual plants determined by McrBC-qPCR. Plants denote F3 siblings. The summary of the data is shown as horizontal line indicating the median. Gray boxes illustrate the data range. The × axis refers to KYP genotypes. F3 plants: KYP/KYP TAB2sulf, n = 20; KYP/kyp TAB2sulf, n = 23; kyp/kyp TAB2+, n = 10. P value kyp/kyp versus CMT3/CMT3 was calculated employing a Mann-Whitney–Wilcoxon test. (F) Jittered dots depict relative TAB2 expression in individual plants normalized using the geometric mean of the expression values for two reference genes (SI Appendix, Table S3). The summary of the data is shown as horizontal line indicating the median. Gray boxes illustrate the data range. F3 plants: KYP/KYP TAB2sulf, n = 6; F3 plants: KYP/kyp TAB2sulf, n = 4; kyp/kyp TAB2+, n = 5. Controls: M82- (S. lycopersicum cv. M82) KYP/KYP TAB2+, n = 2; sulf- (S. lycopersicum cv. Lukullus) KYP/KYP TAB2sulf, n = 2; kyp- kyp/kyp TAB2+, n = 2. (G) Young leaves excised from 6-mo-old plants. White bar, 2 cm. (AG) Yellow boxes refer to plants displaying sulf chlorosis, and green boxes refer to green plants. UTR, untranslated region.
Fig. 4.
Fig. 4.
Model to explain the establishment (F1 or F2) and maintenance of the sulf paramutation in tomato. Scenarios 1 and 2 represent alternative hypotheses to explain the establishment of the sulf paramutation, which are not mutually exclusive. In Scenario 1, the establishment of paramutation requires a CMT3/KYP–dependent compact chromatin conformation, which in turn facilitates the exchange of epigenetic marks. In Scenario 2, the initial round of DNA methylation at TAB2 is initiated by RdDM and sRNAs. We show that CMT3/KYP is required either to complete silencing or/and maintain TAB2sulf in subsequent cell divisions and across generations. Yellow/orange boxes represent the silenced paramutagenic epiallele TAB2sulf, which exists in a compact chromatin conformation. Green boxes represent the active paramutable TAB2+ epiallele in which chromatin exists in a less compact structure and therefore remains more accessible to the transcription machinery.

Similar articles

Cited by

References

    1. Hollick J. B., Paramutation and related phenomena in diverse species. Nat. Rev. Genet. 18, 5–23 (2017). - PubMed
    1. Pilu R., Paramutation phenomena in plants. Semin. Cell Dev. Biol. 44, 2–10 (2015). - PubMed
    1. Hövel I., Pearson N. A., Stam M., Cis-acting determinants of paramutation. Semin. Cell Dev. Biol. 44, 22–32 (2015). - PubMed
    1. Ellew C. P., The genetics of “rogues” among culinary peas (Pisum sativum). Proc. R. Soc. London. Ser. B, Contain. Pap. a Biol. Character 91, 186–195 (1920).
    1. Hagemann R., [Somatic conversion in Lycopersicon esculentum Mill] [Article in German]. Z. Vererbungsl. 89, 587–613 (1958). - PubMed