

Liver T1 relaxation time of the 'normal liver' in healthy Asians: measurement with MOLLI and B1-corrected VFA methods at 3T
- PMID: 35324344
- PMCID: PMC10993984
- DOI: 10.1259/bjr.20211008
Liver T1 relaxation time of the 'normal liver' in healthy Asians: measurement with MOLLI and B1-corrected VFA methods at 3T
Abstract
Objectives: Liver T1 is a potential magnetic resonance imaging biomarker for liver diseases. This study aimed to determine the T1 relaxation time of the normal liver (PDFF<5%) in healthy Asian volunteers using modified look-locker inversion recovery (MOLLI) and B1 inhomogeneity-corrected variable flip angle (B1-corrected VFA).
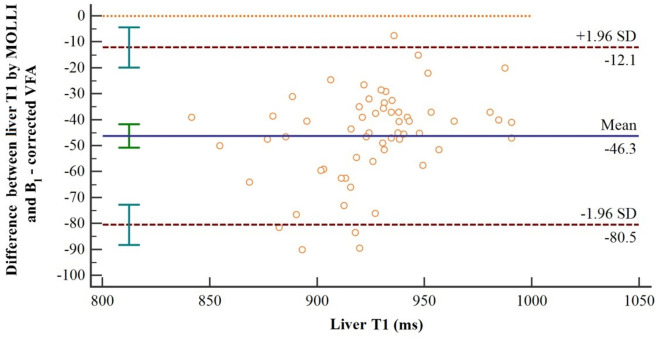
Methods: 60 healthy Asian volunteers without focal or diffuse liver disease underwent a liver scan at 3T magnetic resonance. Proton density fat fraction (PDFF) and liver stiffness measurements were applied for the quantification of liver fat and fibrosis. T1 mapping was performed with MOLLI and B1-corrected VFA sequences. Bland-Altman, linear regression, Student t-test, and one-way analysis of variance were used for statistical analysis.
Results: The mean T1 relaxation times of the whole liver were 901 ± 34 ms by MOLLI, and 948 ± 29 ms by B1-corrected VFA in healthy volunteers. There was a strong correlation (r = 0.86, p < 0.0001) for liver T1 between two T1 mapping methods. There were significant differences between the right and left lobes in liver T1 relaxation times using both methods (p < 0.05). Gender and Asian ethnic disparities had no impact on liver T1 relaxation times.
Conclusion: T1 relaxation times of the normal liver (PDFF<5%) in healthy volunteers were established by MOLLI and B1-corrected VFA T1 mapping methods at 3T. It may provide suitable and robust baseline values for the assessment of liver diseases.
Advances in knowledge: Gender and Asian ethnic disparities do not impact liver T1 relaxation time measurements.
Figures


References
-
- Obmann VC, Mertineit N, Marx C, Berzigotti A, Ebner L, et al. . Liver mr relaxometry at 3t - segmental normal t1 and t2* values in patients without focal or diffuse liver disease and in patients with increased liver fat and elevated liver stiffness . Sci Rep 2019. ; 9: 1 – 11 . doi: 10.1038/s41598-019-44377-y - DOI - PMC - PubMed
-
- Kim JE, Kim HO, Bae K, Choi DS, Nickel D . T1 mapping for liver function evaluation in gadoxetic acid-enhanced mr imaging: comparison of look-locker inversion recovery and b1 inhomogeneity-corrected variable flip angle method . Eur Radiol 2019. ; 29: 3584 – 94 . doi: 10.1007/s00330-018-5947-4 - DOI - PubMed
