. 2022 May 9;7(9):e158783.
doi: 10.1172/jci.insight.158783.

The synovial and blood monocyte DNA methylomes mirror prognosis, evolution, and treatment in early arthritis

Affiliations

The synovial and blood monocyte DNA methylomes mirror prognosis, evolution, and treatment in early arthritis

Carlos de la Calle-Fabregat et al. JCI Insight. .

Abstract

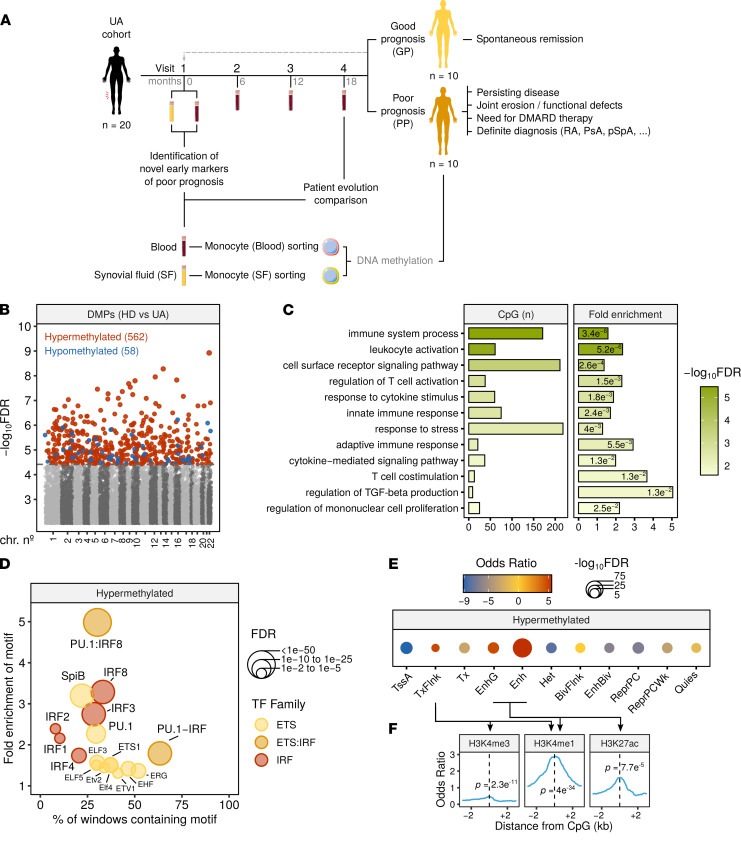
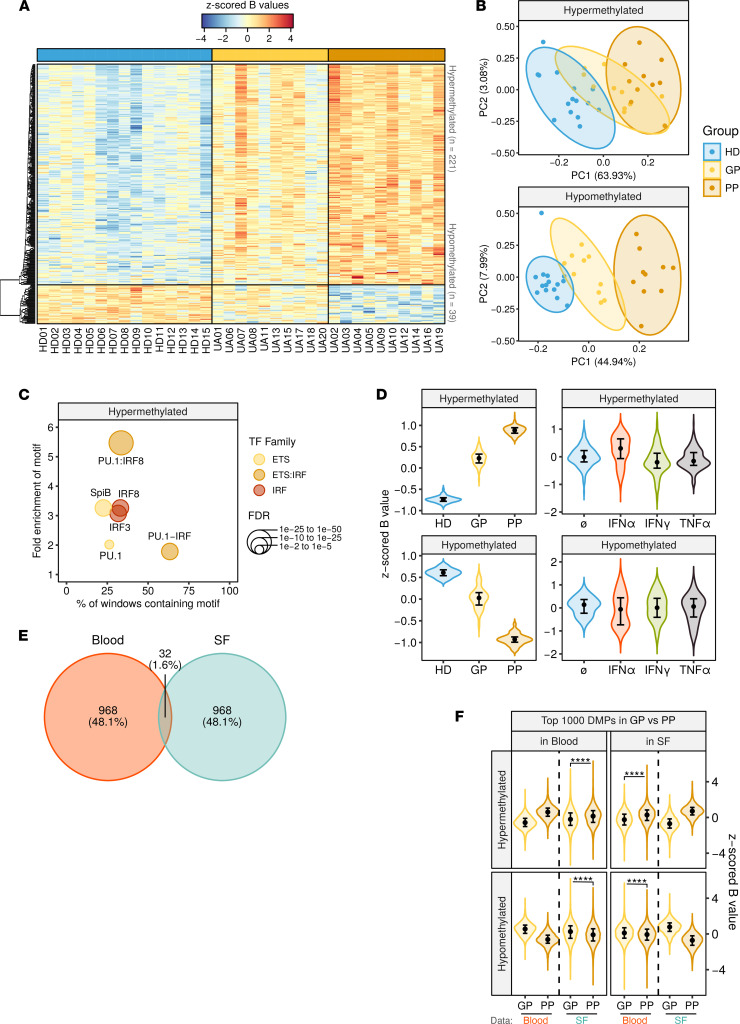
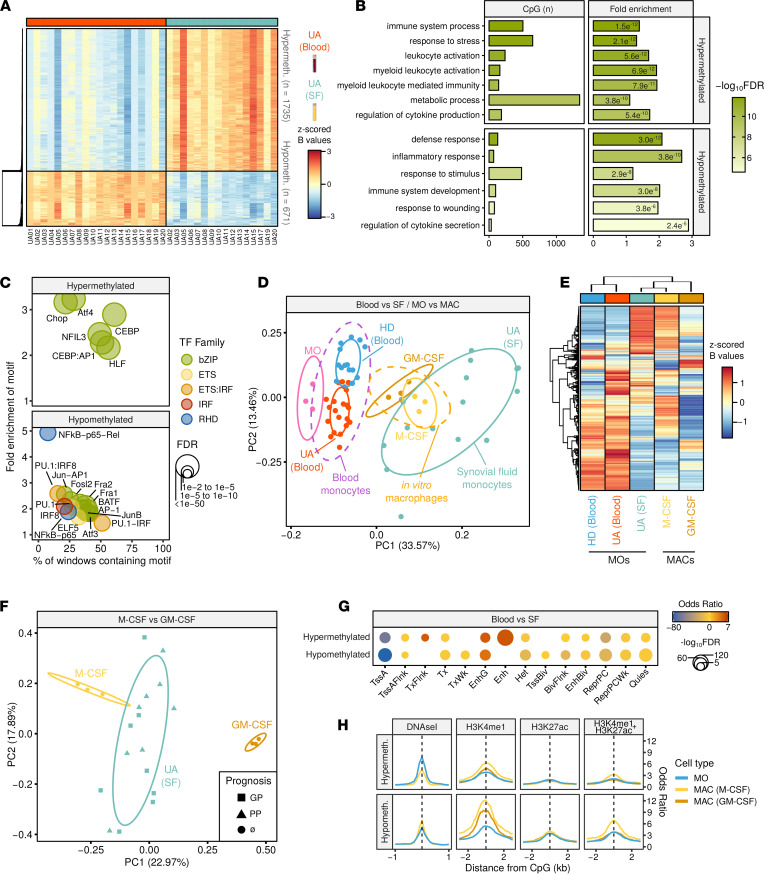
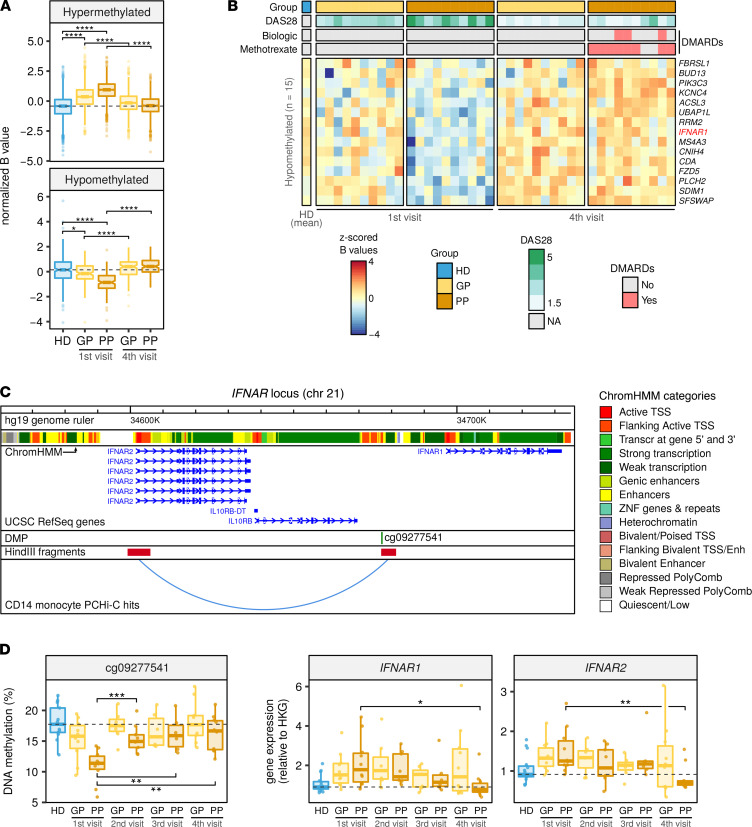
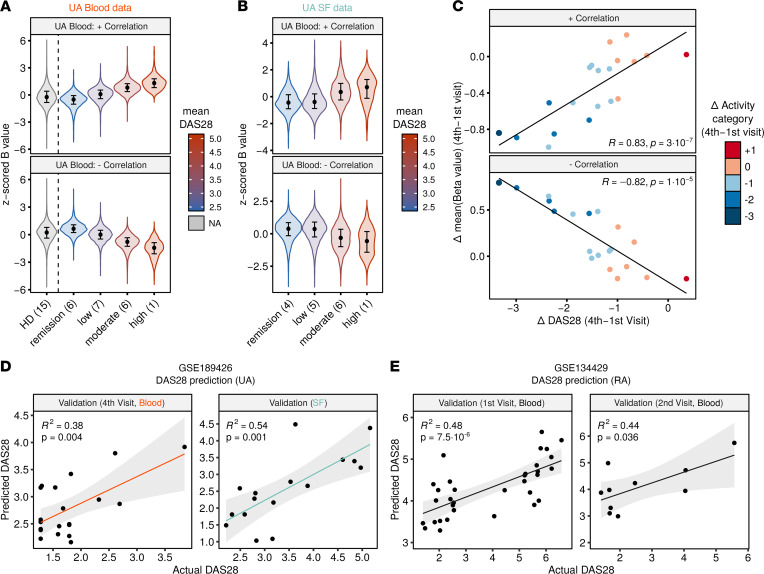
Identifying predictive biomarkers at early stages of inflammatory arthritis is crucial for starting appropriate therapies to avoid poor outcomes. Monocytes (MOs) and macrophages, largely associated with arthritis, are contributors and sensors of inflammation through epigenetic modifications. In this study, we investigated associations between clinical features and DNA methylation in blood and synovial fluid (SF) MOs in a prospective cohort of patients with early inflammatory arthritis. DNA methylation profiles of undifferentiated arthritis (UA) blood MOs exhibited marked alterations in comparison with those from healthy donors. We identified additional differences both in blood and SF MOs after comparing patients with UA grouped by their future outcomes, i.e., good versus poor. Patient profiles in subsequent visits revealed a reversion toward a healthy level in both groups, those requiring disease-modifying antirheumatic drugs and those who remitted spontaneously. Changes in disease activity between visits also affected DNA methylation, which was partially concomitant in the SF of UA and in blood MOs of patients with rheumatoid arthritis. Epigenetic similarities between arthritis types allow a common prediction of disease activity. Our results constitute a resource of DNA methylation-based biomarkers of poor prognosis, disease activity, and treatment efficacy for the personalized clinical management of early inflammatory arthritis.

Keywords: Arthritis; Autoimmunity; Epigenetics; Inflammation.


Conflict of interest statement

Conflict of interest: The authors have declared that no conflict of interest exists.

Figures

Figure 1
Figure 1. DNA methylation differences between UA and HD blood MOs.
(A) Flowchart summarizing the cohort timeline characteristics and the analytical workflow. (B) Manhattan plot depicting differential methylation significance results, by autosome. Colored dots indicate significant DMPs (limma FDR < 0.05) between UA (n = 20) and HD (n = 15). Blue indicates hypomethylation in UA, and red indicates hypermethylation in UA, relative to HD. (C) Significant GO categories selected from the analysis with GREAT of the hypermethylated DMPs. The number of CpGs, fold enrichment, and hypergeometric test P value are depicted for every category. (D) Significantly enriched TF motifs in the hypermethylated cluster regions, identified by HOMER. (E) Chromatin functional state enrichment analysis of the hypermethylated DMPs on CD14 primary cells ChromHMM public data from Roadmap Epigenomics Project. (F) Enrichment of MO histone mark ChIP-Seq public data around the hypermethylated DMP coordinates. P values are derived from Fisher’s exact tests. Arrows specify which histone marks are contained in each of the chromatin state categories in E. TssA, active TSS; TxFlnk, transcript at gene 5′ and 3′; Tx, strong transcription; EnhG, genic enhancers; Enh, enhancers; Het, heterochromatin; BivFlnk, flanking bivalent TSS/Enh; EnhBiv, bivalent enhancer; ReprPC, repressed PolyComb; ReprPCWk, weak repressed PolyComb; Quies, quiescent.
Figure 2
Figure 2. DNA methylation differences between GP, PP, and HD.
(A) Heatmap showing DMPs (FDR < 0.05) between GP group (n = 10), PP group (n = 10), and HD group (n = 15). Blue and red indicate lower and higher methylation, respectively. (B) PCA of the DMPs in A. Ellipses show the 95% CI of the distribution of every sample group. (C) Significantly enriched TF motifs in the hypermethylated cluster regions, identified by HOMER. (D) Violin plots showing z-scored β values of the hypermethylated and hypomethylated clusters, in data from A and in public data from MOs purified after PBMC stimulation with cytokines for 4 days (n = 3). (E) Venn diagram showing overlap between the top 1000 most significant DMPs in the GP versus PP comparison, in blood (n = 10 patients in each group) and SF MOs (n = 8 patients in each group). (F) Violin plot showing the top 1000 most significant DMPs in GP versus PP comparison in blood and SF. The x axis indicates which data are contained in every violin plot, while column facets indicate the data set from which the top DMPs were selected. For the data sets not included in the DMP selection, differences in the medians were verified by a Wilcoxon’s test. ****P < 0.0001. In D and F, violin plots show density curves, and circles and vertical lines show the median and the 25th to 75th percentiles.
Figure 3
Figure 3. DNA methylation study in synovial MOs.
(A) Heatmap showing DMPs between blood (n = 20) and SF (n = 16) MOs, paired by patient (FDR < 0.05, Δβ ≥ 0.15). (B) Significant GO categories selected from the analysis with GREAT of the DMPs. The number of CpGs, fold enrichment, and hypergeometric test P value is depicted for every category. (C) Significantly enriched TF motifs in the DMP regions, identified by HOMER. (D) PCA of the DMPs between the UA data set (HD, n = 15), UA blood (n = 20) and UA SF (n = 16), on one hand, and between conditions in the MAC in vitro differentiation data set (MO, n = 3), M-CSF (n = 3) and GM-CSF (n = 3), on the other (see Methods). (E) Heatmap of the DMPs in D for HD, UA blood, SF blood, M-CSF, and GM-CSF with hierarchical clustering. (F) PCA of the DMPs in the M-CSF versus GM-CSF. MAC subtypes and UA SF samples are displayed in different colors, and the prognostic group is indicated by shape. (G) Chromatin functional state enrichment analysis of the DMPs on CD14 primary cells public data from the Roadmap Epigenomics Project. (H) Enrichment of MO and MAC histone mark ChIP-Seq public data around the hypermethylated DMP coordinates. Cell types are indicated by colors. Arrows specify which histone marks are contained in each of the chromatin state categories in F. RHD, Rel homology domain; TssA, active TSS; TssAFlnk, flanking active TSS; TxFlnk, transcript at gene 5′ and 3′; Tx, strong transcription; TxWk, weak transcription; EnhG, genic enhancers; Enh, enhancers; Het, heterochromatin; TssBiv, bivalent/poised TSS; BivFlnk, flanking bivalent TSS/Enh; EnhBiv, bivalent enhancer; ReprPC, repressed PolyComb; ReprPCWk, weak repressed PolyComb; Quies, quiescent.
Figure 4
Figure 4. Evolution of DNA methylation profiles in subsequent visits.
(A) Box plots showing z-scored β values of DMPs between the first and fourth visits, by GP and PP, paired by patient and using DAS28 as a covariate (FDR < 0.05). (B) Heatmap of the DMPs in the hypomethylated cluster. Group, DAS28, and treatment are shown for every patient at the top, and the respective legend scales are shown to the right of the heatmap. Blue and red indicate lower and higher methylation, respectively. (C) IFNAR locus with PCHi-C interaction public data. (D) DNA methylation of cg09277541 (left panel) and gene expression of IFNAR1 and IFNAR2 (right panel) in visits 1–4, by prognosis group. DMP and interacting HindIII fragments are shown below a genome browser annotation of transcripts and MO ChromHMM tracks (see Methods). DNA methylation and gene expression from D were analyzed by bisulfite pyrosequencing and qRT-PCR, respectively. RPL38 was used as the HKG. The number of samples analyzed for each group in every time point is indicated in Supplemental Figure 1A. In A and D, each box represents the 25th to 75th percentiles. The lines inside the boxes represent the median. The lines outside the boxes represent the 25th percentile minus 1.5 times the IQR and the 75th percentile plus 1.5 times the IQR. Pairwise group differences were evaluated by 2-tailed Wilcoxon’s tests. *P < 0.05, **P < 0.01, ***P < 0.001, ****P < 0.0001.
Figure 5
Figure 5. Correlation of DNA methylation and DAS28 in blood and SF of UA.
(A) Violin plots showing z-scored β values of DAS28-correlated CpGs (P < 0.001, ρ ≥ 0.7), by activity category, in blood MOs. (B) Violin plots showing z-scored β values of DAS28-correlated CpGs in blood, by activity category, in SF MOs. Color in A and B indicates mean DAS28 score of each group. The number of samples in every activity category is noted in parentheses. (C) Scatter plots showing the correlation between the Δ of DAS28 and the Δ of z-scored β values between the first and fourth visits, in blood. Color indicates changes in activity categories. (D) Linear regression prediction of DAS28 from DNA methylation. First-visit blood samples were used to train the model, and prediction was performed on fourth-visit blood samples and first-visit SF samples. (E) Linear regression prediction of DAS28 on public data of MO samples from patients with RA, at first and second visits, after follow-up. In D and E, correlation coefficients (R2) and P values were calculated by Pearson’s correlation. Activity categories are defined as follows by the DAS28 value: remission (<2.6), low activity (2.6–3.2), moderate activity (3.2–5.1), and high activity (>5.1). In A and B, violin plots show density curves, and circles and vertical lines show the median and the 25th to 75th percentiles. The number of samples in D and E is indicated in Supplemental Figure 3G. In D and E, gray shades indicate the 95% CI of the value distributions.

References

    1. Aletaha D, et al. Rheumatoid arthritis classification criteria: an American College of Rheumatology/European League Against Rheumatism collaborative initiative. Arthritis Rheum. 2010;62(9):2569–2581. doi: 10.1002/art.27584. - DOI - PubMed
    1. Taylor W, et al. Classification criteria for psoriatic arthritis: development of new criteria from a large international study. Arthritis Rheum. 2006;54(8):2665–2673. doi: 10.1002/art.21972. - DOI - PubMed
    1. Rudwaleit M, et al. The Assessment of SpondyloArthritis International Society classification criteria for peripheral spondyloarthritis and for spondyloarthritis in general. Ann Rheum Dis. 2011;70(1):25–31. doi: 10.1136/ard.2010.133645. - DOI - PubMed
    1. Van Aken J, et al. Comparison of long term outcome of patients with rheumatoid arthritis presenting with undifferentiated arthritis or with rheumatoid arthritis: an observational cohort study. Ann Rheum Dis. 2006;65(1):20–25. doi: 10.1136/ard.2005.038471. - DOI - PMC - PubMed
    1. de la Calle-Fabregat C, et al. Prediction of the progression of undifferentiated arthritis to rheumatoid arthritis using DNA methylation profiling. Arthritis Rheumatol. 2021;73(12):2229–2239. doi: 10.1002/art.41885. - DOI - PubMed

Publication types