. 2022 May 2;132(9):e152373.
doi: 10.1172/JCI152373.

Platelet olfactory receptor activation limits platelet reactivity and growth of aortic aneurysms

Affiliations

Platelet olfactory receptor activation limits platelet reactivity and growth of aortic aneurysms

Craig N Morrell et al. J Clin Invest. .

Abstract

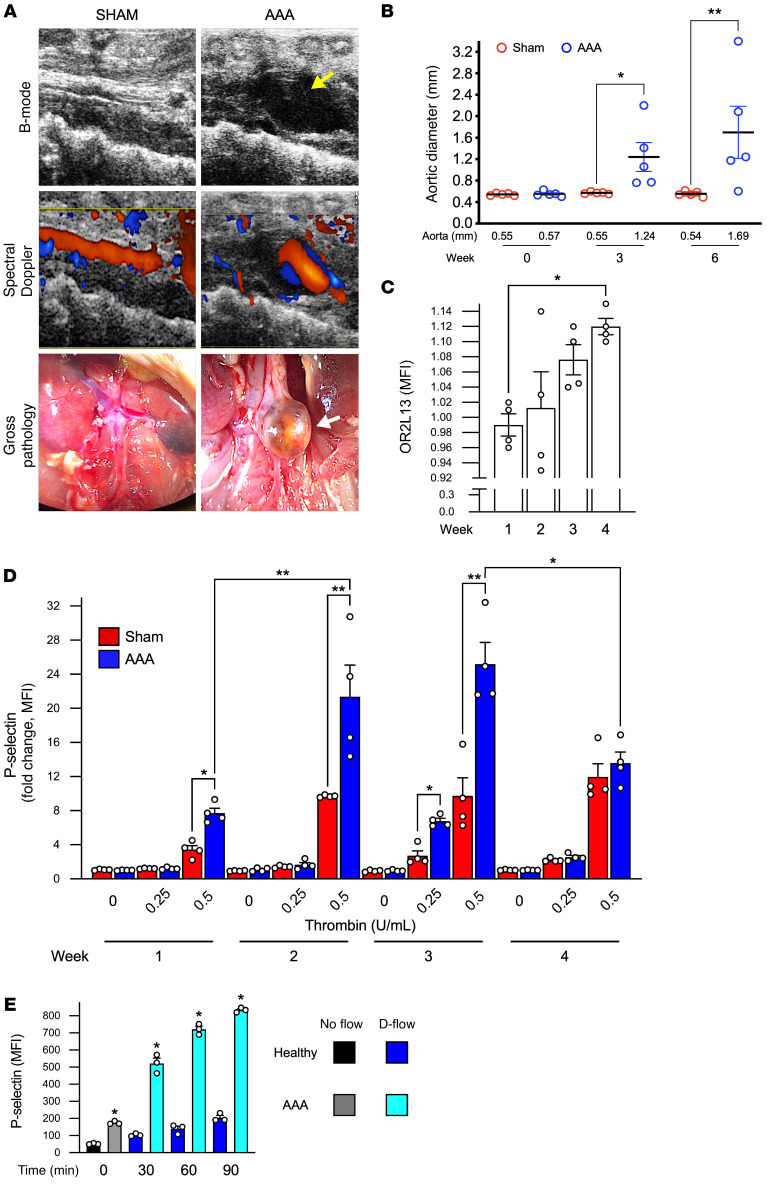
As blood transitions from steady laminar flow (S-flow) in healthy arteries to disturbed flow (D-flow) in aneurysmal arteries, platelets are subjected to external forces. Biomechanical platelet activation is incompletely understood and is a potential mechanism behind antiplatelet medication resistance. Although it has been demonstrated that antiplatelet drugs suppress the growth of abdominal aortic aneurysms (AAA) in patients, we found that a certain degree of platelet reactivity persisted in spite of aspirin therapy, urging us to consider additional antiplatelet therapeutic targets. Transcriptomic profiling of platelets from patients with AAA revealed upregulation of a signal transduction pathway common to olfactory receptors, and this was explored as a mediator of AAA progression. Healthy platelets subjected to D-flow ex vivo, platelets from patients with AAA, and platelets in murine models of AAA demonstrated increased membrane olfactory receptor 2L13 (OR2L13) expression. A drug screen identified a molecule activating platelet OR2L13, which limited both biochemical and biomechanical platelet activation as well as AAA growth. This observation was further supported by selective deletion of the OR2L13 ortholog in a murine model of AAA that accelerated aortic aneurysm growth and rupture. These studies revealed that olfactory receptors regulate platelet activation in AAA and aneurysmal progression through platelet-derived mediators of aortic remodeling.

Keywords: Platelets; Signal transduction; Thrombosis; Vascular Biology.


Figures

Figure 1
Figure 1. Platelet reactivity is enhanced in patients with AAA.
(A) Washed platelets from patients with AAA (n = 18) compared with healthy individuals (n = 10). Platelet activation before and after stimulation with a thromboxane receptor agonist (U46619) or a PAR1 agonist (TRAP-6) for 15 minutes. Platelet activation was quantified by FACS as the MFI and is represented as the median (horizontal line) in a box-and-whisker plot for each group, performed in quadruplicate and summed for each patient at each concentration of agonist. *P < 0.05 and **P < 0.01 versus healthy control; group differences were analyzed by Kruskal-Wallis test followed by Dunn’s post test correction. (B) Human platelet RNA was extracted from healthy individuals (n = 7) and compared with that of patients with AAA (n = 6) by mRNA-Seq. Volcano plot shows genes upregulated (red) and downregulated (green) in patients with AAA. Dashed line is the threshold of discrimination. Heatmap with upstream olfactory receptor 2L13 (OR2L13) and downstream anoctamin, which was higher in AAA platelets compared with heathy conditions. (C) RNA isolated from washed platelets followed by CD45-mediated immunodepletion of WBCs; then qRT-PCR normalized to the platelet GPIIb gene (ITGA2B). Data from 4 individual healthy males, each run in quadruplicate, are indicated by violin plots for the 3 olfactory receptors present in every individual tested. (D) Lysate from healthy human platelets or human brain (positive control) separated by SDS-PAGE before probing with an anti-OR2L13 antibody. (E) Platelets from healthy humans on a fibrinogen matrix assessed for OR2L13 immunofluorescence by confocal microscopy. A FITC-tagged OR2L13 antibody (green) and rhodamine-tagged phalloidin (red) for filamentous actin. DIC, differential interference contrast. Scale bars: 10 μm.
Figure 2
Figure 2. Platelet olfactory receptor expression increases in AAA.
(A) Alpha granules were identified by a rhodamine-tagged P selectin antibody (red). Dense granules were detected by staining phosphate groups in adenosine diphosphate (ADP, blue) by confocal microscopy. Spearman’s ρ was determined by computer-generated colocalization overlay of OR2L13 and P selectin (0.71 ± 0.04) or ADP (0.25 ± 0.07) and is represented as the mean ± SEM. n = 7–8 individuals. P < 0.0001, by 2-tailed Student’s t test. Scale bars: 10 μm. (B) Immunoblotting platelets for OR2L13 expression, which was increased in AAA compared with healthy conditions, is represented as the mean ± SEM. n = 4 in each group. P = 0.035, by 2-tailed Student’s t test. (C) OR2L13 localization and surface area by confocal microscopy and flow cytometry. Confocal microscopy was used to visualize platelet surface area by spreading on a fibrinogen matrix, with quantification as the mean surface area ± SEM. n = 7–10. Mann-Whitney U test. Scale bars: 5 μm. Platelet surface OR2L13 was quantified by FACS as the MFI ± SEM. n = 4–6. Mann-Whitney U test.
Figure 3
Figure 3. Biomechanical stimulation of platelets increases activation.
(A) Color flow Doppler imaging of a large infrarenal AAA demonstrates an alternating direction of blood flow (disturbed flow, D-flow). (B) An in vitro flow-and-cone system was used to subject healthy platelets to steady laminar flow (S-flow) or D-flow for 120 minutes. (C) Platelet activation following S-flow and D-flow was quantified by surface P selectin expression or fibrinogen binding by FACS as the MFI ± SEM. n = 4. P < 0.001 versus static flow, by 1-way ANOVA followed by Bonferroni’s correction. (D) Healthy human platelets were subjected to static flow, S-flow, or D-flow for 120 minutes. Immobilization of platelets after S-flow and D-flow on a fibrinogen matrix and visualization by confocal microscopy. Platelets were stained with an FITC-tagged antibody for OR2L13 (green) and rhodamine-tagged phalloidin for actin (red). Scale bar: 5 μm. (E) In a separate set of experiments, platelet membrane OR2L13 was quantified after S-flow and D-flow by FACS as the MFI ± SEM. n = 4. P < 0.001 versus static flow, by 1-way ANOVA followed by Bonferroni’s correction.
Figure 4
Figure 4. Characterization of OR2L13 agonists.
(A) Human OR2L13 was subcloned in frame with HA (GFP in a secondary cassette, green) and coexpressed with receptor transport protein 1s (RTP1s) (mCherry in a secondary cassette, red) stably in HEK293/cAMP cells. Microscopy and Western blotting confirmed OR2L13-HA expression. Original magnification, ×20. TCL, total cell lysate. OR2L13 ligands stimulated (Golf), and adenyl cyclase produced cAMP. (B) A cAMP response element (CRE) expressing HEK293 cells with stable integration of OR2L13-HA was utilized to screen for ligands. (C) Alpha screen of olfactory ligands in OR2L13 transduced/nontransduced cells with more than 1.0 ratio (red dashed line) for OR2L13 activation; (–) carvone activated OR2L13 to generate cAMP (performed in duplicate, horizontal line indicates the mean). Results of a confirmatory experiment with vehicle versus (–) carvone are shown as the mean ± SEM. n = 4 (right). *P = 0.079, **P = 0.0001, and ***P < 0.0001 versus vehicle, by 1-way ANOVA followed by Bonferroni’s correction.
Figure 5
Figure 5. A conserved olfactory receptor signal transduction pathway in healthy platelets.
(A) Proposed platelet OR2L13 signal transduction. Levo-carvone (L-carvone) binds to OR2L13 on platelets to generate cAMP through adenylyl cyclase activation, and cAMP changes the cytosolic concentration of calcium (Ca2+) directly and chloride conductance (Cl), while inhibiting platelet reactivity through known, well-described mechanisms involving protein kinase A (PKA). (B) (–) Carvone (300 μM) or forskolin (10 μM) incubation with human platelets for 5 minutes generates cAMP. Forskolin was used as a positive control for adenylyl cyclase activity and ATP hydrolysis to cAMP. n = 7. *P = 0.0059 and **P = 0.0089 versus vehicle, by Kruskal-Wallis test followed by Dunn’s post test. (C) Carvone stimulation (300 μM) of healthy platelets promoted chloride efflux. Data are shown as the mean ± SEM (n = 4, MQAE fluorescence). *P = 0.0134, (–) carvone versus control, by 2-tailed Student’s t test. (D) Carvone stimulation (300 μM) of healthy platelets promoted local brief calcium transients 20%–80% above baseline, which was sustained compared with 0.5 U/mL thrombin that attenuated over time (n = 5 human platelets, Fura-2 fluorescence). MQAE, -[ethoxycarbonylmethyl]-6-methoxy-quinoliniumbromide. Arrowhead, drug addition.
Figure 6
Figure 6. A OR2L13 agonist potently inhibits platelet aggregation.
(A) Platelets were isolated from healthy individuals and preincubated with (–) carvone or (+) carvone (300 μM) for 30 minutes. Platelets were stimulated with ADP (0.1 μM), and light transmission aggregometry was performed to assess platelet activation. Representative tracings for each agonist are shown. (B) Carvone (300 μM) or forskolin (10 μM) incubation individually or together for 30 minutes followed by platelet stimulation with ADP (0.1 μM). Light transmission aggregometry was performed to assess platelet activation. Representative aggregometry tracings are shown. V, vehicle; C, (–) carvone, f, forskolin. n = 3. Differences between groups were assessed by 1-way ANOVA followed by Bonferroni’s correction; *P < 0.0001, **P = 0.0003, and ***P < 0.0001 versus vehicle. (C) Summary data from light transmission aggregometry for each agonist are presented as the mean ± SEM. n = 3. *P = 0.08 versus vehicle and **P = 0.0013 versus vehicle, by 1-way ANOVA followed by Bonferroni’s correction. (D) Platelets were isolated from healthy individuals and preincubated with (–) carvone (0–500 μM) for 30 minutes, followed by stimulation with ADP (0.1 μM). Light transmission aggregometry was performed to assess platelet activation. Representative tracings for each agonist are shown. (E) Summary data for each concentration of (–) carvone are presented as the mean ± SEM in the presence of ADP stimulation (0.1 μM). The downward red arrow is ADP in the presence of vehicle to which all data points were compared. n = 3 in each group. *P < 0.05 versus vehicle, by 1-way ANOVA followed by Bonferroni’s correction. The broken blue line indicates the log IC50 concentration of (–) carvone.
Figure 7
Figure 7. Biomechanical platelet activation is inhibited by OR2L13 agonists.
(A) In vitro exposure of healthy platelets to steady laminar flow (S-flow) or disturbed flow (D-flow) for 60 minutes after a 30-minute pretreatment with vehicle or (–) carvone (300 μM). Platelet activation was quantified by surface P selectin expression as the MFI ± SEM. n = 3 in each group; 2-way ANOVA. (B) Calcein green–loaded healthy human blood flowing through a collagen I–coated microfluidics chamber at 40 dyn/cm2 and imaged by confocal microscopy for adherent thrombus (green puncta) at 3 minutes. Data are presented as the mean thrombus area of random fields ± SEM following 30 minutes of vehicle (0.25% DMSO) or (–) carvone treatment (300 μM). n = 6–7 in each group. Differences between groups were assessed by 2-tailed Student’s t test; *P < 0.0001 versus vehicle. (C) WT FVB/Tac mice were given 100 mg/kg/day (–) carvone i.p. for 3 days. Platelets were isolated and stimulated in the presence of thrombin. Platelet activation was quantified by FACS as the MFI ± SEM. n = 4. *P = 0.061, **P = 0.007, and ***P < 0.0001 versus vehicle, by 1-way ANOVA followed by Bonferroni’s correction. (D) Time to hemostasis in mice treated with (–) carvone following surgical amputation of tail tip in seconds ± SEM. n = 6–9 in each group. *P = 0.0046 versus vehicle, by Mann-Whitney U test.
Figure 8
Figure 8. Platelets are biomechanically activated in mice and humans with AAA.
(A) WT male C57BL/6J mice treated with topical aortic elastase or heat-inactivated elastase (sham) with BAPN in drinking water developed stable AAA with luminal thrombus (yellow arrow). Top: B-mode ultrasound, middle: color spectral Doppler interrogation of the aneurysmal region shows D-flow (Doppler [red alternating to blue]) bottom: dissecting video microscopy at the end of the protocol with marked aneurysm (white arrow) below the renal artery. Time point is 6 weeks after AAA. (B) Aortic diameter by ultrasound is shown as the mean ± SEM (diameter indicated below the graph). n = 5. *P = 0.114 and **P = 0.0046, by repeated-measures 1-way ANOVA followed by Bonferroni’s correction. (C) Platelet surface OR2L13 expression for translocation from baseline and after 4 weeks of AAA induction as the MFI ± SEM. n = 4. *P = 0.0251, by 1-way ANOVA followed by Bonferroni’s correction. (D) Platelet surface P selectin for platelet activation after dose-dependent thrombin stimulation in sham-operated or AAA mice in weeks 1–4 after AAA induction. n = 4 in each group. Differences between groups were determined by 2-way ANOVA; *P < 0.01 and **P < 0.001. (E) An in vitro flow-and-cone system was used to subject healthy platelets to static flow (0) or disturbed flow (D-flow) for 0–90 minutes. Platelet activation as the mean surface P selectin ± SEM, n = 3 in each group, by 1-way ANOVA followed by Bonferroni’s correction.
Figure 9
Figure 9. Platelet OR2L13 agonists suppress platelet reactivity and AAA growth.
(A) Nonreducing SDS-PAGE of human platelet lysates for MMP activity was examined by in-gel zymography, and protein content was examined by immunoblotting. MMP9 content was similar, although activated MMP was enriched in platelets from patients with AAA compared with those from healthy individuals (n = 4–5). Data were quantified as the mean ± SEM and normalized to GAPDH (n = 4–10). Differences between groups were determined by 2-tailed Student’s t test. TIMP, tissue inhibitor of MMP. Protein size is indicated in kDa. (B) Aortic diameter by ultrasound following aspirin (30 mg/L, drinking water) therapy or daily i.p. injection of 100 mg/kg (–) carvone compared with vehicle starting on day 7 protected FVB/NTac mice from fast AAA growth (n = 4–20). *P = 0.0002 and **P < 0.0001 versus vehicle, by 1-way ANOVA followed by Bonferroni’s correction. (C) Aortic lysate at week 4 following AAA was assessed for MMP activity (zymography). Actin and total protein were used as loading controls. Data are representative of 9 WT mice (n = 3 in each group) at 4 weeks. *P = 0.012 and **P = 0.0002 versus vehicle, by 2-way ANOVA. Yellow asterisk indicates a purified and activated MMP2 standard (S). Protein size is indicated in kDa.
Figure 10
Figure 10. CRISPR/Cas9 disruption of the Olfr168 locus augments platelet reactivity.
(A) Sequencing primer design spanning the OR2L13 (FVB/Tac murine olfr168) intron/exon boundaries. Genotyped pups after RNP injection showed the edit (arrow) following PCR with #1/#4 primers and deletion following PCR with #1/#2 primers (right gel, last lane). (B) Sanger sequencing showed an edit in the upstream region of the olfr168 locus (box). Amplified product size is indicated in kb. Het, heterozygote. KO was olfr168–/–. (C) Immunoblotting platelet lysate for the protein product of the FVB/Tac (WT) and null (KO) murine alleles for the olfr168 gene using an anti-OR2L13 antibody. (D) Electron micrographic images of individual WT and olfr168–/– mouse platelets with increased thrombotic granule content apparent in olfr168–/– mouse platelets (arrowheads). Scale bars: 0.5 μm (magnified images). (E) Isolated olfr168–/– platelets showed increased reactivity when stimulated with thrombin ex vivo. Platelet activation is shown as the mean surface P selectin ± SEM. n = 4 in each group. *P < 0.0001, by 1-way ANOVA followed by Bonferroni’s correction.
Figure 11
Figure 11. Olfr168-deficient mice have enhanced platelet and aortic MMP2 activation with accelerated aortic aneurysm growth and rupture.
(A) B-mode ultrasound of infrarenal AAA at week 4 after elastase induction and color spectral Doppler showing marked D-flow in AAA. Bottom: Color spectral Doppler of aortic aneurysmal segments showing disturbed blood in olfr168 –/– mice. (B) AAA growth by ultrasound for WT or olfr168–/– FVB/Tac mice (n = 5–17). *P = 0.0037 WT versus olfr168–/–, by Kruskal-Wallis test followed by Dunn’s post test. (C) Kaplan-Meier survival curves for AAA rupture in WT or olfr168–/– FVB/Tac mice (n = 10 in each group). Differences between groups were evaluated with the log-rank (Mantel-Cox) test; P = 0.042 between groups. (D) Aortic lysate following AAA was assessed for MMP activity (zymography) in FVB/Tac mice at 4 weeks (n = 8 in each group). *P = 0.028 versus Olfr168–/–, by Mann-Whitney U test. MMP2 and total protein (stain) were used as loading controls. (E) Platelet lysate following AAA was assessed for MMP2 activity (zymography) in FVB/Tac mice at 4 weeks (n = 4 in each group). *P = 0.023 versus Olfr168–/–, by 2-tailed Student’s t test.

Similar articles

Cited by

References

    1. Howard DP, et al. Population-based study of incidence and outcome of acute aortic dissection and premorbid risk factor control: 10-year results from the Oxford Vascular Study. Circulation. 2013;127(20):2031–2037. doi: 10.1161/CIRCULATIONAHA.112.000483. - DOI - PMC - PubMed
    1. Sakalihasan N, et al. Activated forms of MMP2 and MMP9 in abdominal aortic aneurysms. J Vasc Surg. 1996;24(1):127–133. doi: 10.1016/S0741-5214(96)70153-2. - DOI - PubMed
    1. Alvarez Marcos F, et al. Effect of antiplatelet therapy on aneurysmal sac expansion associated with type II endoleaks after endovascular aneurysm repair. J Vasc Surg. 2017;66(2):396–403. doi: 10.1016/j.jvs.2016.11.032. - DOI - PubMed
    1. Owens AP, et al. Platelet inhibitors reduce rupture in a mouse model of established abdominal aortic aneurysm. Arterioscler Thromb Vasc Biol. 2015;35(9):2032–2041. doi: 10.1161/ATVBAHA.115.305537. - DOI - PMC - PubMed
    1. Robless PA, et al. Increased platelet aggregation and activation in peripheral arterial disease. Eur J Vasc Endovasc Surg. 2003;25(1):16–22. doi: 10.1053/ejvs.2002.1794. - DOI - PubMed

Publication types

Substances