

The Geographical Distribution and Influencing Factors of COVID-19 in China
- PMID: 35324592
- PMCID: PMC8949350
- DOI: 10.3390/tropicalmed7030045
The Geographical Distribution and Influencing Factors of COVID-19 in China
Abstract
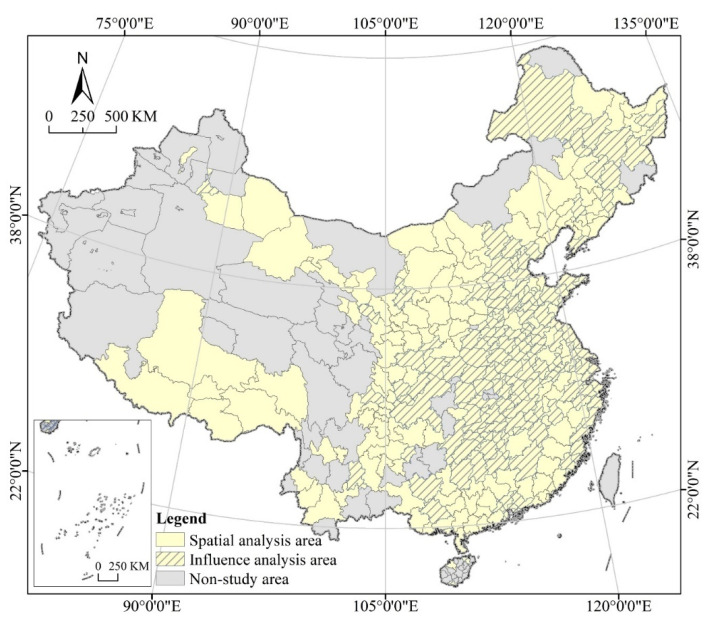
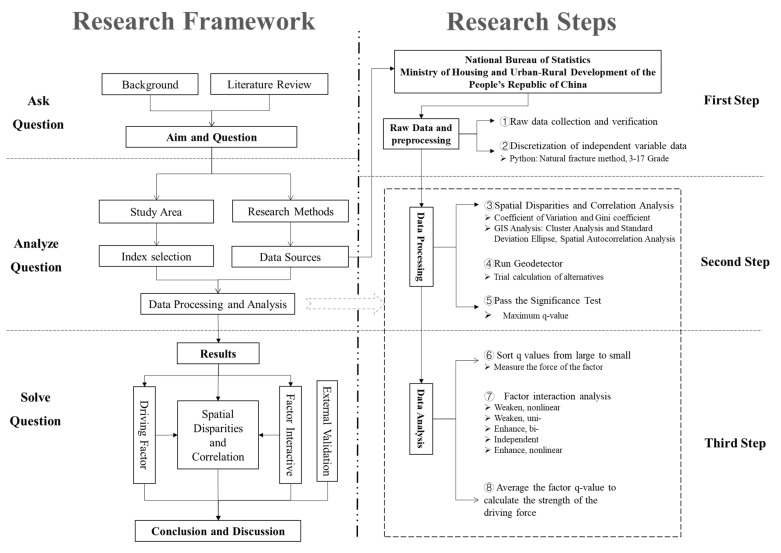
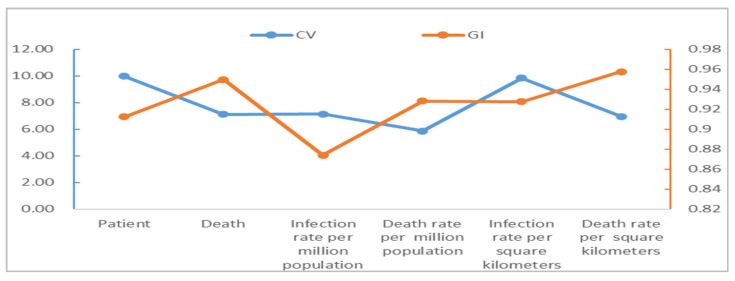
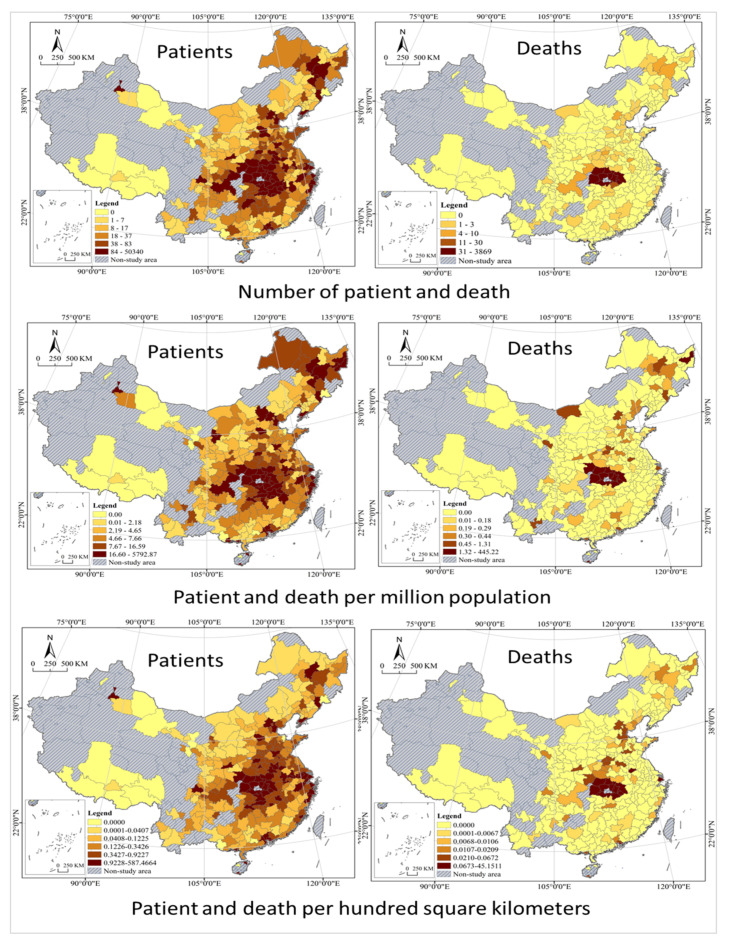
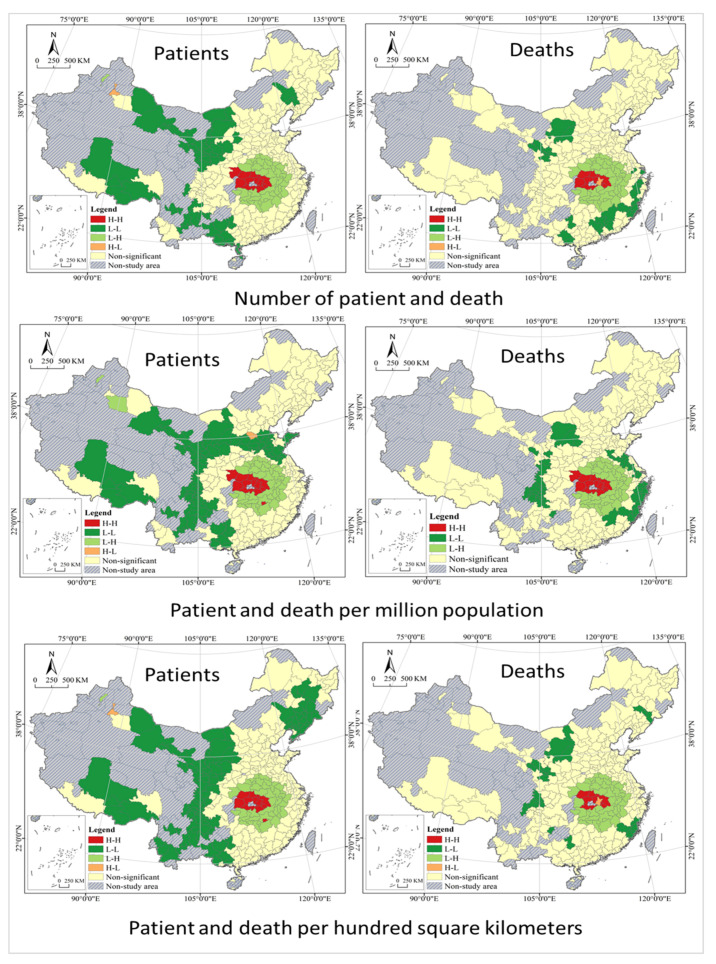
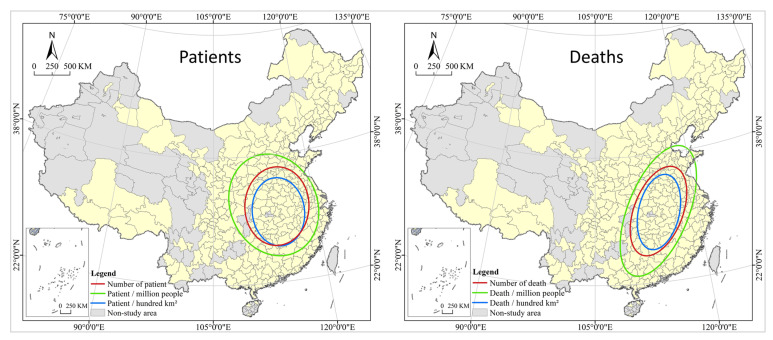
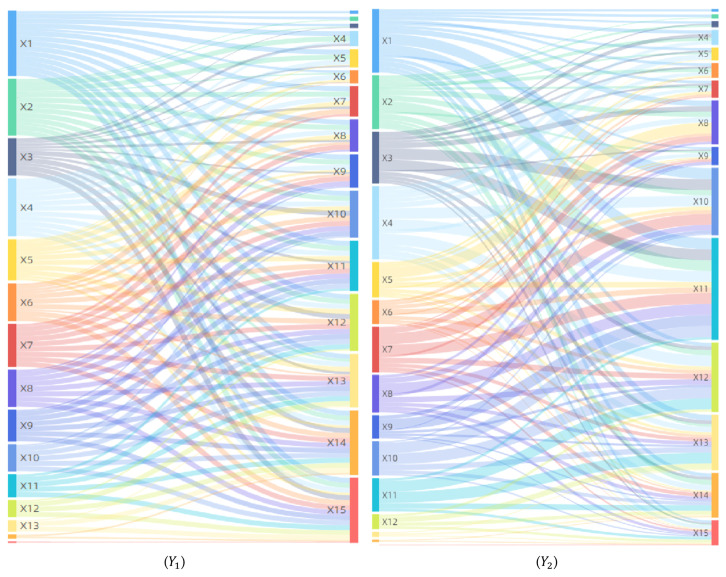
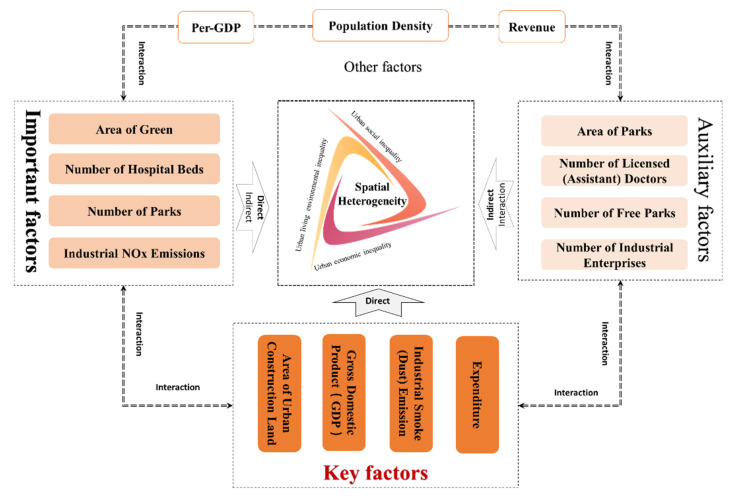
The study of the spatial differentiation of COVID-19 in cities and its driving mechanism is helpful to reveal the spatial distribution pattern, transmission mechanism and diffusion model, and evolution mechanism of the epidemic and can lay the foundation for constructing the spatial dynamics model of the epidemic and provide theoretical basis for the policy design, spatial planning and implementation of epidemic prevention and control and social governance. Geodetector (Origin version, Beijing, China) is a great tool for analysis of spatial differentiation and its influencing factors, and it provides decision support for differentiated policy design and its implementation in executing the city-specific policies. Using factor detection and interaction analysis of Geodetector, 15 indicators of economic, social, ecological, and environmental dimensions were integrated, and 143 cities were selected for the empirical research in China. The research shows that, first of all, risks of both infection and death show positive spatial autocorrelation, but the geographical distribution of local spatial autocorrelation differs significantly between the two. Secondly, the inequalities in urban economic, social, and residential environments interact with COVID-19 spatial heterogeneity, with stronger explanatory power especially when multidimensional inequalities are superimposed. Thirdly, the spatial distribution and spread of COVID-19 are highly spatially heterogeneous and correlated due to the complex influence of multiple factors, with factors such as Area of Urban Construction Land, GDP, Industrial Smoke and Dust Emission, and Expenditure having the strongest influence, the factors such as Area of Green, Number of Hospital Beds and Parks, and Industrial NOx Emissions having unignorable influence, while the factors such as Number of Free Parks and Industrial Enterprises, Per-GDP, and Population Density play an indirect role mainly by means of interaction. Fourthly, the factor interaction effect from the infected person's perspective mainly shows a nonlinear enhancement effect, that is, the joint influence of the two factors is greater than the sum of their direct influences; but from the perspective of the dead, it mainly shows a two-factor enhancement effect, that is, the joint influence of the two factors is greater than the maximum of their direct influences but less than their sum. Fifthly, some suggestions are put forward from the perspectives of building a healthy, resilient, safe, and smart city, providing valuable reference and decision basis for city governments to carry out differentiated policy design.
Keywords: COVID-19; China; infectious diseases; spatial distribution; urban inequalities.
Conflict of interest statement
The authors declare no conflict of interest.
Figures
Similar articles
-
Spatial variations and influencing factors of Cumulative Health Deficit Index of elderly in China.J Health Popul Nutr. 2023 Jul 11;42(1):66. doi: 10.1186/s41043-023-00403-4. J Health Popul Nutr. 2023. PMID: 37430301 Free PMC article.
-
Study on Spatial-Temporal Change of Urban Green Space in Yangtze River Economic Belt and Its Driving Mechanism.Int J Environ Res Public Health. 2021 Nov 27;18(23):12498. doi: 10.3390/ijerph182312498. Int J Environ Res Public Health. 2021. PMID: 34886224 Free PMC article.
-
Geographical Pattern Evolution of Health Resources in China: Spatio-Temporal Dynamics and Spatial Mismatch.Trop Med Infect Dis. 2022 Oct 10;7(10):292. doi: 10.3390/tropicalmed7100292. Trop Med Infect Dis. 2022. PMID: 36288033 Free PMC article.
-
Spatial-temporal evolution of carbon emissions and spatial-temporal heterogeneity of influencing factors in the Bohai Rim Region, China.Environ Sci Pollut Res Int. 2024 Feb;31(9):13897-13924. doi: 10.1007/s11356-024-32057-y. Epub 2024 Jan 24. Environ Sci Pollut Res Int. 2024. PMID: 38265590
-
A Review of Influencing Factors on Spatial Spread of COVID-19 Based on Geographical Perspective.Int J Environ Res Public Health. 2021 Nov 20;18(22):12182. doi: 10.3390/ijerph182212182. Int J Environ Res Public Health. 2021. PMID: 34831938 Free PMC article.
Cited by
-
Epidemic thresholds and human mobility.Sci Rep. 2023 Jul 14;13(1):11409. doi: 10.1038/s41598-023-38395-0. Sci Rep. 2023. PMID: 37452118 Free PMC article.
-
Socioeconomic differences in COVID-19 infection, hospitalisation and mortality in urban areas in a region in the South of Europe.BMC Public Health. 2022 Dec 12;22(1):2316. doi: 10.1186/s12889-022-14774-6. BMC Public Health. 2022. PMID: 36503482 Free PMC article.
-
Regional disparities and influencing factors of high quality medical resources distribution in China.Int J Equity Health. 2023 Jan 10;22(1):8. doi: 10.1186/s12939-023-01825-6. Int J Equity Health. 2023. PMID: 36627636 Free PMC article.
-
Spatiotemporal dynamics and associated drivers of COVID-19 incidence in Nepal.Trop Med Health. 2025 Aug 19;53(1):111. doi: 10.1186/s41182-025-00741-5. Trop Med Health. 2025. PMID: 40830992 Free PMC article.
-
Analysis of the epidemiological characteristics and influencing factors of tuberculosis among students in a large province of China, 2008-2018.Sci Rep. 2024 Sep 3;14(1):20472. doi: 10.1038/s41598-024-71720-9. Sci Rep. 2024. PMID: 39227742 Free PMC article.
References
-
- Thakar V. Unfolding Events in Space and Time: Geospatial Insights into COVID-19 Diffusion in Washington State during the Initial Stage of the Outbreak. ISPRS Int. J. Geo-Inf. 2020;9:382. doi: 10.3390/ijgi9060382. - DOI
Grants and funding
LinkOut - more resources
Full Text Sources
