

Assessing the Validity of Normalizing Aflatoxin B1-Lysine Albumin Adduct Biomarker Measurements to Total Serum Albumin Concentration across Multiple Human Population Studies
- PMID: 35324659
- PMCID: PMC8954427
- DOI: 10.3390/toxins14030162
Assessing the Validity of Normalizing Aflatoxin B1-Lysine Albumin Adduct Biomarker Measurements to Total Serum Albumin Concentration across Multiple Human Population Studies
Abstract
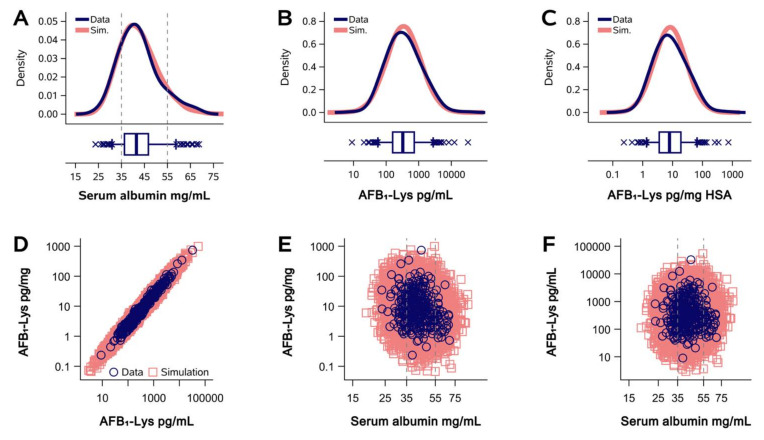
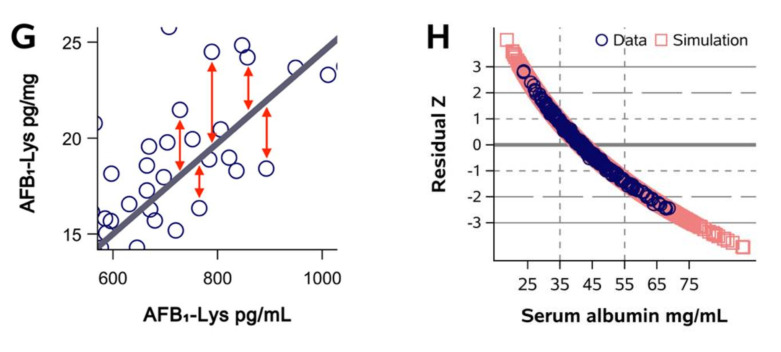
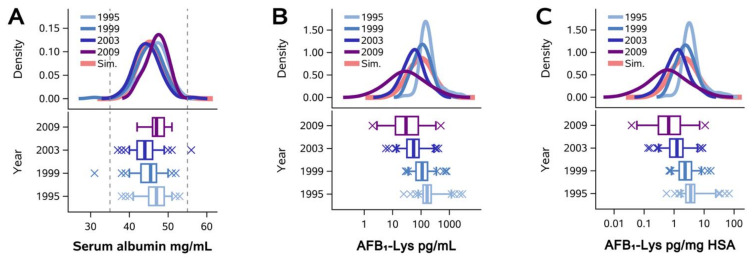
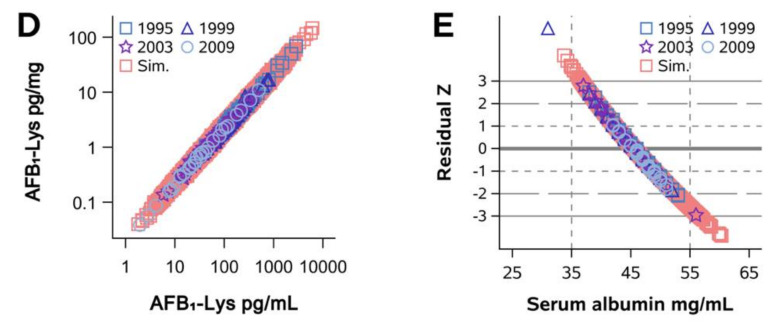
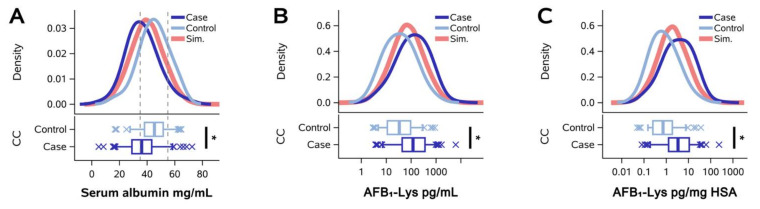
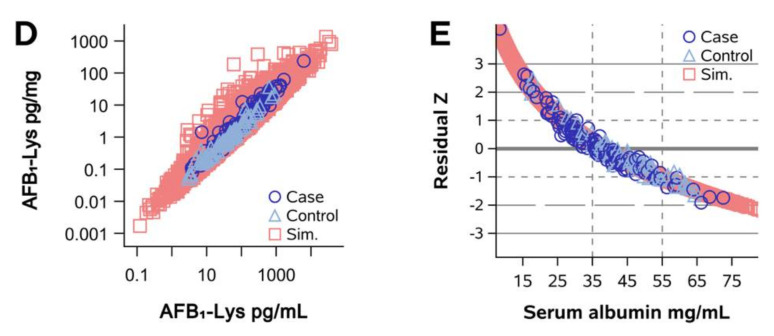
The assessment of aflatoxin B1 (AFB1) exposure using isotope-dilution liquid chromatography-mass spectrometry (LCMS) of AFB1-lysine adducts in human serum albumin (HSA) has proven to be a highly productive strategy for the biomonitoring of AFB1 exposure. To compare samples across different individuals and settings, the conventional practice has involved the normalization of raw AFB1-lysine adduct concentrations (e.g., pg/mL serum or plasma) to the total circulating HSA concentration (e.g., pg/mg HSA). It is hypothesized that this practice corrects for technical error, between-person variance in HSA synthesis or AFB1 metabolism, and other factors. However, the validity of this hypothesis has been largely unexamined by empirical analysis. The objective of this work was to test the concept that HSA normalization of AFB1-lysine adduct concentrations effectively adjusts for biological and technical variance and improves AFB1 internal dose estimates. Using data from AFB1-lysine and HSA measurements in 763 subjects, in combination with regression and Monte Carlo simulation techniques, we found that HSA accounts for essentially none of the between-person variance in HSA-normalized (R2 = 0.04) or raw AFB1-lysine measurements (R2 = 0.0001), and that HSA normalization of AFB1-lysine levels with empirical HSA values does not reduce measurement error any better than does the use of simulated data (n = 20,000). These findings were robust across diverse populations (Guatemala, China, Chile), AFB1 exposures (105 range), HSA assays (dye-binding and immunoassay), and disease states (healthy, gallstones, and gallbladder cancer). HSA normalization results in arithmetic transformation with the addition of technical error from the measurement of HSA. Combined with the added analysis time, cost, and sample consumption, these results suggest that it may be prudent to abandon the practice of normalizing adducts to HSA concentration when measuring any HSA adducts-not only AFB1-lys adducts-when using LCMS in serum/plasma.
Keywords: adduct; aflatoxin; albumin; biomarker; dosimetry; mass spectrometry; normalization.
Conflict of interest statement
The authors declare no conflict of interest.
Figures
Similar articles
-
Quantitative analysis and chronic dosimetry of the aflatoxin B1 plasma albumin adduct Lys-AFB1 in rats by isotope dilution mass spectrometry.Chem Res Toxicol. 2006 Jan;19(1):44-9. doi: 10.1021/tx050251r. Chem Res Toxicol. 2006. PMID: 16411655
-
Detectable levels of serum aflatoxin B1-albumin adducts in the United Kingdom population: implications for aflatoxin-B1 exposure in the United Kingdom.Cancer Epidemiol Biomarkers Prev. 1998 May;7(5):441-7. Cancer Epidemiol Biomarkers Prev. 1998. PMID: 9610795
-
How does airway exposure of aflatoxin B1 affect serum albumin adduct concentrations? Evidence based on epidemiological study and animal experimentation.J Toxicol Sci. 2014 Aug;39(4):645-53. doi: 10.2131/jts.39.645. J Toxicol Sci. 2014. PMID: 25056789
-
An overview on possible links between aflatoxin B1 exposure and gallbladder cancer.Mycotoxin Res. 2021 Aug;37(3):205-214. doi: 10.1007/s12550-021-00431-1. Epub 2021 May 21. Mycotoxin Res. 2021. PMID: 34019215 Review.
-
Protein Adductomics: Methodologies for Untargeted Screening of Adducts to Serum Albumin and Hemoglobin in Human Blood Samples.High Throughput. 2019 Mar 8;8(1):6. doi: 10.3390/ht8010006. High Throughput. 2019. PMID: 30857166 Free PMC article. Review.
Cited by
-
Maize consumption and circulating aflatoxin levels in Mexican middle- and older-aged adults: a cross-sectional analysis.Am J Clin Nutr. 2025 Feb;121(2):454-462. doi: 10.1016/j.ajcnut.2024.12.018. Epub 2024 Dec 20. Am J Clin Nutr. 2025. PMID: 39710096
-
Biomarker-based evaluation of aflatoxin B1 exposure in cattle.Vet World. 2025 May;18(5):1297-1305. doi: 10.14202/vetworld.2025.1297-1305. Epub 2025 May 25. Vet World. 2025. PMID: 40584113 Free PMC article.
-
Aflatoxin exposure in adults in southern and eastern Mexico in 2018: A descriptive study.Int J Hyg Environ Health. 2023 Aug;253:114249. doi: 10.1016/j.ijheh.2023.114249. Epub 2023 Sep 5. Int J Hyg Environ Health. 2023. PMID: 37672956 Free PMC article.
-
Assessing the Impacts of Preanalytical Field Sampling Challenges on the Reliability of Serum Aflatoxin B1-Lysine Measurements by Use of LC-MS/MS.Toxins (Basel). 2022 Sep 1;14(9):612. doi: 10.3390/toxins14090612. Toxins (Basel). 2022. PMID: 36136549 Free PMC article.
-
Higher plasma AFB1 concentration is associated with increased risk of HPV 16 and HPV 18 detection and persistence among Ugandan women.Environ Health. 2025 Jul 7;24(1):45. doi: 10.1186/s12940-025-01197-0. Environ Health. 2025. PMID: 40624712 Free PMC article.
References
-
- Council for Agricultural Science and Technology . Mycotoxins: Risks in Plant, Animal, and Human Systems. Council for Agricultural Science and Technology; Ames, IA, USA: 2003.
-
- Smith J.W., Groopman J.D. Aflatoxins. In: Boffetta P., Hainaut P.L., editors. Encyclopedia of Cancer. 3rd ed. Elsevier; Cambridge, MA, USA: 2018.
Publication types
MeSH terms
Substances
Grants and funding
LinkOut - more resources
Full Text Sources
