

Ex Vivo and In Vitro Studies Revealed Underlying Mechanisms of Immature Intestinal Inflammatory Responses Caused by Aflatoxin M1 Together with Ochratoxin A
- PMID: 35324670
- PMCID: PMC8953104
- DOI: 10.3390/toxins14030173
Ex Vivo and In Vitro Studies Revealed Underlying Mechanisms of Immature Intestinal Inflammatory Responses Caused by Aflatoxin M1 Together with Ochratoxin A
Abstract
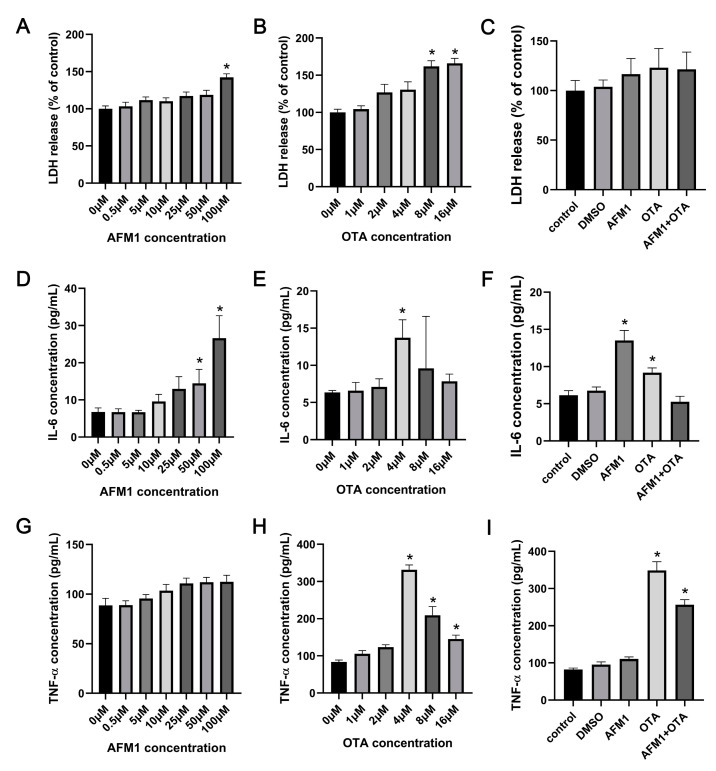
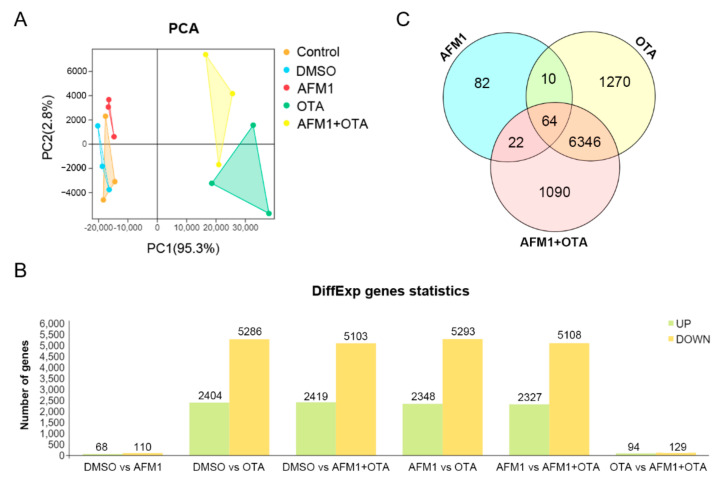
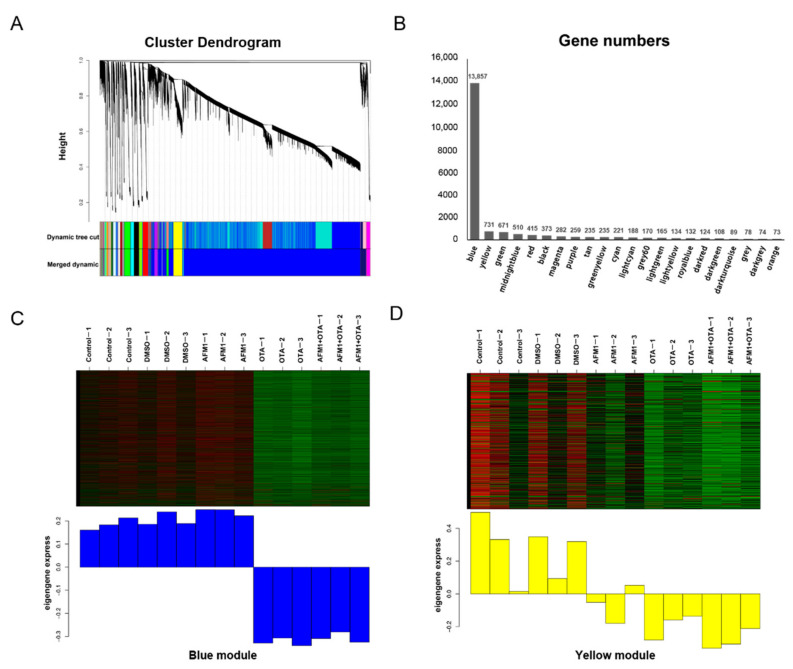
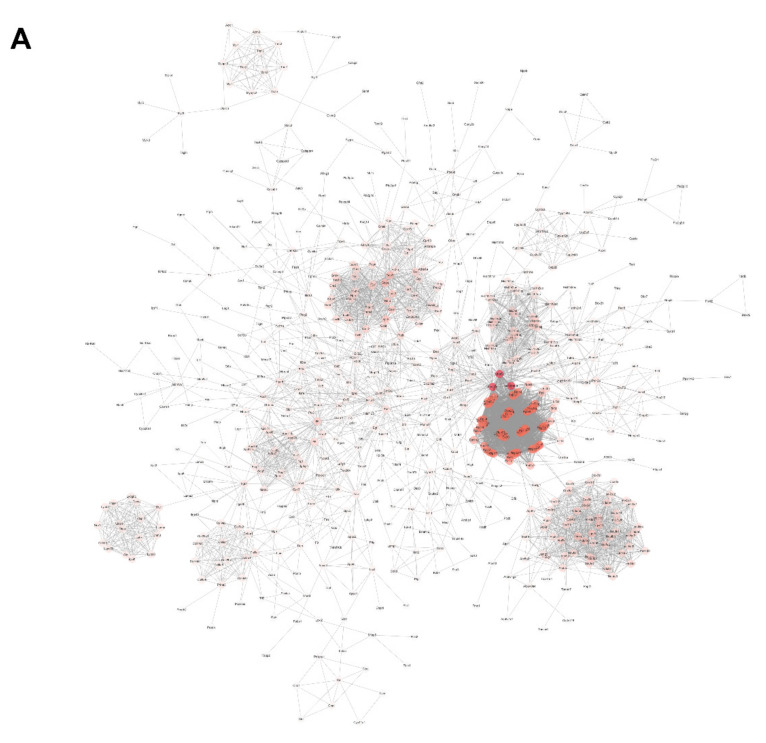
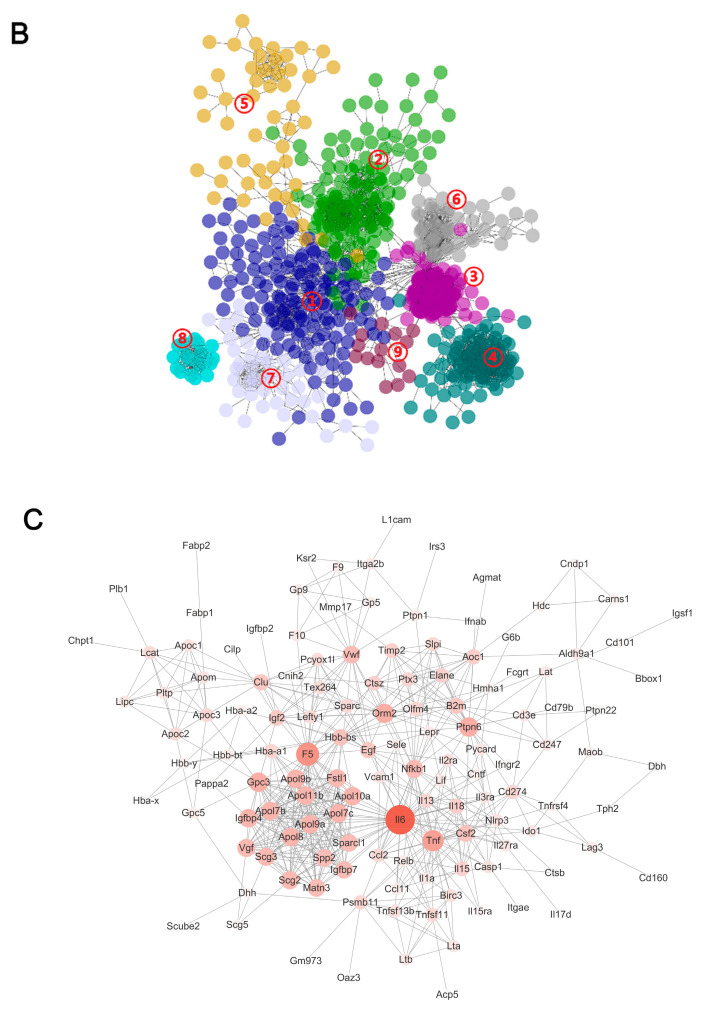
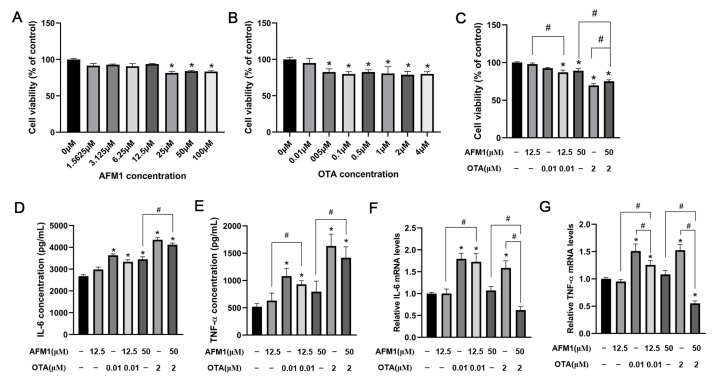
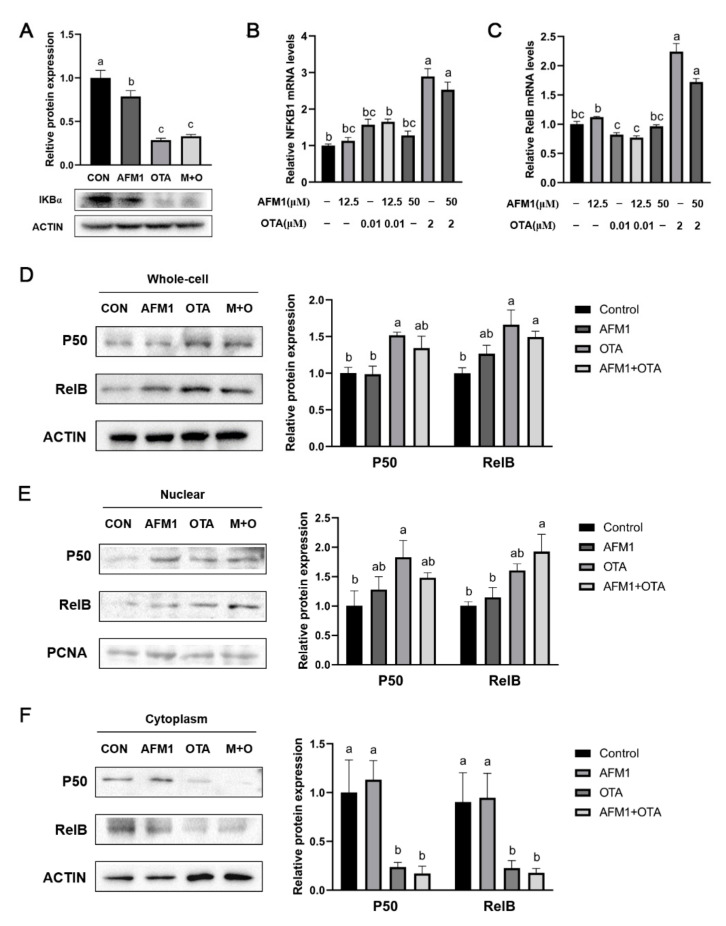
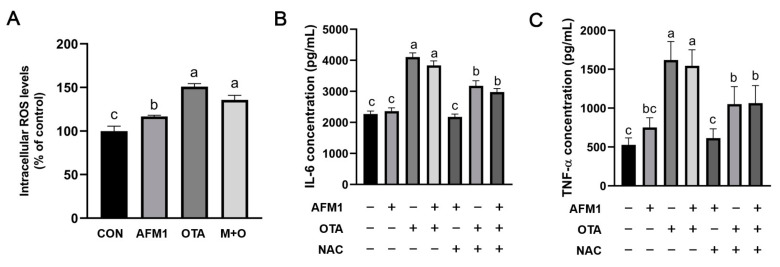
Aflatoxin M1 (AFM1) and ochratoxin A (OTA), which are occasionally detected in milk and commercial baby foods, could easily enter and reach the gastrointestinal tract, posing impairment to the first line of defense and causing dysfunction of the tissue. The objective of this study was to investigate the immunostimulatory roles of individual and combined AFM1 and OTA on the immature intestine. Thus, we used ELISA assays to evaluate the generation of cytokines from ex vivo CD-1 fetal mouse jejunum induced by AFM1 and OTA and explored the related regulatory pathways and pivot genes using RNA-seq analysis. It was found that OTA exhibited much stronger ability in stimulating pro-inflammatory cytokine IL-6 from jejunum tissues than AFM1 (OTA of 4 μM versus AFM1 of 50 μM), whereas the combination of the two toxins seemed to exert antagonistic actions. In addition, transcriptomics also showed that most gene members in the enriched pathway 'cytokine-cytokine receptor interaction' were more highly expressed in OTA than the AFM1 group. By means of PPI network analysis, NFKB1 and RelB were regarded as hub genes in response to OTA but not AFM1. In the human FHs 74 Int cell line, both AFM1 and OTA enhanced the content of reactive oxygen species, and the oxidative response was more apparent in OTA-treated cells in comparison with AFM1. Furthermore, OTA and AFM1 + OTA raised the protein abundance of p50/RelB, and triggered the translocation of the dimer from cytosol to nucleus. Therefore, the experimental data ex vivo and in vitro showed that OTA-induced inflammation was thought to be bound up with the up-regulation and translocation of NF-κB, though AFM1 seemed to have no obvious impact. Since it was the first attempt to uncover the appearances and inner mechanisms regarding inflammation provoked by AFM1 and OTA on immature intestinal models, further efforts are needed to understand the detailed metabolic steps of the toxin in cells and to clarify their causal relationship with the signals proposed from current research.
Keywords: RNA-seq; aflatoxin M1; immature intestine; inflammation; ochratoxin A.
Conflict of interest statement
The authors declare no conflict of interest.
Figures
Similar articles
-
Metabolomics analysis underlay mechanisms in the renal impairment of mice caused by combination of aflatoxin M1 and ochratoxin A.Toxicology. 2021 Jun 30;458:152835. doi: 10.1016/j.tox.2021.152835. Epub 2021 Jun 11. Toxicology. 2021. PMID: 34126166
-
Aflatoxin M1 and ochratoxin A induce a competitive endogenous RNA regulatory network of intestinal immunosuppression by whole-transcriptome analysis.Sci Total Environ. 2023 Jan 1;854:158777. doi: 10.1016/j.scitotenv.2022.158777. Epub 2022 Sep 14. Sci Total Environ. 2023. PMID: 36115400
-
The efficacy of clay bentonite, date pit, and chitosan nanoparticles in the detoxification of aflatoxin M1 and ochratoxin A from milk.Environ Sci Pollut Res Int. 2022 Mar;29(14):20305-20317. doi: 10.1007/s11356-021-17254-3. Epub 2021 Nov 3. Environ Sci Pollut Res Int. 2022. PMID: 34734338
-
The overall and variations of Aflatoxin M1 contamination of milk in Iran: A systematic review and meta-analysis study.Food Chem. 2020 Apr 25;310:125848. doi: 10.1016/j.foodchem.2019.125848. Epub 2019 Nov 6. Food Chem. 2020. PMID: 31846793
-
Aflatoxin M1 in Africa: Exposure Assessment, Regulations, and Prevention Strategies - A Review.Rev Environ Contam Toxicol. 2021;258:73-108. doi: 10.1007/398_2021_73. Rev Environ Contam Toxicol. 2021. PMID: 34611756 Review.
Cited by
-
Synbiotics effects of d-tagatose and Lactobacillus rhamnosus GG on the inflammation and oxidative stress reaction of Gallus gallus based on the genus of cecal bacteria and their metabolites.PLoS One. 2025 Jan 27;20(1):e0317825. doi: 10.1371/journal.pone.0317825. eCollection 2025. PLoS One. 2025. PMID: 39869614 Free PMC article.
-
Luteolin and Chrysin Could Prevent E. coli Lipopolysaccharide-Ochratoxin A Combination-Caused Inflammation and Oxidative Stress in In Vitro Porcine Intestinal Model.Animals (Basel). 2022 Oct 13;12(20):2747. doi: 10.3390/ani12202747. Animals (Basel). 2022. PMID: 36290134 Free PMC article.
References
-
- Juan C., Raiola A., Mañes J., Ritieni A. Presence of mycotoxin in commercial infant formulas and baby foods from Italian market. Food Control. 2014;39:227–236. doi: 10.1016/j.foodcont.2013.10.036. - DOI
Publication types
MeSH terms
Substances
LinkOut - more resources
Full Text Sources
Research Materials
Miscellaneous
