

Nickel's Role in Pancreatic Ductal Adenocarcinoma: Potential Involvement of microRNAs
- PMID: 35324773
- PMCID: PMC8952337
- DOI: 10.3390/toxics10030148
Nickel's Role in Pancreatic Ductal Adenocarcinoma: Potential Involvement of microRNAs
Abstract
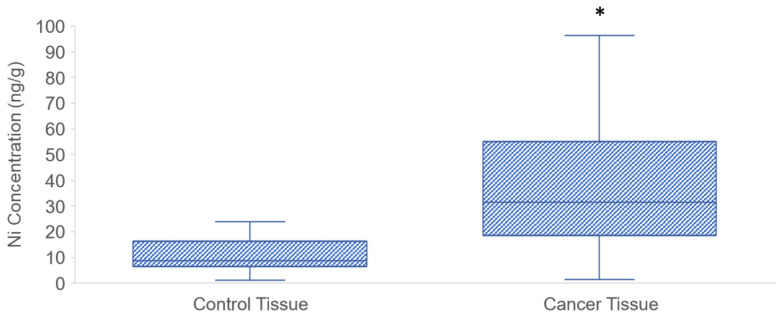
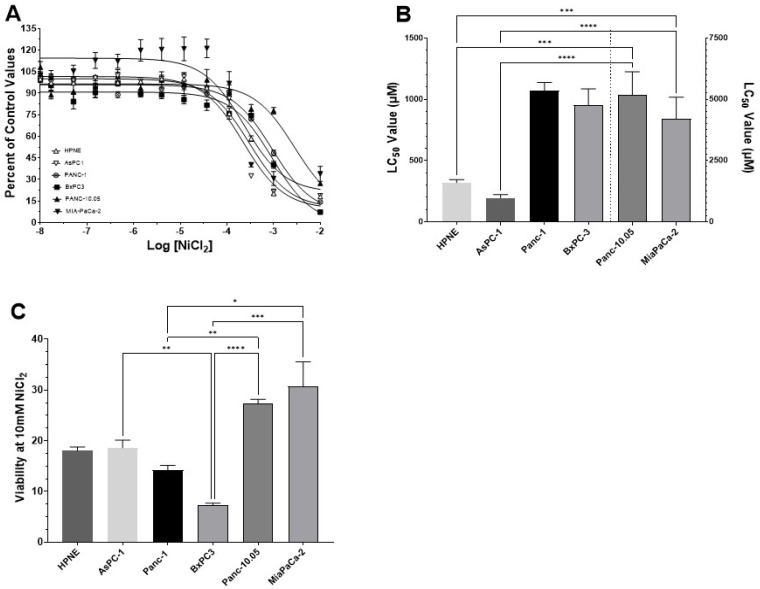
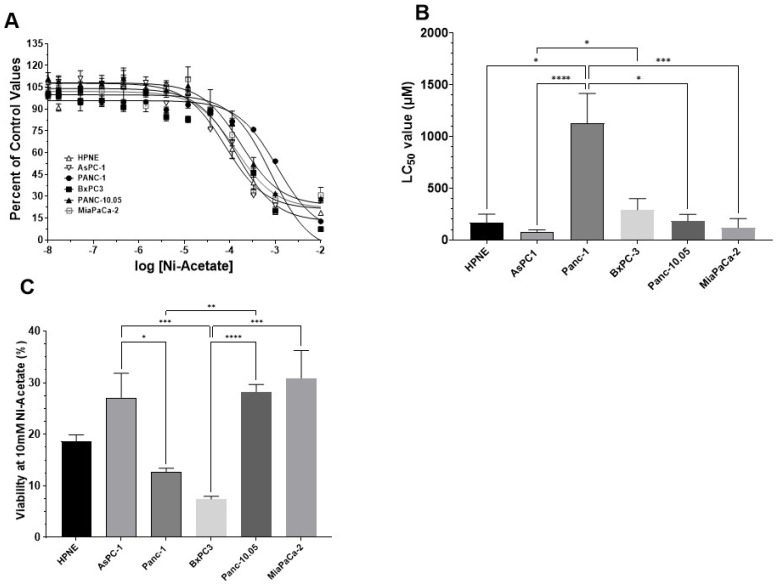
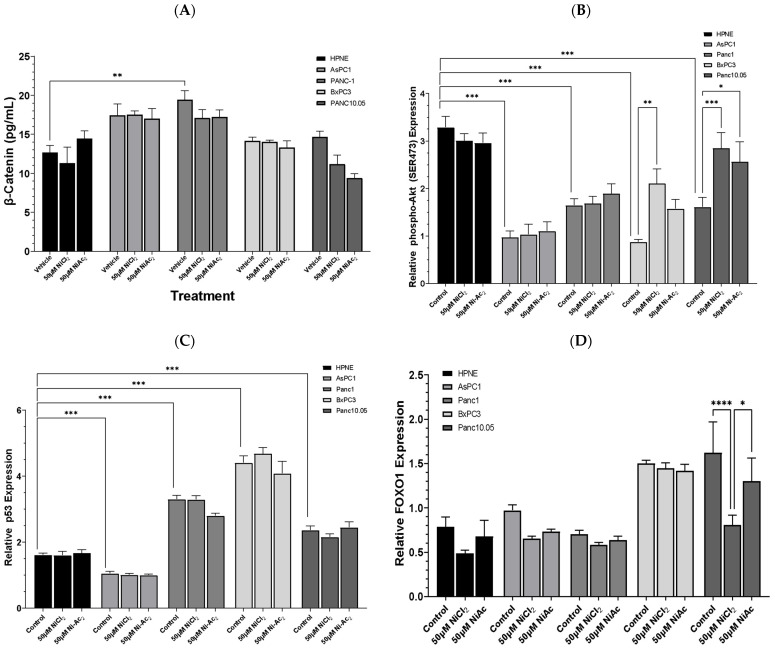
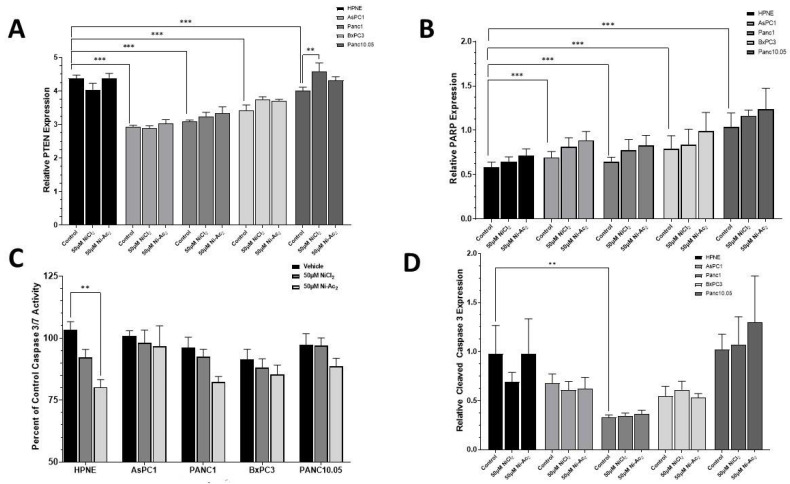
Pancreatic ductal adenocarcinoma (PDAC) is one of the most lethal cancer types with a limited overall survival rate due to the asymptomatic progression of symptoms in metastatic stages of the malignancy and the lack of an early reliable diagnostic biomarker. MicroRNAs (miRs/miRNAs) are small (~18-24 nucleotides), endogenous, non-coding RNAs, which are closely linked to the development of numerous malignancies comprising PDAC. Recent studies have described the role of environmental pollutants such as nickel (Ni) in PDAC, but the mechanisms of Ni-mediated toxicity in cancer are still not completely understood. Specifically, Ni has been found to alter the expression and function of miRs in several malignancies, leading to changes in target gene expression. In this study, we found that levels of Ni were significantly higher in cancerous tissue, thus implicating Ni in pancreatic carcinogenesis. Hence, in vitro studies followed by using both normal and pancreatic tumor cell lines and increasing Ni concentration increased lethality. Comparing LC50 values, Ni-acetate groups demonstrated lower values needed than in NiCl2 groups, suggesting greater Ni-acetate. Panc-10.05 cell line appeared the most sensitive to Ni compounds. Exposure to Ni-acetate resulted in an increased phospho-AKT, and decreased FOXO1 expression in Panc-10.05 cells, while NiCl2 also increased PTEN expression in Panc-10.05 cells. Specifically, following NiCl2 exposure to PDAC cells, the expression levels of miR-221 and miR-155 were significantly upregulated, while the expression levels of miR-126 were significantly decreased. Hence, our study has suggested pilot insights to indicate that the environmental pollutant Ni plays an important role in the progression of PDAC by promoting an association between miRs and Ni exposure during PDAC pathogenesis.
Keywords: apoptosis; environmental toxins; microRNAs; nickel; non-coding RNAs; pancreatic ductal adenocarcinoma.
Conflict of interest statement
The authors declare there are no conflict of interest or competing interests.
Figures


Similar articles
-
Role of microRNAs in response to cadmium chloride in pancreatic ductal adenocarcinoma.Arch Toxicol. 2022 Feb;96(2):467-485. doi: 10.1007/s00204-021-03196-9. Epub 2021 Dec 14. Arch Toxicol. 2022. PMID: 34905088 Free PMC article.
-
Linc00511 acts as a competing endogenous RNA to regulate VEGFA expression through sponging hsa-miR-29b-3p in pancreatic ductal adenocarcinoma.J Cell Mol Med. 2018 Jan;22(1):655-667. doi: 10.1111/jcmm.13351. Epub 2017 Oct 5. J Cell Mol Med. 2018. PMID: 28984028 Free PMC article.
-
microRNA-21 Regulates Stemness in Pancreatic Ductal Adenocarcinoma Cells.Int J Mol Sci. 2022 Jan 24;23(3):1275. doi: 10.3390/ijms23031275. Int J Mol Sci. 2022. PMID: 35163198 Free PMC article.
-
The Role of microRNAs in the Diagnosis and Treatment of Pancreatic Adenocarcinoma.J Clin Med. 2016 Jun 16;5(6):59. doi: 10.3390/jcm5060059. J Clin Med. 2016. PMID: 27322337 Free PMC article. Review.
-
MicroRNA in pancreatic ductal adenocarcinoma and its precursor lesions.World J Gastrointest Oncol. 2016 Jan 15;8(1):18-29. doi: 10.4251/wjgo.v8.i1.18. World J Gastrointest Oncol. 2016. PMID: 26798434 Free PMC article. Review.
Cited by
-
Trace elements in pancreatic cancer.Cancer Med. 2024 Jul;13(14):e7454. doi: 10.1002/cam4.7454. Cancer Med. 2024. PMID: 39015024 Free PMC article. Review.
-
miR-210 Mediated Hypoxic Responses in Pancreatic Ductal Adenocarcinoma.ACS Omega. 2024 Nov 20;9(48):47872-47883. doi: 10.1021/acsomega.4c08947. eCollection 2024 Dec 3. ACS Omega. 2024. PMID: 39651070 Free PMC article.
-
The preventive and carcinogenic effect of metals on cancer: a systematic review.BMC Public Health. 2024 Aug 1;24(1):2079. doi: 10.1186/s12889-024-19585-5. BMC Public Health. 2024. PMID: 39090615 Free PMC article.
-
Navigating Intraductal Papillary Mucinous Neoplasm Management through Fukuoka Consensus vs. European Evidence-Based Guidelines on Pancreatic Cystic Neoplasms-A Study on Two European Centers.Cancers (Basel). 2024 Jun 6;16(11):2156. doi: 10.3390/cancers16112156. Cancers (Basel). 2024. PMID: 38893274 Free PMC article.
-
Environmental Exposure to Metals, Parameters of Oxidative Stress in Blood and Prostate Cancer: Results from Two Cohorts.Antioxidants (Basel). 2022 Oct 18;11(10):2044. doi: 10.3390/antiox11102044. Antioxidants (Basel). 2022. PMID: 36290767 Free PMC article.
References
-
- Orth M., Metzger P., Gerum S., Mayerle J., Schneider G., Belka C., Schnurr M., Lauber K. Pancreatic ductal adenocarcinoma: Biological hallmarks, current status, and future perspectives of combined modality treatment approaches. Radiat. Oncol. 2019;14:141. doi: 10.1186/s13014-019-1345-6. - DOI - PMC - PubMed
-
- Gourgou-Bourgade S., Bascoul-Mollevi C., Desseigne F., Ychou M., Bouche O., Guimbaud R., Becouarn Y., Adenis A., Raoul J.L., Boige V., et al. Impact of FOLFIRINOX compared with gemcitabine on quality of life in patients with metastatic pancreatic cancer: Results from the PRODIGE 4/ACCORD 11 randomized trial. J. Clin. Oncol. 2013;31:23–29. doi: 10.1200/JCO.2012.44.4869. - DOI - PubMed
LinkOut - more resources
Full Text Sources
Research Materials
Miscellaneous
