

Detection of Aortic Valve Opening and Estimation of Pre-Ejection Period in Forcecardiography Recordings
- PMID: 35324778
- PMCID: PMC8945374
- DOI: 10.3390/bioengineering9030089
Detection of Aortic Valve Opening and Estimation of Pre-Ejection Period in Forcecardiography Recordings
Abstract
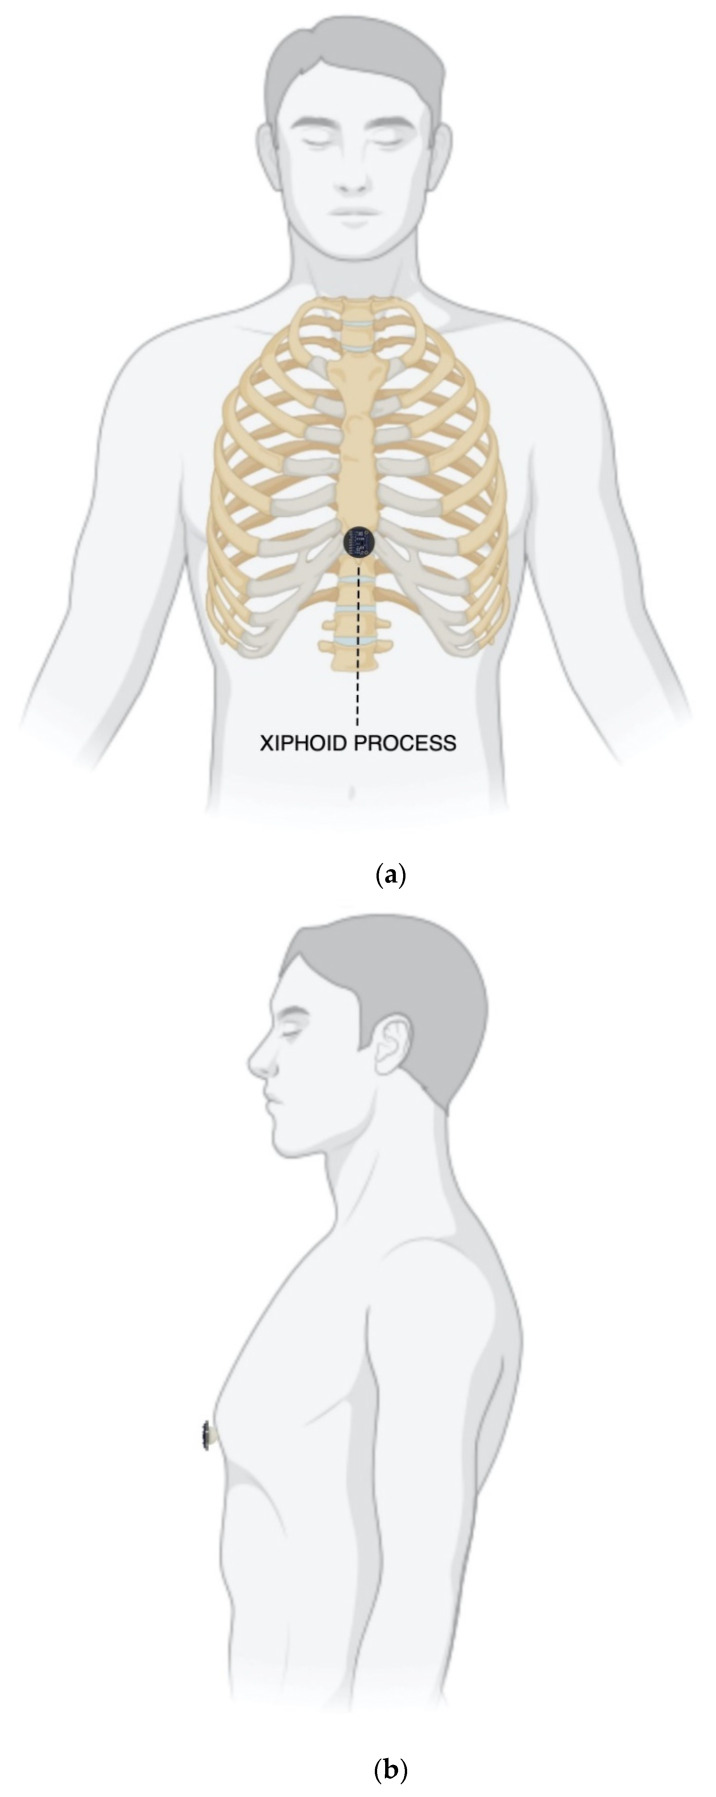
Forcecardiography (FCG) is a novel technique that measures the local forces induced on the chest wall by the mechanical activity of the heart. Specific piezoresistive or piezoelectric force sensors are placed on subjects’ thorax to measure these very small forces. The FCG signal can be divided into three components: low-frequency FCG, high-frequency FCG (HF-FCG) and heart sound FCG. HF-FCG has been shown to share a high similarity with the Seismocardiogram (SCG), which is commonly acquired via small accelerometers and is mainly used to locate specific fiducial markers corresponding to essential events of the cardiac cycle (e.g., heart valves opening and closure, peaks of blood flow). However, HF-FCG has not yet been demonstrated to provide the timings of these markers with reasonable accuracy. This study addresses the detection of the aortic valve opening (AO) marker in FCG signals. To this aim, simultaneous recordings from FCG and SCG sensors were acquired, together with Electrocardiogram (ECG) recordings, from a few healthy subjects at rest, both during quiet breathing and apnea. The AO markers were located in both SCG and FCG signals to obtain pre-ejection periods (PEP) estimates, which were compared via statistical analyses. The PEPs estimated from FCG and SCG showed a strong linear relationship (r > 0.95) with a practically unit slope, and 95% of their differences were found to be distributed within ± 4.6 ms around small biases of approximately 1 ms, corresponding to percentage differences lower than 5% of the mean measured PEP. These preliminary results suggest that FCG can provide accurate AO timings and PEP estimates.
Keywords: cardiac function; cardiac monitoring; forcecardiography; mechanocardiography; pre-ejection period; seismocardiography; systolic time intervals.
Conflict of interest statement
The sensor described in this manuscript is protected by the (pending) patent PCT/AU2020/051107. E.A., D.E., G.D.G. and P.B. are listed as inventors. G.D.G. was a minority shareholder of Medical Monitoring Solutions PTY, which owns the mentioned IP.
Figures


Similar articles
-
A Comparison of Heart Pulsations Provided by Forcecardiography and Double Integration of Seismocardiogram.Bioengineering (Basel). 2022 Apr 9;9(4):167. doi: 10.3390/bioengineering9040167. Bioengineering (Basel). 2022. PMID: 35447727 Free PMC article.
-
A Novel Broadband Forcecardiography Sensor for Simultaneous Monitoring of Respiration, Infrasonic Cardiac Vibrations and Heart Sounds.Front Physiol. 2021 Nov 18;12:725716. doi: 10.3389/fphys.2021.725716. eCollection 2021. Front Physiol. 2021. PMID: 34867438 Free PMC article.
-
Respiratory-Induced Amplitude Modulation of Forcecardiography Signals.Bioengineering (Basel). 2022 Sep 7;9(9):444. doi: 10.3390/bioengineering9090444. Bioengineering (Basel). 2022. PMID: 36134993 Free PMC article.
-
A Flexible PVDF Sensor for Forcecardiography.Sensors (Basel). 2025 Mar 6;25(5):1608. doi: 10.3390/s25051608. Sensors (Basel). 2025. PMID: 40096462 Free PMC article.
-
Systematic review of the clinical utility and validity of the Sendai and Fukuoka Consensus Guidelines for the management of intraductal papillary mucinous neoplasms of the pancreas.HPB (Oxford). 2018 Jun;20(6):497-504. doi: 10.1016/j.hpb.2018.01.009. Epub 2018 Feb 24. HPB (Oxford). 2018. PMID: 29486917
Cited by
-
Design and Fabrication of an Integrated Hollow Concave Cilium MEMS Cardiac Sound Sensor.Micromachines (Basel). 2022 Dec 8;13(12):2174. doi: 10.3390/mi13122174. Micromachines (Basel). 2022. PMID: 36557472 Free PMC article.
-
ECG-Free Heartbeat Detection in Seismocardiography Signals via Template Matching.Sensors (Basel). 2023 May 12;23(10):4684. doi: 10.3390/s23104684. Sensors (Basel). 2023. PMID: 37430606 Free PMC article.
-
Investigating Cardiorespiratory Interaction Using Ballistocardiography and Seismocardiography-A Narrative Review.Sensors (Basel). 2022 Dec 6;22(23):9565. doi: 10.3390/s22239565. Sensors (Basel). 2022. PMID: 36502267 Free PMC article. Review.
-
Fully automated template matching method for ECG-free heartbeat detection in cardiomechanical signals of healthy and pathological subjects.Phys Eng Sci Med. 2025 Jun;48(2):649-664. doi: 10.1007/s13246-025-01531-3. Epub 2025 Mar 13. Phys Eng Sci Med. 2025. PMID: 40080259 Free PMC article.
-
A Comparison of Heart Pulsations Provided by Forcecardiography and Double Integration of Seismocardiogram.Bioengineering (Basel). 2022 Apr 9;9(4):167. doi: 10.3390/bioengineering9040167. Bioengineering (Basel). 2022. PMID: 35447727 Free PMC article.
References
-
- Zanetti J., Salerno D. Seismocardiography: A new technique for recording cardiac vibrations. Concept, method, and initial observations. J. Cardiovasc. Technol. 1990;9:111–118.
-
- Inan O.T., Migeotte P.F., Park K.S., Etemadi M., Tavakolian K., Casanella R., Zanetti J., Tank J., Funtova I., Prisk G.K., et al. Ballistocardiography and Seismocardiography: A Review of Recent Advances. IEEE J. Biomed. Health Inform. 2015;19:1414–1427. doi: 10.1109/JBHI.2014.2361732. - DOI - PubMed
LinkOut - more resources
Full Text Sources
Research Materials
Miscellaneous
