Spatial Variation in Risk for Highly Pathogenic Avian Influenza Subtype H5N6 Viral Infections in South Korea: Poultry Population-Based Case-Control Study
- PMID: 35324863
- PMCID: PMC8952335
- DOI: 10.3390/vetsci9030135
Spatial Variation in Risk for Highly Pathogenic Avian Influenza Subtype H5N6 Viral Infections in South Korea: Poultry Population-Based Case-Control Study
Abstract
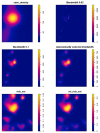
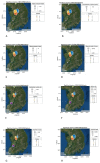
Given the substantial economic damage caused by the continual circulation of highly pathogenic avian influenza (HPAI) outbreaks since 2003, identifying high-risk locations associated with HPAI infections is essential. In this study, using affected and unaffected poultry farms' locations during an HPAI H5N6 epidemic in South Korea, we identified places where clusters of HPAI cases were found. Hotspots were defined as regions having clusters of HPAI cases. With the help of the statistical computer program R, a kernel density estimate and a spatial scan statistic were employed for this purpose. A kernel density estimate and detection of significant clusters through a spatial scan statistic both showed that districts in the Chungcheongbuk-do, Jeollabuk-do, and Jeollanam-do provinces are more vulnerable to HPAI outbreaks. Prior to the migration season, high-risk districts should implement particular biosecurity measures. High biosecurity measures, as well as improving the cleanliness of the poultry environment, would undoubtedly aid in the prevention of HPAIV transmission to poultry farms in these high-risk regions of South Korea.
Keywords: clusters; highly pathogenic avian influenza; hotspots; kernel density estimate; spatial scan statistic.
Conflict of interest statement
The authors do not have any conflicts of interest to declare.
Figures


Similar articles
-
Preventive effect of on-farm biosecurity practices against highly pathogenic avian influenza (HPAI) H5N6 infection on commercial layer farms in the Republic of Korea during the 2016-17 epidemic: A case-control study.Prev Vet Med. 2022 Feb;199:105556. doi: 10.1016/j.prevetmed.2021.105556. Epub 2021 Dec 3. Prev Vet Med. 2022. PMID: 34896940
-
Spatial epidemiology of highly pathogenic avian influenza subtype H5N6 in Gyeonggi Province, South Korea, 2016-2017.Transbound Emerg Dis. 2022 Sep;69(5):e2431-e2442. doi: 10.1111/tbed.14587. Epub 2022 May 24. Transbound Emerg Dis. 2022. PMID: 35526114
-
Risk Prediction of Three Different Subtypes of Highly Pathogenic Avian Influenza Outbreaks in Poultry Farms: Based on Spatial Characteristics of Infected Premises in South Korea.Front Vet Sci. 2022 May 31;9:897763. doi: 10.3389/fvets.2022.897763. eCollection 2022. Front Vet Sci. 2022. PMID: 35711796 Free PMC article.
-
The genetics of highly pathogenic avian influenza viruses of subtype H5 in Germany, 2006-2020.Transbound Emerg Dis. 2021 May;68(3):1136-1150. doi: 10.1111/tbed.13843. Epub 2020 Sep 29. Transbound Emerg Dis. 2021. PMID: 32964686 Review.
-
Evolution, global spread, and pathogenicity of highly pathogenic avian influenza H5Nx clade 2.3.4.4.J Vet Sci. 2017 Aug 31;18(S1):269-280. doi: 10.4142/jvs.2017.18.S1.269. J Vet Sci. 2017. PMID: 28859267 Free PMC article. Review.
Cited by
-
Evaluation of risk-based antigen and antibody surveillance strategies and their association with HPAI outbreaks in South Korean duck farms.Front Vet Sci. 2025 Jul 3;12:1582269. doi: 10.3389/fvets.2025.1582269. eCollection 2025. Front Vet Sci. 2025. PMID: 40678492 Free PMC article.
-
Transmission Dynamics of Highly Pathogenic Avian Influenza A(H5N1) and A(H5N6) Viruses in Wild Birds, South Korea, 2023-2024.Emerg Infect Dis. 2025 Aug;31(8):1561-1572. doi: 10.3201/eid3108.250373. Epub 2025 Jul 9. Emerg Infect Dis. 2025. PMID: 40633556 Free PMC article.
References
-
- Kwon J.-H., Lee D.H., Swayne D.E., Noh J.Y., Yuk S.S., Erdene-Ochir T.O., Hong W.T., Jeong J.H., Jeong S., Gwon G.B., et al. Highly pathogenic avian influenza A (H5N8) viruses reintroduced into South Korea by migratory waterfowl, 2014–2015. Emerg. Infect. Dis. 2016;22:507. doi: 10.3201/eid2203.151006. - DOI - PMC - PubMed
LinkOut - more resources
Full Text Sources

