

Lessons Learned from Programmatic Gains in HIV Service Delivery During the COVID-19 Pandemic - 41 PEPFAR-Supported Countries, 2020
- PMID: 35324881
- PMCID: PMC8956337
- DOI: 10.15585/mmwr.mm7112a2
Lessons Learned from Programmatic Gains in HIV Service Delivery During the COVID-19 Pandemic - 41 PEPFAR-Supported Countries, 2020
Abstract
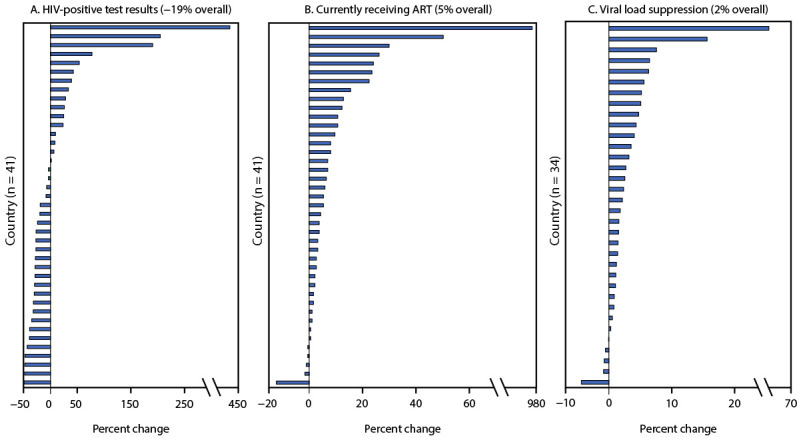
The U.S. President's Emergency Plan for AIDS Relief (PEPFAR) supports country programs in identifying persons living with HIV infection (PLHIV), providing life-saving treatment, and reducing the spread of HIV in countries around the world (1,2). CDC used Monitoring, Evaluation, and Reporting (MER) data* to assess the extent to which COVID-19 mitigation strategies affected HIV service delivery across the HIV care continuum† globally during the first year of the COVID-19 pandemic. Indicators included the number of reported HIV-positive test results, the number of PLHIV who were receiving antiretroviral therapy (ART), and the rates of HIV viral load suppression. Percent change in performance was assessed between countries during the first 3 months of 2020, before COVID-19 mitigation efforts began (January-March 2020), and the last 3 months of the calendar year (October-December 2020). Data were reviewed for all 41 countries to assess total and country-level percent change for each indicator. Then, qualitative data were reviewed among countries in the upper quartile to assess specific strategies that contributed to programmatic gains. Overall, positive percent change was observed in PEPFAR-supported countries in HIV treatment (5%) and viral load suppression (2%) during 2020. Countries reporting the highest gains across the HIV care continuum during 2020 attributed successes to reducing or streamlining facility attendance through strategies such as enhancing index testing (offering of testing to the biologic children and partners of PLHIV)§ and community- and home-based testing; treatment delivery approaches; and improvements in data use through monitoring activities, systems, and data quality checks. Countries that reported program improvements during the first year of the COVID-19 pandemic offer important information about how lifesaving HIV treatment might be provided during a global public health crisis.
Conflict of interest statement
All authors have completed and submitted the International Committee of Medical Journal Editors form for disclosure of potential conflicts of interest. No potential conflicts of interest were disclosed.
Figures
References
-
- Joint United Nations Programme on HIV. AIDS info database. Geneva, Switzerland: Joint United Nations Programme on HIV; 2020. https://aidsinfo.unaids.org/
-
- The United States President’s Emergency Plan for AIDS Relief. Annual Report to Congress, 2021. Washington, DC: The United States President’s Emergency Plan for AIDS Relief; 2021. https://www.state.gov/wp-content/uploads/2021/02/PEPFAR2021AnnualReportt...
MeSH terms
Substances
LinkOut - more resources
Full Text Sources
Medical
Miscellaneous
