. 2022 Mar 24;20(3):e3001593.
doi: 10.1371/journal.pbio.3001593. eCollection 2022 Mar.

Cortical softening elicits zygotic contractility during mouse preimplantation development

Affiliations

Cortical softening elicits zygotic contractility during mouse preimplantation development

Özge Özgüç et al. PLoS Biol. .

Abstract

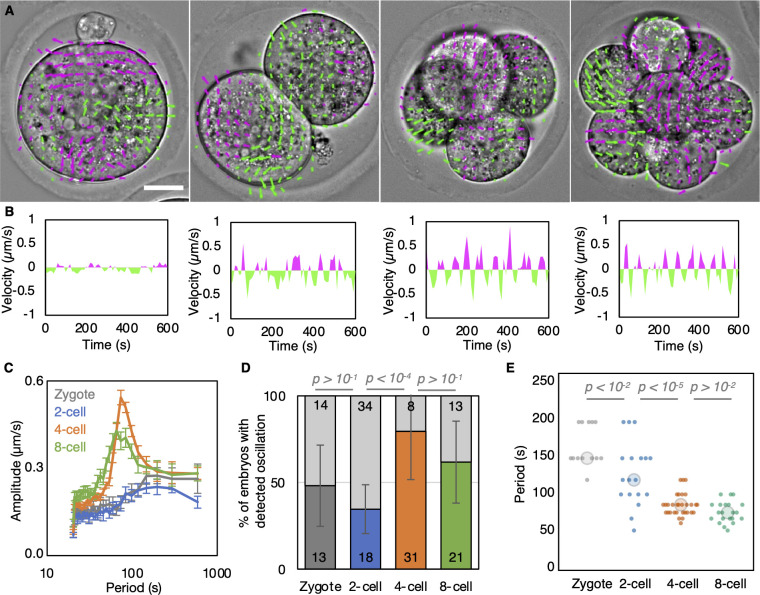
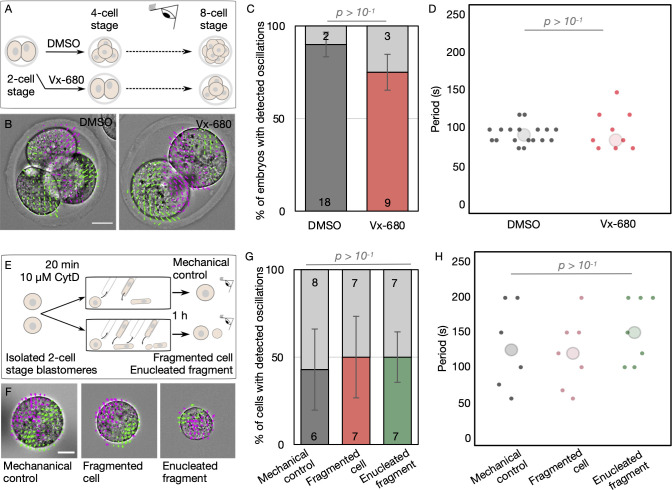
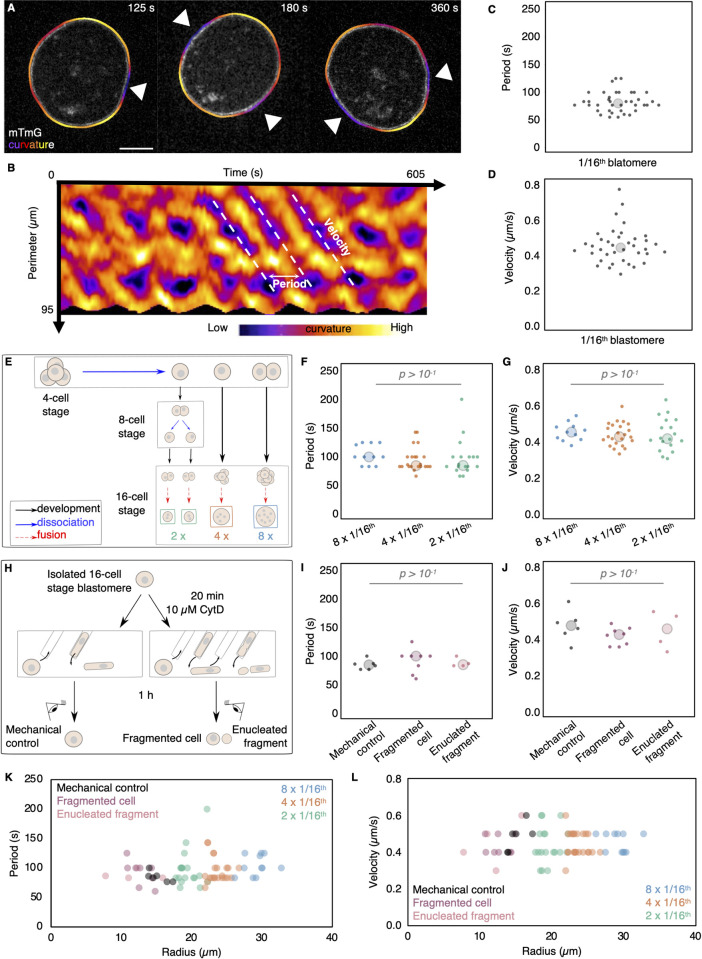
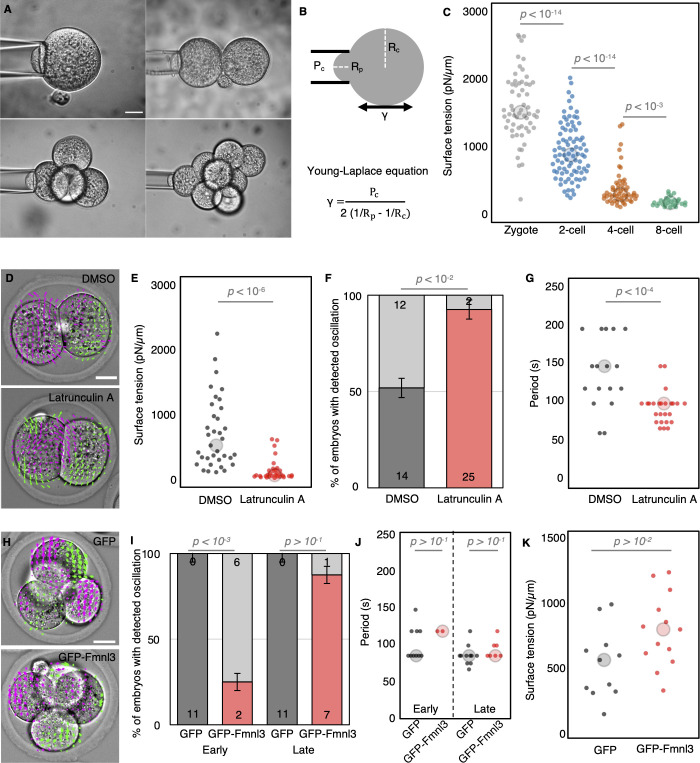
Actomyosin contractility is a major engine of preimplantation morphogenesis, which starts at the 8-cell stage during mouse embryonic development. Contractility becomes first visible with the appearance of periodic cortical waves of contraction (PeCoWaCo), which travel around blastomeres in an oscillatory fashion. How contractility of the mouse embryo becomes active remains unknown. We have taken advantage of PeCoWaCo to study the awakening of contractility during preimplantation development. We find that PeCoWaCo become detectable in most embryos only after the second cleavage and gradually increase their oscillation frequency with each successive cleavage. To test the influence of cell size reduction during cleavage divisions, we use cell fusion and fragmentation to manipulate cell size across a 20- to 60-μm range. We find that the stepwise reduction in cell size caused by cleavage divisions does not explain the presence of PeCoWaCo or their accelerating rhythm. Instead, we discover that blastomeres gradually decrease their surface tensions until the 8-cell stage and that artificially softening cells enhances PeCoWaCo prematurely. We further identify the programmed down-regulation of the formin Fmnl3 as a required event to soften the cortex and expose PeCoWaCo. Therefore, during cleavage stages, cortical softening, mediated by Fmnl3 down-regulation, awakens zygotic contractility before preimplantation morphogenesis.


Conflict of interest statement

The authors have declared that no competing interests exist.

Figures

Fig 1
Fig 1. Analysis of PeCoWaCo during cleavage stages.
(A) Representative images of a short-term time-lapse overlaid with a subset of velocity vectors from PIV analysis during cleavage stages (S1 Movie). Magenta for positive and green for negative Y directed movement. Scale bar, 20 μm. (B) Velocity over time for a representative velocity vector of each embryo shown in A. (C) Mean power spectrum resulting from Fourier transform of PIV analysis of zygote (gray, n = 13), 2-cell (blue, n = 18), 4-cell (orange, n = 31), and 8-cell (green, n = 21) stages embryos showing detectable oscillations. Data show as mean ± SEM (S1 Table). (D) Proportion of zygote (gray, n = 27), 2-cell (blue, n = 52), 4-cell (orange, n = 39), and 8-cell stage (green, n = 34) embryos showing detectable oscillations after Fourier transform of PIV analysis. Light gray shows nonoscillating embryos. Error bars show SEM. Chi-squared p-values comparing different stages are indicated (S1 Table, S1 Data). (E) Oscillation period of zygote (gray, n = 13), 2-cell (blue, n = 18), 4-cell (orange, n = 31), and 8-cell (green, n = 21) stages embryos. Larger circles show median values. Student t test p-values are indicated (S1 Table, S1 Data). PeCoWaCo, periodic cortical waves of contraction; PIV, Particle Image Velocimetry.
Fig 2
Fig 2. Initiation of PeCoWaCo is independent of cell size.
(A) Schematic diagram of PeCoWaCo analysis after blocking the second cleavage division with 2.5 μM Vx680. (B) Representative images of DMSO and Vx-680 treated embryos overlaid with a subset of velocity vectors from PIV analysis (S3 Movie). Scale bar, 20 μm. (C, D) Proportion (C) of embryos showing detectable oscillations and their detected period (D, DMSO n = 20 and Vx-680 n = 12). Chi-squared (C) and Student t test (D) p-values comparing 2 conditions are indicated (S3 Table, S1 Data). Error bars show SEM. Light gray shows nonoscillating embryos. Larger circles show median values. (E) Schematic diagram of PeCoWaCo analysis after fragmentation of 2-cell stage blastomeres. (F) Representative images of mechanical control, fragmented cell, and enucleated fragments overlaid with a subset of velocity vectors from PIV analysis (S4 Movie). Scale bar, 20 μm. (G, H) Proportion (G) of cells showing detectable oscillations and their detected period (H) in mechanical controls (n = 14), fragmented cells (n = 14), and enucleated fragments (n = 14). Error bars show SEM. Chi-squared (G) and Student t test (H) p-values comparing 2 conditions are indicated (S3 Table, S1 Data). Light gray shows nonoscillating cells. PeCoWaCo, periodic cortical waves of contraction; PIV, Particle Image Velocimetry.
Fig 3
Fig 3. Period and velocity of PeCoWaCo are stable across a broad range of cell sizes.
(A, B) Surface deformation tracking for period detection and velocity measurements. Isolated 16-cell stage blastomere originating from mTmG embryos with the local curvature fitted around it (A). Arrowheads indicate the PeCoWaCo. White scale bar, 10 μm. (B) Kymograph of curvature changes observed in the cell shown in (A). The period between consecutive waves and their velocity are indicated. Colored scale bar indicates curvature. (C, D) Period (C) and velocity (D) of PeCoWaCo in 38 isolated 16-cell stage blastomeres. Large circles show median. (E) Schematic diagram of fusion of 16-cell stage blastomeres. (F, G) Oscillation period (F) and wave velocity (G) of fused blastomeres. 8 × 1/16th (blue, n = 11), 4 × 1/16th (orange, n = 22), and 2 × 1/16th (green, n = 18) fused blastomeres are shown. Large circles show median (S5 Movie, S5 Table, S1 Data). (H) Schematic diagram of fragmentation of 16-cell stage blastomeres. (I, J) Oscillation period (I) and wave velocity (J) of fragmented blastomeres. Control (black, n = 6), fragmented cell (magenta, n = 8), and enucleated fragment (pink, n = 4) are shown (S6 Movie, S5 Table, S1 Data). (K, L) Oscillation period (K) and wave velocity (L) for size-manipulated 16-cell stage blastomeres. Larger circles show median values. Student t test p-values are indicated (S5 Table, S1 Data). CytD, Cytochalasin D; PeCoWaCo, periodic cortical waves of contraction.
Fig 4
Fig 4. Cortical softening elicits PeCoWaCo.
(A) Representative images of tension measurements at the zygote, 2-, 4-, and 8-cell stages. Scale bar, 20 μm. (B) Schematic diagram of the surface tension measurements. Using the Young–Laplace equation, the surface tension γ can be calculated from the critical pressure Pc applied by a micropipette of radius Rp onto a cell of radius of curvature Rc. (C) Surface tension of blastomeres throughout cleavage stages. Zygote (gray, n = 60), 2-cell (blue, n = 86), 4-cell (orange, n = 55), and early 8-cell (green, n = 28) stages are shown. Student t test p-values are indicated (S7 Table, S1 Data). (D) Representative images of Control and 100 nM Latrunculin A treated embryos overlaid with a subset of velocity vectors from PIV analysis (S8 Movie). Scale bar, 20 μm. (E) Surface tension of embryos treated with DMSO (n = 35) or 100 nM Latrunculin A (n = 32). Student t test p-value is indicated (S7 Table, S1 Data). Larger circles show median values. (F, G) Proportion (F) of embryos showing detectable oscillations and their detected period (G) of DMSO treated (n = 27) and 100 nM Latrunculin A treated (n = 27) 2-cell stage embryos. Error bars show SEM. Chi-squared (F) and Student t test (G) p-values comparing 2 conditions are indicated (S7 Table, S1 Data). Light gray shows nonoscillating embryos. Larger circles show median values. (H) Representative images of embryos expressing GFP or GFP-Fmnl3 overlaid with a subset of velocity vectors from PIV analysis (S10 Movie). Scale bar, 20 μm. (I, J) Proportion (B) of embryos showing detectable oscillations and their detected period (C) in embryos expressing GFP (n = 11) or GFP-Fmnl3 (n = 8) at the early and late 4-cell stage. Error bars show SEM. Chi-squared (B) and Student t test (C) p-values comparing 2 conditions are indicated (S7 Table, S1 Data). Light gray shows nonoscillating embryos. (K) Surface tension of embryos expressing GFP (n = 11) or GFP-Fmnl3 (n = 13) measured during the early phase of the 4-cell stage. Student t test p-value is indicated (S7 Table, S1 Data). Larger circles show median values. PeCoWaCo, periodic cortical waves of contraction; PIV, Particle Image Velocimetry.

Similar articles

Cited by

References

    1. Coravos JS, Mason FM, Martin AC. Actomyosin Pulsing in TissueIntegrity Maintenance duringMorphogenesis. Trends Cell Biol. 2017;27:276–83. doi: 10.1016/j.tcb.2016.11.008 - DOI - PMC - PubMed
    1. Murrell M, Lenz M, Gardel ML. Forcing cells into shape: the mechanics of actomyosin contractility. Nat Rev Mol Cell Biol. 2015;16:486–498. doi: 10.1038/nrm4012 - DOI - PMC - PubMed
    1. Özgüç Ö, Maître J-L. Multiscale morphogenesis of the mouse blastocyst by actomyosin contractility. Curr Opin Cell Biol. 2020;66:123–129. doi: 10.1016/j.ceb.2020.05.002 - DOI - PubMed
    1. Kelkar M, Bohec P, Charras G. Mechanics of the cellular actin cortex: From signalling to shape change. Curr Opin Cell Biol. 2020;66:69–78. doi: 10.1016/j.ceb.2020.05.008 - DOI - PubMed
    1. Clark AG, Wartlick O, Salbreux G, Paluch EK. Stresses at the cell surface during animal cell morphogenesis. Curr Biol. 2014;24:R484–94. doi: 10.1016/j.cub.2014.03.059 - DOI - PubMed

Publication types