. 2022 Mar 24;17(3):e0264829.
doi: 10.1371/journal.pone.0264829. eCollection 2022.

The association of COVID-19 employment shocks with suicide and safety net use: An early-stage investigation

Affiliations

The association of COVID-19 employment shocks with suicide and safety net use: An early-stage investigation

Michihito Ando et al. PLoS One. .

Abstract

This paper examines whether the COVID-19-induced employment shocks are associated with increases in suicides and safety net use in the second and third quarters of 2020. We exploit plausibly exogenous regional variation in the magnitude of the employment shocks in Japan and adopt a difference-in-differences research design to examine and control for possible confounders. Our preferred point estimates suggest that a one-percentage-point increase in the unemployment rate in the second quarter of 2020 is associated with, approximately, an additional 0.52 suicides, 28 unemployment benefit recipients, 88 recipients of a temporary loan program, and 10 recipients of public assistance per 100,000 population per month. A simple calculation based on these estimates suggests that if a region experienced a one-percentage-point increase in the unemployment rate caused by the COVID-19 crisis in the second quarter of 2020, which is roughly equivalent to the third-highest regional employment shock, this would be associated with 37.4%, 60.5%, and 26.5% increases in the total, female, and male suicide rates respectively in July 2020 compared with July 2019. These results are primarily correlational rather than causal due to the limitation of our data and research design, but our baseline findings are robust to several different model specifications.


Conflict of interest statement

The authors have declared that no competing interests exist.

Figures
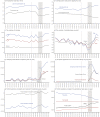
Fig 1
Fig 1. Monthly trends of employment-related variables, suicides and safety-net programs in Japan.
Notes: A vertical line in January 2020 indicates the beginning of the COVID-19 crisis in Japan and a gray area indicates the second quarter of 2020. “Year-on-year” means year-on-year difference. Panels (a) and (b) show different employment-related statistics. Suicides in panels (c) and (d) are counted based on the estimated dates of death. In panel (f), “Emergency Small Amount Funds” and “General Support Funds” are two public temporary loan programs and “Housing Security Benefit” is a temporary housing allowance program. In panel (h), “the elderly” indicates a household with only persons aged 65 or over (and unmarried persons under the age of 18), “single mothers” means households with unmarried women and their children under the age of 18, “the disabled” or “the sick” are households the heads of which are persons with a disability or illness respectively. See Section 2 for more details about these data. Sources: See S2 Table.
Fig 2
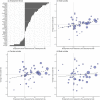
Fig 2. Changes in the unemployment rate and suicide rates.
Notes: In all four graphs, the X axis is the size of an employment shock defined as in Eq (1). The Y axis in panels (b)-(d) is a change in the suicide rate from July 2019 to July 2020. The size of each circle is based on the population size of each prefecture. The dashed line is the fitted linear regression line based on the Ordinary Least Square (OLS) method. Sources: See S2 Table.
Fig 3
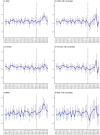
Fig 3. DID estimates for suicide rates.
Notes: Each plot indicates a point estimate and a vertical line indicates a 90% confidence interval that is calculated based on a robust standard error clustered at the prefecture level. All the outcomes are measured as the number of suicides per 100,000 people and the treatment variable is the COVID-19-induced employment shock, which is calculated as Eq (1). Estimates are obtained based on Eq (2) with WLS estimation weighted by prefecture population size. Because Eq (2) incorporates individual (i.e. prefecture) linear trends, estimates can be obtained from February 2019. See S4 and S5 Tables for the values of these baseline estimates and standard errors in the COVID-19 period.
Fig 4
Fig 4. DID estimates for unemployment benefit recipients.
Notes: Each plot indicates a point estimate and a vertical line indicates a 90% confidence interval that is calculated based on a robust standard error clustered at the prefecture level. All the outcomes are measured as the number of recipients per 100,000 people and the treatment variable is the COVID-19-induced employment shock, which is calculated as Eq (1). An outcome variable is year-on-year and calculated as the difference between an outcome value at month t and an outcome value at month t−12. Estimates are obtained based on Eq (2) with WLS estimation weighted by prefecture population size. Because Eq (2) incorporates individual (i.e. prefecture) linear trends, estimates can be obtained from February 2019. See S6 and S7 Tables for the values of these baseline estimates and standard errors in the COVID-19 period.
Fig 5
Fig 5. DID estimates for second-tier safety net programs.
Notes: Each plot indicates a point estimate and a vertical line indicates a 90% confidence interval that is calculated based on a robust standard error clustered at the prefecture level. All of the outcomes are measured as the number of accepted applications per 100,000 people and the treatment variable is the COVID-19-induced employment shock, which is calculated as Eq (1). Estimates are obtained based on Eq (2) with WLS estimation weighted by prefecture population size. Individual linear trends are not introduced due to discontinuously smaller outcome values in the pre-COVID-19 period. For the outcome of Emergency Small Amount Funds and General Support Funds, data for February and March 2020 is missing. For the outcome of the Housing Security Benefit, the reference year is March 2019 instead of January 2020 due to the lack of data during April 2019 and March 2020. See S8 and S9 Tables for the values of these baseline estimates and standard errors in the COVID-19 period.
Fig 6
Fig 6. DID estimates for public assistance.
Notes: Each plot indicates a point estimate and a vertical line indicates a 90% confidence interval that is calculated based on a robust standard error clustered at the prefecture level. All of the outcomes are measured as the number of recipients or recipient households per 100,000 people and the treatment variable is the COVID-19-induced employment shock, which is calculated as Eq (1). An outcome variable is year-on-year and calculated as the difference between an outcome value at month t and an outcome value at month t−12. Estimates are obtained based on Eq (2) with WLS estimation weighted by prefecture population size. Because Eq (2) incorporates individual (i.e. prefecture) linear trends, estimates can be obtained from February 2019. See S10 and S11 Tables for the values of these baseline estimates and standard errors in the COVID-19 period.

Similar articles

Cited by

References

    1. Eguchi A, Nomura S, Gilmour S, Harada N, Sakamoto H, Ueda P, et al.. Suicide by gender and 10-year age groups during the COVID-19 pandemic vs previous five years in Japan: an analysis of national vital statistics. Psychiatry Research. 2021; p. 114173. doi: 10.1016/j.psychres.2021.114173 - DOI - PMC - PubMed
    1. Isumi A, Doi S, Yamaoka Y, Takahashi K, Fujiwara T. Do suicide rates in children and adolescents change during school closure in Japan? The acute effect of the first wave of COVID-19 pandemic on child and adolescent mental health. Child Abuse & Neglect. 2020;110:104680. doi: 10.1016/j.chiabu.2020.104680 - DOI - PMC - PubMed
    1. Nomura S, Kawashima T, Yoneoka D, Tanoue Y, Eguchi A, Gilmour S, et al.. Trends in suicide in Japan by gender during the COVID-19 pandemic, up to September 2020. Psychiatry Research. 2021;295:113622. doi: 10.1016/j.psychres.2020.113622 - DOI - PubMed
    1. Pirkis J, John A, Shin S, DelPozo-Banos M, Arya V, Analuisa-Aguilar P, et al.. Suicide trends in the early months of the COVID-19 pandemic: an interrupted time-series analysis of preliminary data from 21 countries. The Lancet Psychiatry. 2021;. doi: 10.1016/S2215-0366(21)00091-2 - DOI - PMC - PubMed
    1. Sakamoto H, Ishikane M, Ghaznavi C, Ueda P. Assessment of suicide in Japan during the COVID-19 pandemic vs previous years. JAMA Network Open. 2021;4(2):e2037378–e2037378. doi: 10.1001/jamanetworkopen.2020.37378 - DOI - PMC - PubMed

Publication types