

Testing availability, positioning, promotions, and signage of healthier food options and purchasing behaviour within major UK supermarkets: Evaluation of 6 nonrandomised controlled intervention studies
- PMID: 35324919
- PMCID: PMC8946731
- DOI: 10.1371/journal.pmed.1003952
Testing availability, positioning, promotions, and signage of healthier food options and purchasing behaviour within major UK supermarkets: Evaluation of 6 nonrandomised controlled intervention studies
Abstract
Background: Governments are increasingly looking for policies to change supermarket environments to support healthier food purchasing. We evaluated 6 interventions within major United Kingdom grocery stores, including availability, positioning, promotions, and signage strategies to encourage selection of healthier products.
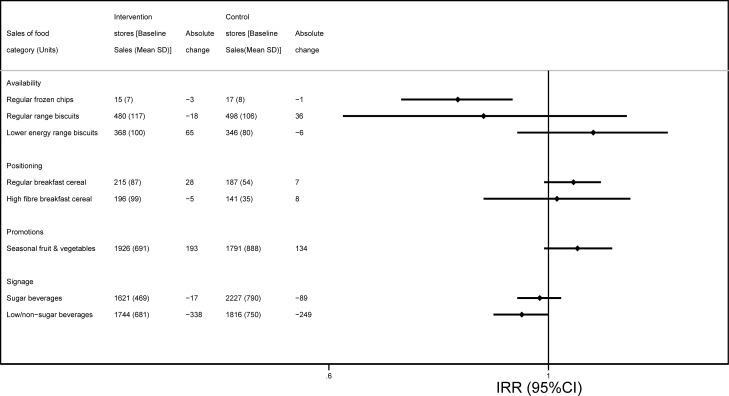
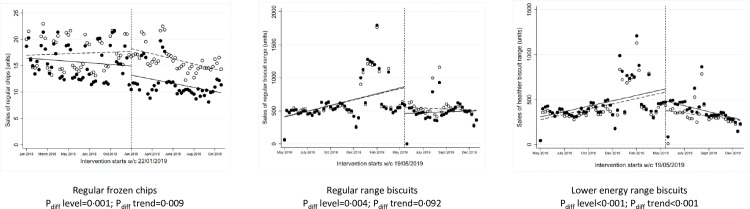
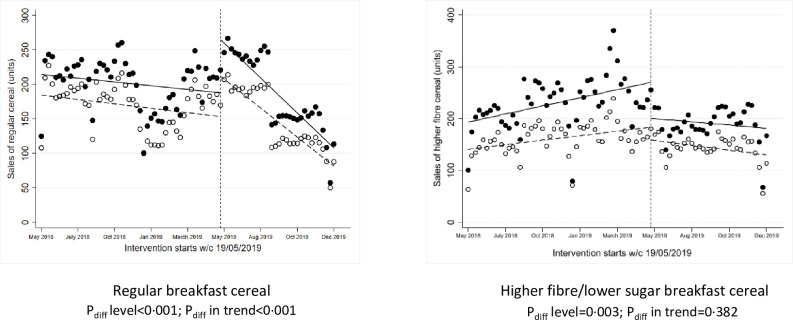
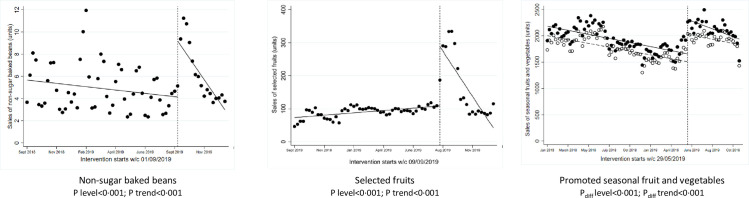
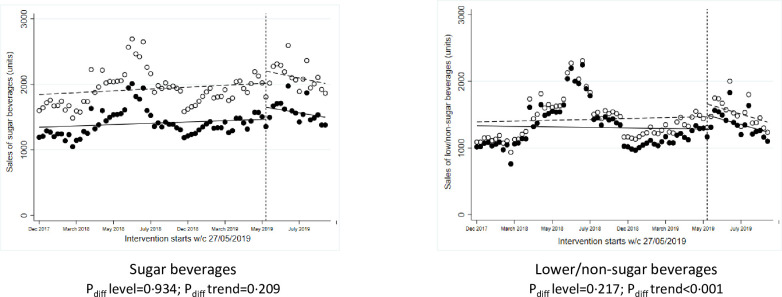
Methods and findings: Nonrandomised controlled study designs were used, except for one intervention that was rolled out nationwide using a pre/post within-store design. Store-level weekly sales (units, weight (g), and value (£)) of products targeted in the interventions were used in primary analyses using multivariable hierarchical models and interrupted time series (ITS) analyses. Stocking low fat chips next to regular chips was associated with decreases in sales of regular chips (units) in intervention versus control stores (-23% versus -4%; P = 0.001) with a significant level change in ITS models (P = 0.001). Increasing availability of lower energy packs of biscuits was associated with increased sales but reduced sales of regular biscuits in intervention versus control stores (lower energy biscuits +18% versus -2%; P = 0.245; regular biscuits -4% versus +7%; P = 0.386), although not significantly, though there was a significant level change in ITS models (P = 0.004 for regular biscuits). There was no evidence that a positioning intervention, placing higher fibre breakfast cereals at eye level was associated with increased sales of healthier cereal or reduced sales of regular cereal. A price promotion on seasonal fruits and vegetables showed no evidence of any greater increases in sales of items on promotion in intervention versus control stores (+10% versus +8%; P = 0.101) but a significant level change in ITS models (P < 0.001). A nationwide promotion using Disney characters was associated with increased sales of nonsugar baked beans (+54%) and selected fruits (+305%), with a significant level change in ITS models (P < 0.001 for both). Shelf labels to highlight lower sugar beverages showed no evidence of changes in purchasing of lower or higher sugar drinks. These were all retailer-led interventions that present limitations regarding the lack of randomisation, residual confounding from unmeasured variables, absolute differences in trends and sales between intervention versus control stores, and no independent measures of intervention fidelity.
Conclusions: Increasing availability and promotions of healthier alternatives in grocery stores may be promising interventions to encourage purchasing of healthier products instead of less healthy ones. There was no evidence that altering positioning within an aisle or adding shelf edge labelling is associated with changes in purchasing behaviours.
Trial registration: https://osf.io/br96f/.
Conflict of interest statement
The authors have declared that no competing interests exist.
Figures
Similar articles
-
Removing seasonal confectionery from prominent store locations and purchasing behaviour within a major UK supermarket: Evaluation of a nonrandomised controlled intervention study.PLoS Med. 2022 Mar 24;19(3):e1003951. doi: 10.1371/journal.pmed.1003951. eCollection 2022 Mar. PLoS Med. 2022. PMID: 35324903 Free PMC article. Clinical Trial.
-
Altering product placement to create a healthier layout in supermarkets: Outcomes on store sales, customer purchasing, and diet in a prospective matched controlled cluster study.PLoS Med. 2021 Sep 7;18(9):e1003729. doi: 10.1371/journal.pmed.1003729. eCollection 2021 Sep. PLoS Med. 2021. PMID: 34491999 Free PMC article.
-
The effect of a shelf placement intervention on sales of healthier and less healthy breakfast cereals in supermarkets: A co-designed pilot study.Soc Sci Med. 2020 Dec;266:113337. doi: 10.1016/j.socscimed.2020.113337. Epub 2020 Sep 1. Soc Sci Med. 2020. PMID: 32950330
-
Environmental interventions to reduce the consumption of sugar-sweetened beverages and their effects on health.Cochrane Database Syst Rev. 2019 Jun 12;6(6):CD012292. doi: 10.1002/14651858.CD012292.pub2. Cochrane Database Syst Rev. 2019. PMID: 31194900 Free PMC article.
-
Grocery store interventions to change food purchasing behaviors: a systematic review of randomized controlled trials.Am J Clin Nutr. 2018 Jun 1;107(6):1004-1016. doi: 10.1093/ajcn/nqy045. Am J Clin Nutr. 2018. PMID: 29868912 Free PMC article.
Cited by
-
Rebalancing the marketing of healthier versus less healthy food products.PLoS Med. 2022 Mar 24;19(3):e1003956. doi: 10.1371/journal.pmed.1003956. eCollection 2022 Mar. PLoS Med. 2022. PMID: 35324913 Free PMC article.
-
The impact of altering restaurant and menu option position on food selected from an experimental food delivery platform: a randomised controlled trial.Int J Behav Nutr Phys Act. 2023 May 19;20(1):60. doi: 10.1186/s12966-023-01456-8. Int J Behav Nutr Phys Act. 2023. PMID: 37208720 Free PMC article. Clinical Trial.
-
Women Consumers' Views on Legislation to Restrict Prominent Placement and Multibuy Promotions of High Fat, Sugar, and Salt Products in England: A Qualitative Perspective.Int J Health Policy Manag. 2023;12:7597. doi: 10.34172/ijhpm.2023.7597. Epub 2023 Sep 10. Int J Health Policy Manag. 2023. PMID: 38618804 Free PMC article.
-
Do promotions of healthier or more sustainable foods increase sales? Findings from three natural experiments in UK supermarkets.BMC Public Health. 2024 Jun 21;24(1):1658. doi: 10.1186/s12889-024-19080-x. BMC Public Health. 2024. PMID: 38907224 Free PMC article.
References
-
- Steel NFJ, Newton JN, Newton JN, Davis ACJ, Vos T, Naghavi M, et al.. Changes in health in the countries of the UK and 150 English Local Authority areas 1990–2016: a systematic analysis for the Global Burden of Disease Study 2016. Lancet. 201892(10158):1647–61. doi: 10.1016/S0140-6736(18)32207-4 - DOI - PMC - PubMed
-
- England PH. National Diet and Nutrition Survey: Results from years 7 and 8 (combined) 2018.
-
- Department for Environment Food and Rural Affairs. Food Statistics Pocketbook 2014. London: 2015 2015. Report No.
Publication types
MeSH terms
Substances
Grants and funding
LinkOut - more resources
Full Text Sources
