

Depth and benthic habitat influence shallow and mesophotic predatory fishes on a remote, high-latitude coral reef
- PMID: 35324946
- PMCID: PMC8947262
- DOI: 10.1371/journal.pone.0265067
Depth and benthic habitat influence shallow and mesophotic predatory fishes on a remote, high-latitude coral reef
Abstract
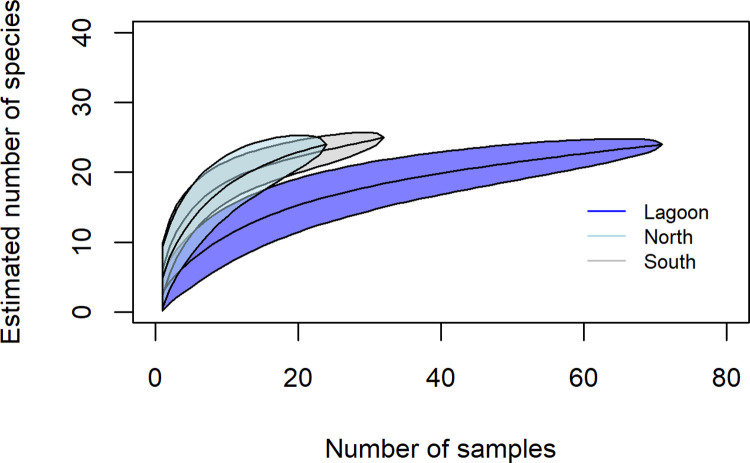
Predatory fishes on coral reefs continue to decline globally despite playing key roles in ecosystem functioning. Remote atolls and platform reefs provide potential refugia for predator populations, but quantitative information on their spatial distribution is required to establish accurate baselines for ongoing monitoring and conservation management. Current knowledge of predatory fish populations has been derived from targeted shallow diver-based surveys (<15 m). However, the spatial distribution and extent of predatory fishes on outer mesophotic shelf environments has remained under described. Middleton Reef is a remote, high-latitude, oceanic platform reef that is located within a no-take area in the Lord Howe Marine Park off eastern Australia. Here we used baited remote underwater stereo video to sample predatory fishes across lagoon and outer shelf habitats from depths 0-100 m, extending knowledge on use of mesophotic depths and habitats. Many predatory fish demonstrated clear depth and habitat associations over this depth range. Carcharhinid sharks and Carangid fishes were the most abundant predators sampled on Middleton Reef, with five predatory fishes accounting for over 90% of the predator fish biomass. Notably, Galapagos shark (Carcharhinus galapagensis) and the protected black rockcod (Epinephelus daemelii) dominated the predator fish assemblage. A higher richness of predator fish species was sampled on reef areas north and south of the lagoon. The more exposed southern aspect of the reef supported a different suite of predator fish across mesophotic habitats relative to the assemblage recorded in the north and lagoonal habitats, a pattern potentially driven by differences in hard coral cover. Biomass of predatory fishes in the more sheltered north habitats was twice that of other areas, predominantly driven by high abundances of Galapagos shark. This work adds to the growing body of literature highlighting the conservation value of isolated oceanic reefs and the need to ensure that lagoon, shallow and mesophotic habitats in these systems are adequately protected, as they support vulnerable ecologically and economically important predator fish assemblages.
Conflict of interest statement
The authors have declared that no competing interests exist. The funders had no role in study design, data collection and analysis, decision to publish, or preparation of the manuscript.
Figures


Similar articles
-
Conventional and technical diving surveys reveal elevated biomass and differing fish community composition from shallow and upper mesophotic zones of a remote United States coral reef.PLoS One. 2017 Nov 21;12(11):e0188598. doi: 10.1371/journal.pone.0188598. eCollection 2017. PLoS One. 2017. PMID: 29161314 Free PMC article.
-
Depth and habitat are important drivers of abundance for predatory reef fish off Pemba Island, Tanzania.Mar Environ Res. 2022 Mar;175:105587. doi: 10.1016/j.marenvres.2022.105587. Epub 2022 Feb 16. Mar Environ Res. 2022. PMID: 35196583
-
Taking a deeper look: Quantifying the differences in fish assemblages between shallow and mesophotic temperate rocky reefs.PLoS One. 2019 Mar 15;14(3):e0206778. doi: 10.1371/journal.pone.0206778. eCollection 2019. PLoS One. 2019. PMID: 30875385 Free PMC article.
-
Interactions between coral restoration and fish assemblages: implications for reef management.J Fish Biol. 2020 Sep;97(3):633-655. doi: 10.1111/jfb.14440. Epub 2020 Jul 20. J Fish Biol. 2020. PMID: 32564370 Review.
-
The flourishing and vulnerabilities of zoantharians on Southwestern Atlantic reefs.Mar Environ Res. 2022 Jan;173:105535. doi: 10.1016/j.marenvres.2021.105535. Epub 2021 Nov 24. Mar Environ Res. 2022. PMID: 34879290 Review.
Cited by
-
Limited Evidence for Depth Specialism in Isolated Seamount Reef Predators.Ecol Evol. 2025 Aug 28;15(9):e72044. doi: 10.1002/ece3.72044. eCollection 2025 Sep. Ecol Evol. 2025. PMID: 40896105 Free PMC article.
References
-
- Jiménez J, Nuñez-Arjona JC, Mougeot F, Ferreras P, González LM, García-Domínguez F, et al.. Restoring apex predators can reduce mesopredator abundances. Biol Conserv. 2019;238: 108234.
-
- Sivy KJ, Pozzanghera CB, Colson KE, Mumma MA, Prugh LR. Apex predators and the facilitation of resource partitioning among mesopredators. Oikos. 2018;127: 607–621.
Publication types
MeSH terms
LinkOut - more resources
Full Text Sources
