

Mapping local hot spots with routine tuberculosis data: A pragmatic approach to identify spatial variability
- PMID: 35324987
- PMCID: PMC8947086
- DOI: 10.1371/journal.pone.0265826
Mapping local hot spots with routine tuberculosis data: A pragmatic approach to identify spatial variability
Abstract
Objective: To use routinely collected data, with the addition of geographic information and census data, to identify local hot spots of rates of reported tuberculosis cases.
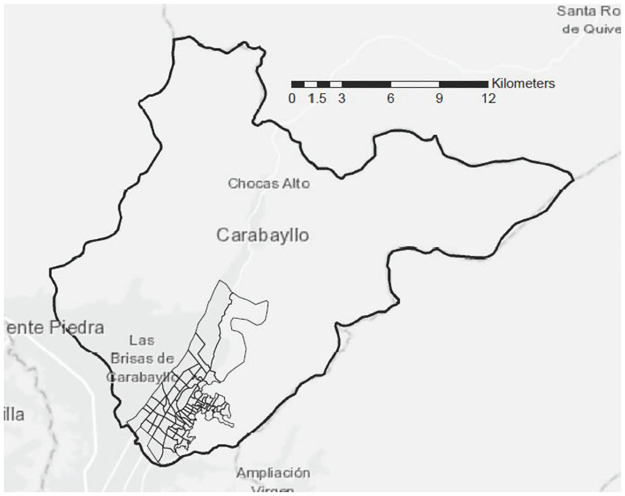
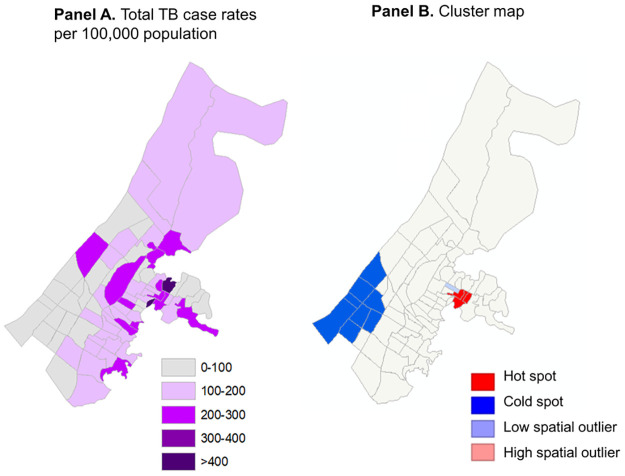
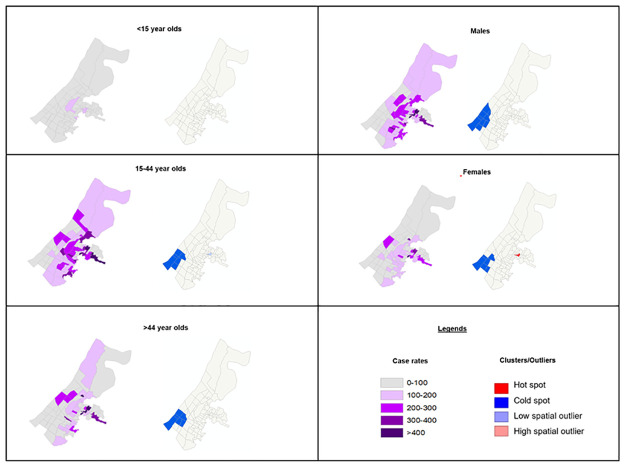
Design: Residential locations of tuberculosis cases identified from eight public health facilities in Lima, Peru (2013-2018) were linked to census data to calculate neighborhood-level annual case rates. Heat maps of tuberculosis case rates by neighborhood were created. Local indicators of spatial autocorrelation, Moran's I, were used to identify where in the study area spatial clusters and outliers of tuberculosis case rates were occurring. Age- and sex-stratified case rates were also assessed.
Results: We identified reports of 1,295 TB cases across 74 neighborhoods during the five-year study period, for an average annual rate of 124.2 reported TB cases per 100,000 population. In evaluating case rates by individual neighborhood, we identified a median rate of reported cases of 123.6 and a range from 0 to 800 cases per 100,000 population. Individuals aged 15-44 years old and men had higher case rates than other age groups and women. Locations of both hot and cold spots overlapped across age- and gender-specific maps.
Conclusions: There is significant geographic heterogeneity in rates of reported TB cases and evident hot and cold spots within the study area. Characterization of the spatial distribution of these rates and local hot spots may be one practical tool to inform the work of local coalitions to target TB interventions in their zones.
Conflict of interest statement
The authors have declared that no competing interests exist.
Figures
Similar articles
-
Spatial distribution of people diagnosed with tuberculosis through routine and active case finding: a community-based study in Kampala, Uganda.Infect Dis Poverty. 2020 Jun 22;9(1):73. doi: 10.1186/s40249-020-00687-2. Infect Dis Poverty. 2020. PMID: 32571435 Free PMC article.
-
Investigation of space-time clusters and geospatial hot spots for the occurrence of tuberculosis in Beijing.Int J Tuberc Lung Dis. 2012 Apr;16(4):486-91. doi: 10.5588/ijtld.11.0255. Int J Tuberc Lung Dis. 2012. PMID: 22325066
-
A Spatial Analysis of Tuberculosis Related Mortality in South Africa.Int J Environ Res Public Health. 2021 Nov 12;18(22):11865. doi: 10.3390/ijerph182211865. Int J Environ Res Public Health. 2021. PMID: 34831621 Free PMC article.
-
Mapping tuberculosis treatment outcomes in Ethiopia.BMC Infect Dis. 2019 May 28;19(1):474. doi: 10.1186/s12879-019-4099-8. BMC Infect Dis. 2019. PMID: 31138129 Free PMC article.
-
Accounting for autocorrelation in multi-drug resistant tuberculosis predictors using a set of parsimonious orthogonal eigenvectors aggregated in geographic space.Geospat Health. 2010 May;4(2):201-17. doi: 10.4081/gh.2010.201. Geospat Health. 2010. PMID: 20503189
Cited by
-
Integrating geographic information systems into veterinary education within the one health framework: an interdisciplinary approach.Front Vet Sci. 2025 Jul 9;12:1612524. doi: 10.3389/fvets.2025.1612524. eCollection 2025. Front Vet Sci. 2025. PMID: 40703929 Free PMC article.
-
Surveillance of tuberculosis incidence and mortality through spatio-temporal analysis in Oyo State, Nigeria.PLoS One. 2025 Jul 16;20(7):e0311739. doi: 10.1371/journal.pone.0311739. eCollection 2025. PLoS One. 2025. PMID: 40668812 Free PMC article.
-
Spatial Distribution of Drug-Resistant Mycobacterium tuberculosis Infections in Rural Eastern Cape Province of South Africa.Pathogens. 2023 Mar 17;12(3):475. doi: 10.3390/pathogens12030475. Pathogens. 2023. PMID: 36986397 Free PMC article.
-
Effectiveness of Using AI-Driven Hotspot Mapping for Active Case Finding of Tuberculosis in Southwestern Nigeria.Trop Med Infect Dis. 2024 Apr 29;9(5):99. doi: 10.3390/tropicalmed9050099. Trop Med Infect Dis. 2024. PMID: 38787032 Free PMC article.
-
Geo-spatial high-risk clusters of Tuberculosis in the global general population: a systematic review.BMC Public Health. 2023 Aug 19;23(1):1586. doi: 10.1186/s12889-023-16493-y. BMC Public Health. 2023. PMID: 37598144 Free PMC article.
References
-
- World Health Organization. Global tuberculosis report 2021. WHO: Geneva, Switzerland; 2021. https://www.who.int/publications/i/item/9789240037021. Accessed October 2021.
-
- Keshavjee S, Nicholson T, Khan AJ, Ditiu L, Farmer PE, Becerra MC. Tuberculosis epidemic control: A comprehensive strategy to drive down tuberculosis. In: Friedman L, Dedicoat M, Davies PDO, ed. Clinical Tuberculosis. Sixth ed.: Boca Raton: CRC Press; 2020.
Publication types
MeSH terms
Grants and funding
LinkOut - more resources
Full Text Sources
Medical
