

Comparison of parameters derived from a three-minute all-out test with classical benchmarks for running exercise
- PMID: 35324999
- PMCID: PMC8947413
- DOI: 10.1371/journal.pone.0266012
Comparison of parameters derived from a three-minute all-out test with classical benchmarks for running exercise
Abstract
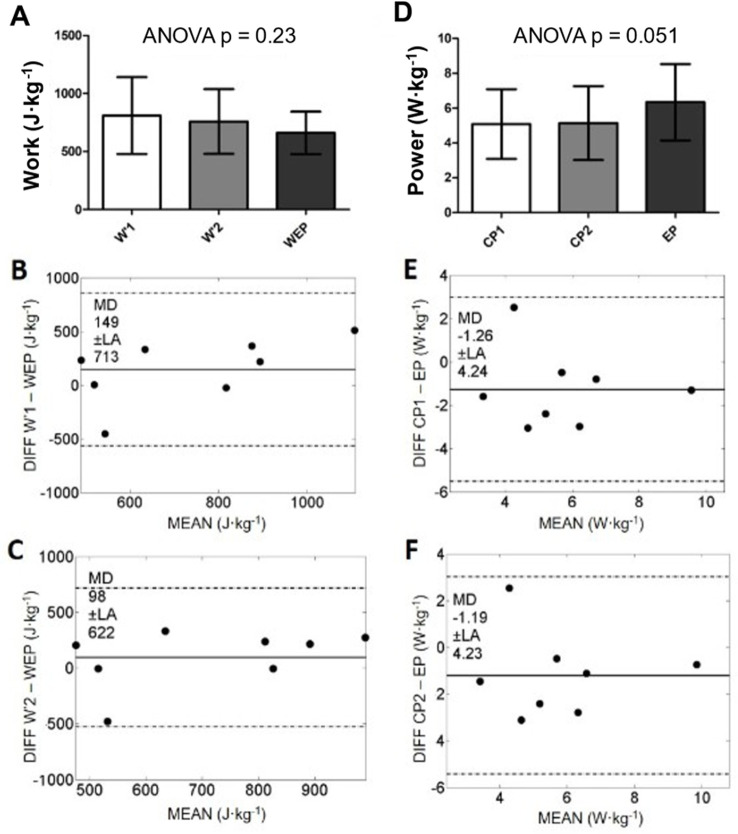
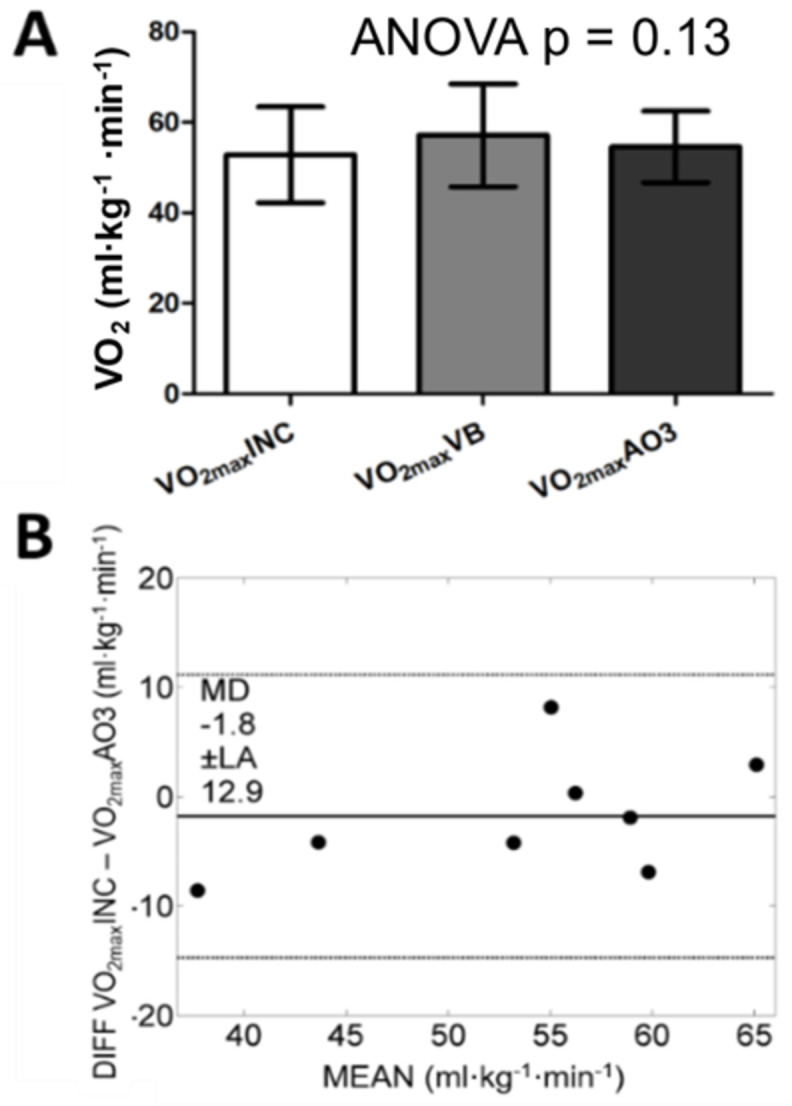
This study aimed to compare four constructs from the three-minute all-out test (AO3)-end power (EP), the area above EP (WEP), maximum power (Pmax), and attained [Formula: see text]-to those derived from the classical CP model in tethered running. Seventeen male recreational runners underwent two experiments to test for reliability and agreement of AO3 parameters with those obtained from the classical CP model (Wꞌ and CP), a graded exercise test ([Formula: see text]) and a 30-second all-out test (AO30s; Pmax); all performed on a non-motorized treadmill (NMT). Significance levels were set at p<0.05. There were no significant differences between test-retest for Pmax (p = 0.51), WEP (p = 0.39), and EP (p = 0.64), showing generally close to zero bias. Further, retest ICC were high for Pmax and EP (ICC > 0.86) but moderate for WEP (ICC = 0.69). Pmax showed no difference between AO3 and AO30s (p = 0.18; CV% = 9.5%). EP and WEP disagreed largely with their classical critical power model counterparts (p = 0.05; CV%>32.7% and p = 0.23; CV%>39.7%, respectively), showing greater error than their test-retest reliability. [Formula: see text] from AO3 was not different (p = 0.13) and well related (CV% = 8.4; ICC = 0.87) to the incremental test [Formula: see text]. Under the studied conditions, the agreement of EP and WEP to CP and Wꞌ was not strong enough to assure their use interchangeably. Pmax and [Formula: see text] were closer to their criterion parameters.
Conflict of interest statement
The authors have declared that no competing interests exist.
Figures


Similar articles
-
Comparison of physiological responses of running on a nonmotorized and conventional motor-propelled treadmill at similar intensities.Sci Rep. 2022 Jul 8;12(1):11626. doi: 10.1038/s41598-022-13741-w. Sci Rep. 2022. PMID: 35804037 Free PMC article.
-
Parameters of the 3-Minute All-Out Test: Overestimation of Competitive-Cyclist Time-Trial Performance in the Severe-Intensity Domain.Int J Sports Physiol Perform. 2017 May;12(5):655-661. doi: 10.1123/ijspp.2016-0111. Epub 2016 Sep 26. Int J Sports Physiol Perform. 2017. PMID: 27768521
-
Effects of Two Hours of Heavy-Intensity Exercise on the Power-Duration Relationship.Med Sci Sports Exerc. 2018 Aug;50(8):1658-1668. doi: 10.1249/MSS.0000000000001601. Med Sci Sports Exerc. 2018. PMID: 29521722
-
The 'Critical Power' Concept: Applications to Sports Performance with a Focus on Intermittent High-Intensity Exercise.Sports Med. 2017 Mar;47(Suppl 1):65-78. doi: 10.1007/s40279-017-0688-0. Sports Med. 2017. PMID: 28332113 Free PMC article. Review.
-
Submaximal, Perceptually Regulated Exercise Testing Predicts Maximal Oxygen Uptake: A Meta-Analysis Study.Sports Med. 2016 Jun;46(6):885-97. doi: 10.1007/s40279-015-0465-x. Sports Med. 2016. PMID: 26790419 Review.
References
-
- Monod H, Scherrer J. The work capacity of a synergic muscular group. Ergonomics. 1965. Jul;8(3):329–38.
Publication types
MeSH terms
LinkOut - more resources
Full Text Sources
Miscellaneous
