. 2022 Aug 24;118(11):2458-2477.
doi: 10.1093/cvr/cvac036.

Endothelial OCT4 is atheroprotective by preventing metabolic and phenotypic dysfunction

Affiliations

Endothelial OCT4 is atheroprotective by preventing metabolic and phenotypic dysfunction

Junchul Shin et al. Cardiovasc Res. .

Abstract

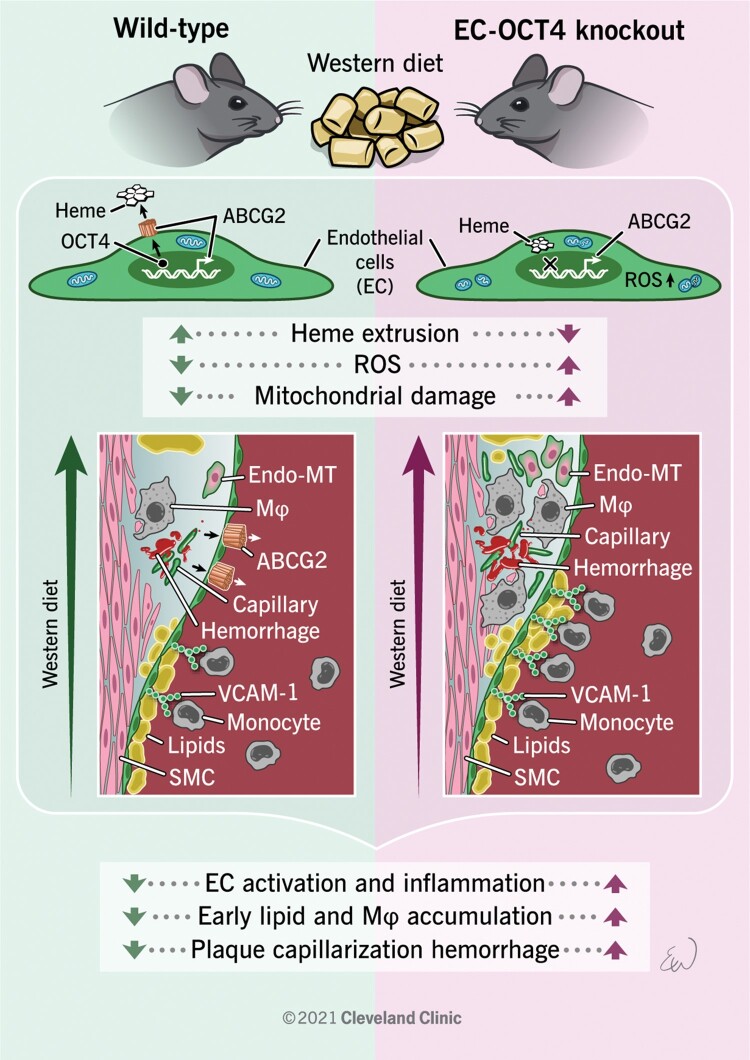
Aims: Until recently, the pluripotency factor Octamer (ATGCAAAT)-binding transcriptional factor 4 (OCT4) was believed to be dispensable in adult somatic cells. However, our recent studies provided clear evidence that OCT4 has a critical atheroprotective role in smooth muscle cells. Here, we asked if OCT4 might play a functional role in regulating endothelial cell (EC) phenotypic modulations in atherosclerosis.

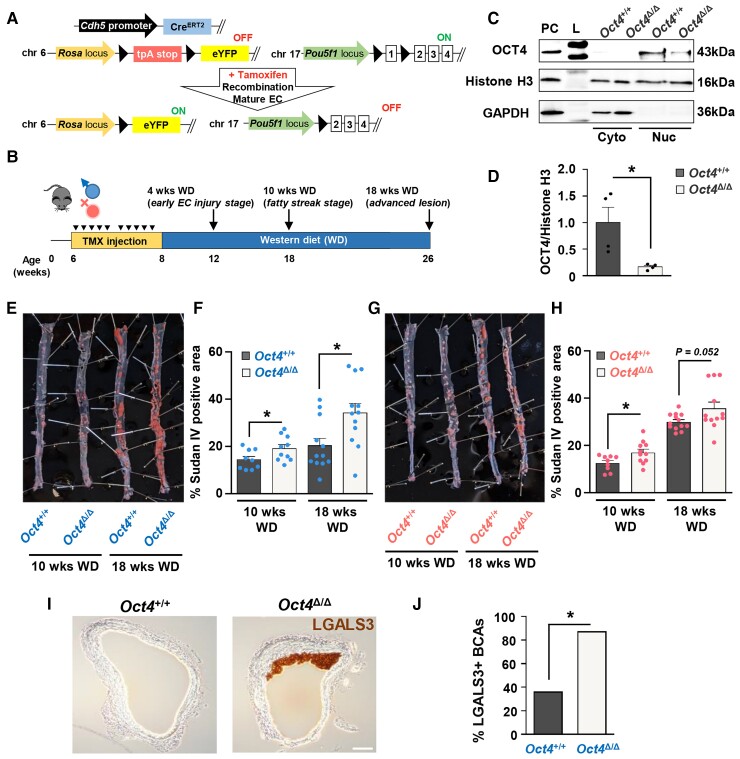
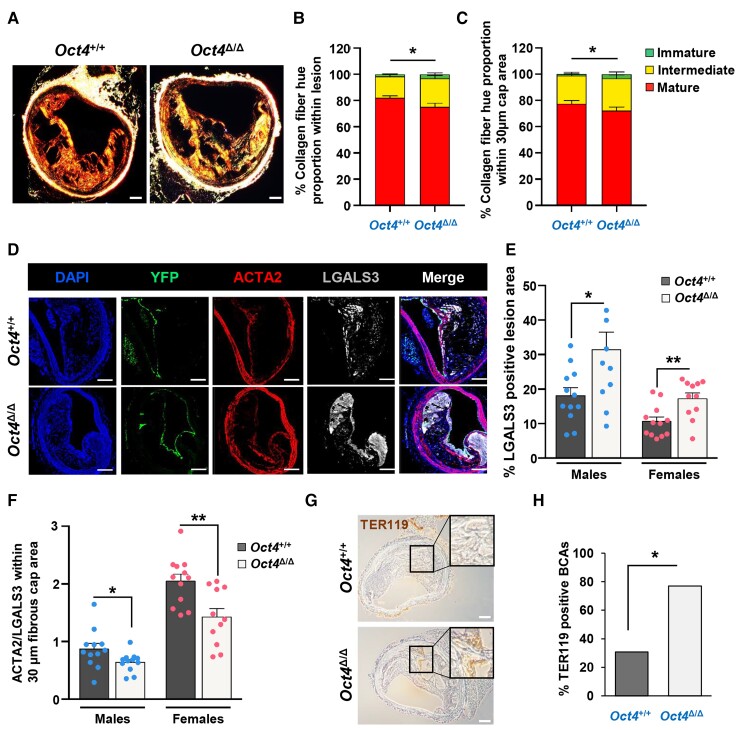
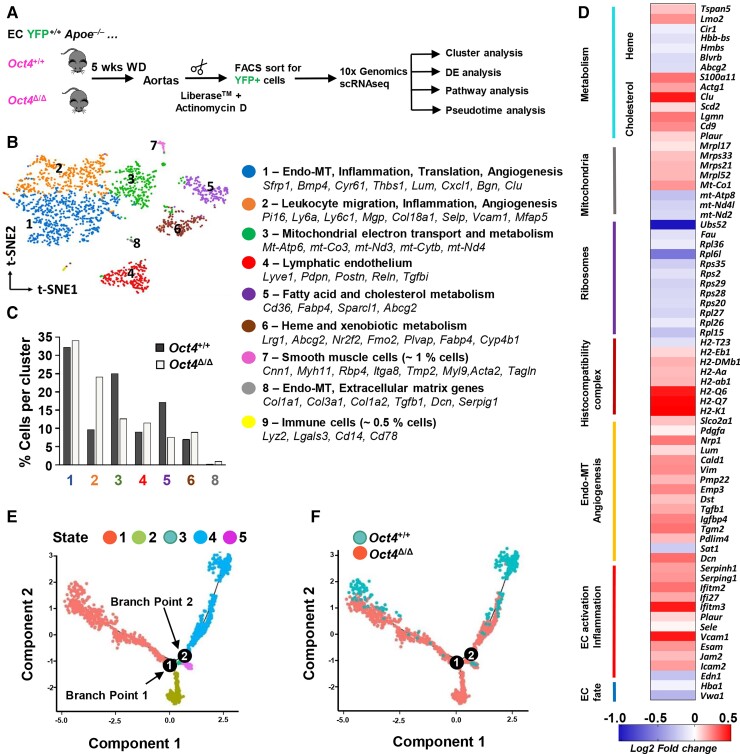
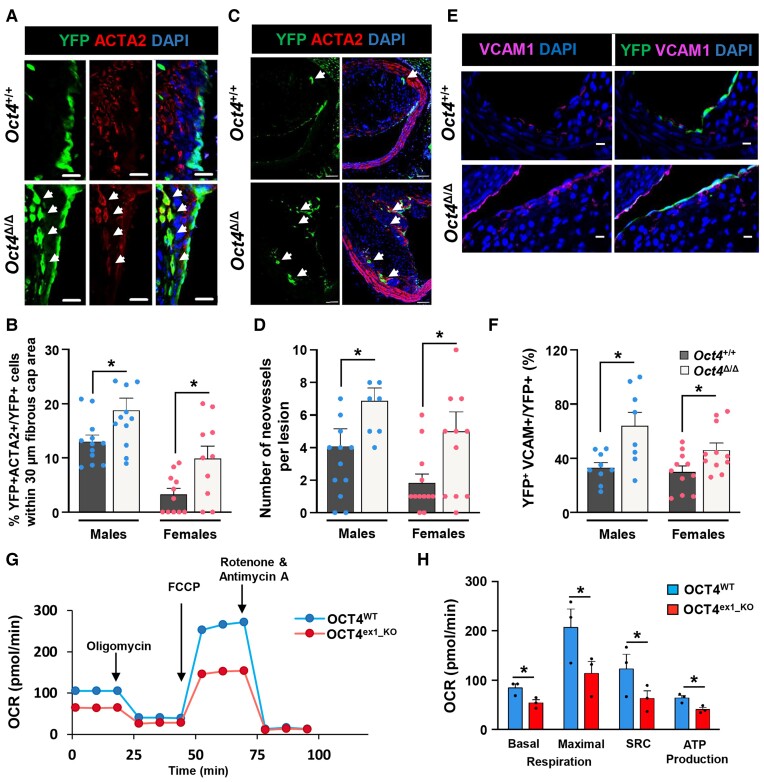
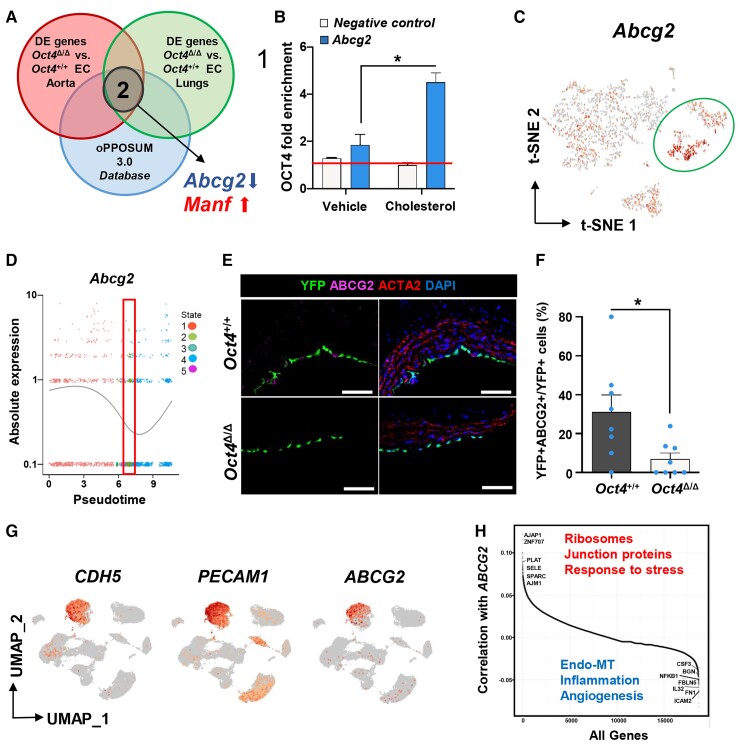
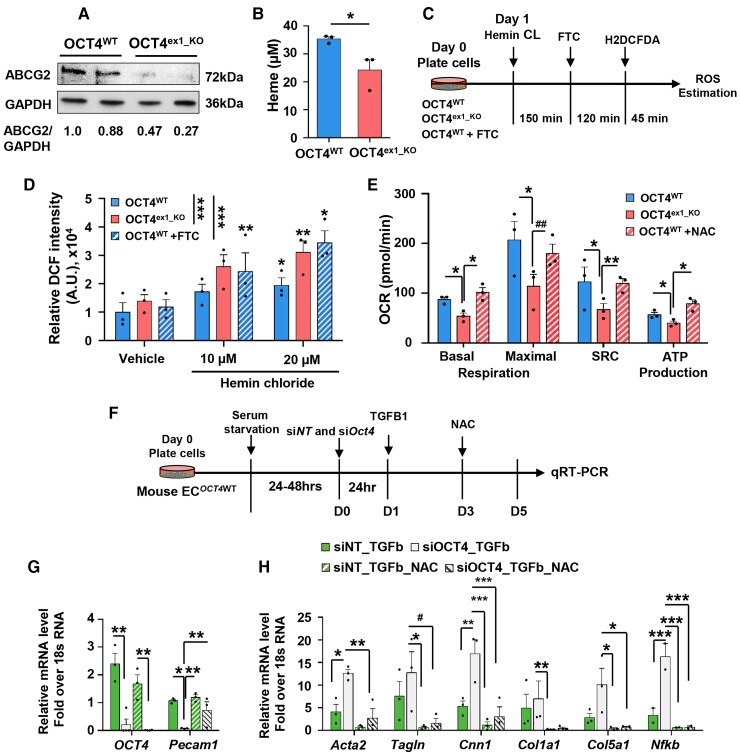
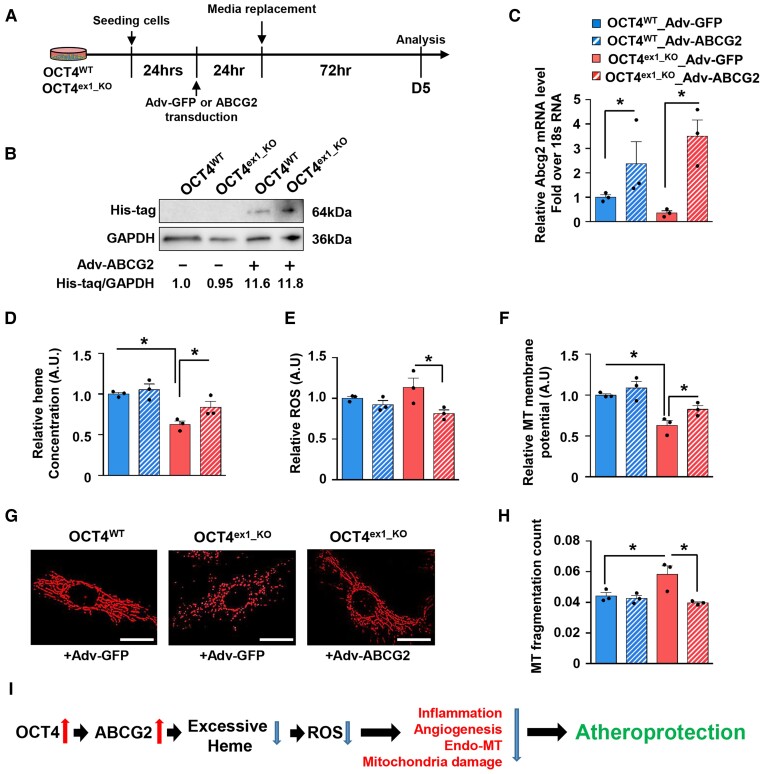
Methods and results: Specifically, we show that EC-specific Oct4 knockout resulted in increased lipid, LGALS3+ cell accumulation, and altered plaque characteristics consistent with decreased plaque stability. A combination of single-cell RNA sequencing and EC-lineage-tracing studies revealed increased EC activation, endothelial-to-mesenchymal transitions, plaque neovascularization, and mitochondrial dysfunction in the absence of OCT4. Furthermore, we show that the adenosine triphosphate (ATP) transporter, ATP-binding cassette (ABC) transporter G2 (ABCG2), is a direct target of OCT4 in EC and establish for the first time that the OCT4/ABCG2 axis maintains EC metabolic homeostasis by regulating intracellular heme accumulation and related reactive oxygen species production, which, in turn, contributes to atherogenesis.

Conclusions: These results provide the first direct evidence that OCT4 has a protective metabolic function in EC and identifies vascular OCT4 and its signalling axis as a potential target for novel therapeutics.

Keywords: ABCG2; Atherosclerosis; Heme; OCT4; ROS.


Conflict of interest statement

Conflict of interest: none declared.

Figures

None
Graphical abstract
Figure 1
Figure 1
EC-specific conditional knockout of Oct4 exacerbates atherosclerosis in Apoe−/− mice. (A) EC-specific-lineage-tracing and conditional Oct4 knockout mouse model. Schematic of Cdh5-CreERT2; Oct4Flox/Flox; Rosa-Stop-eYFP+/+Apoe−/− mouse (designated as Oct4Flox/Flox). Mice received 10 injections of tamoxifen (TMX) between 6 and 8 weeks of age. In response to tamoxifen, Cre-recombinase under the control of the Cdh5 gene promoter excises LoxP sites (black triangles), removing Oct4 exon 1 (responsible for pluripotency) and STOP codon upstream of eYFP specifically in EC. Finally, it provides simultaneous EC-lineage-tracing and EC-specific Oct4 knockout. (B) Schematic of animal experiments. (C) Representative western blot showing protein levels of OCT4, Histone H3, and GAPDH in nuclear (Nuc) and cytoplasmic (Cyto) extracts from EC isolated from aortas of EC-specific OCT4 knockout (Oct4Δ/Δ) and wild-type (Oct4+/+) mice. L, ladder; PC, positive control, A404 precursor cells. (D) Densitometry quantification of Western blots. Values = mean ± S.E.M.. *P < 0.05 by unpaired t-test; n = 3 independent experiments. (EH) Sudan IV en face staining and quantification of lesion area in aortas of Oct4Δ/Δ and Oct4+/+ male (E and F) and female (G and H) mice after 10 or 18 weeks of WD feeding. Values = mean ± S.E.M.. *P < 0.05, #P = 0.052 by unpaired t-test; Oct4+/+: n = 9 for 10 weeks and n = 12 for 18 weeks of WD; Oct4Δ/Δ: n = 11 (females) and n = 10 (males) for 10 weeks and n = 12 for 18 weeks of WD. (I) Representative immunostaining of LGALS3 in BCAs collected from Oct4Δ/Δ and Oct4+/+ male mice after 4 weeks of WD feeding. Scale bar = 100 µm. (J) The percentage of male mice with LGALS3-positive staining in Oct4+/+ (n = 4/11 positive BCAs) and Oct4Δ/Δ (n = 7/8 positive BCAs) BCAs. BCAs were analysed at 60 µm distance from aortic arch. *P < 0.05 by Fisher’s exact test.
Figure 2
Figure 2
EC-specific conditional knockout of Oct4 destabilizes atherosclerotic plaque. (AC) Assessment of collagen fibre hue variations based on PicroSirius Red staining followed by polarized microscopy. (A) PicroSirius Red staining of representative BCA cross-sections of Oct4Δ/Δ and Oct4+/+ male mice fed WD for 18 weeks. Scale bar = 100 µm. The ratio between the amount of immature (green), intermediate (yellow), and mature (red) collagen fibrils showed a significant decrease in mature fibrils within the lesion (B) and the 30 µm fibrous cap area (C) of Oct4Δ/Δ mice (n = 13) as compared with control mice (n = 14), ±S.E.M.. *P < 0.05 (for mature fibrils) by unpaired Student t-test. (D) Immunofluorescence staining of DAPI, YFP, ACTA2, and LGALS3 on representative BCA sections of Oct4+/+ and Oct4Δ/Δ mice fed WD for 18 weeks, showing a noticeable increase in LGALS3+ cells in the lesion. Scale bar = 100 µm. (E and F) Quantification of the percentages of LGALS3+ lesion area (E) and the ratio of ACTA2+ cells over LGALS3+ cells within the 30 µm protective fibrous cap area (F) of BCAs collected from Oct4Δ/Δ and Oct4+/+ male and female mice after 18 weeks of WD feeding. Values = mean ± S.E.M., *P < 0.05 determined by either unpaired t-test with Welch correction (E) or unpaired t-test (F) for Oct4+/+ (n = 12 males; 12 females) vs. Oct4Δ/Δ (n = 12 males; 11 females) mice. (G) Immunostaining for the red blood cell marker TER119. Scale bar = 100 µm. Inserts indicate magnified areas. (H) The percentage of BCAs exhibiting intraplaque haemorrhage based on TER119 staining in Oct4+/+ (n = 4/13 positive BCAs) vs. Oct4Δ/Δ (n = 10/13 positive BCAs) male mice. BCAs were analysed at 120, 420, and 720 µm distance from aortic arch. If any of these three locations had any TER119-positive staining, that animal was marked as positive for haemorrhage. *P < 0.05 by Fisher’s exact test.
Figure 3
Figure 3
Single-cell RNA sequencing reveals marked transcriptomic alterations in Oct4 knockout EC from mouse atherosclerotic aortas. (A) Schematic for 10× Genomic scRNA-seq experiment. ECs were isolated from aortas of Oct4+/+ (n = 2) and Oct4Δ/Δ (n = 3) female mice after 5 weeks of WD feeding. Aortas were digested in Liberase in the presence of the RNA polymerase inhibitor, actinomycin D, to prevent transcriptional changes during cell preparation. Aortic cells were FACS-sorted based on the EC lineage tracer, eYFP, followed by 10× scRNA-seq protocol. Following quality control, we obtained 449 ECs from Oct4+/+ mice and 1623 cells from Oct4Δ/Δ mice. (B) An aggregated t-distributed stochastic neighbour embedding (t-SNE) plot of YFP+ EC from Oct4+/+ and Oct4Δ/Δ mice coloured by cluster. Clusters were characterized based on the specific markers. (C) Percentage of Oct4+/+ and Oct4Δ/Δ cells in each cluster. (D) DE analysis revealed 405 up- and down-regulated genes in Oct4Δ/Δ as compared with Oct4+/+ EC, including up-regulation of adhesion and pro-inflammatory genes, as well as genes involved in EndoMT and angiogenesis, and down-regulation of EC fate genes and genes involved in mitochondria and heme metabolism. (E) Pseudotime analysis discovered five distinct states of the integrated Oct4+/+ and Oct4Δ/Δ EC with two cell fate decision points. (F) Ordering of Oct4+/+ and Oct4Δ/Δ EC along the pseudotime trajectory revealed two unique states (States 2 and 3) of EC from Oct4Δ/Δ mice as compared with Oct4+/+ mice.
Figure 4
Figure 4
Loss of OCT4 in EC results in increased EndoMT, neovascularization, and the number of VCAM1+ cells in plaques and decreased mitochondrial respiration in vitro. (A and C) Representative immunostaining on serially sectioned BCAs collected from Oct4+/+ or Oct4Δ/Δ mice fed WD for 18 weeks; fibrous cap area (A) or lesion area (C). (A) White arrows indicating YFP+ACTA2+ EC undergoing EndoMT. Scale bar = 20 µm. (B) Quantification of the percentage of YFP+ACTA2+ cells within the total YFP+DAPI+ cell population in the 30 µm protective fibrous cap area of the male and female lesions. Data were analysed by unpaired t-test (males) or non-parametric Mann–Whitney test (females); *P < 0.05 (n = 12 males; 12 females) vs. Oct4Δ/Δ (n = 12 males; 11 females) mice. (C) White arrows indicating capillary-like YFP+ neovessels. Scale bar = 50 µm. (D) Quantification of the number of YFP+ intraplaque capillary-like neovessels. Values = mean ± S.E.M.; data were analysed by non-parametric Mann–Whitney test; *P < 0.05 Oct4Δ/Δ (n = 9 males; 12 females) vs. Oct4+/+ (n = 9 males; 11 females) mice. (E) Representative immunostaining serially sectioned BCAs collected from Oct4+/+ or Oct4Δ/Δ male fed WD for 10 weeks. Scale bar = 10 µm. (F) Quantification of the percentage of YFP+VCAM1 + DAPI+ cells within the total YFP+ cell population at the luminal surface of the male and female vessels. Values = mean ± S.E.M.; *P < 0.05 by unpaired t-test (females) or unpaired t-test with Welch’s correction (males). Oct4+/+ (n = 8 males; 11 females) and Oct4+/+ (n = 8 males; 11 females) mice after 10 weeks of WD feeding. (G) Graphical representation of the Seahorse XF24 Cell Mito Stress Test assays measuring the oxygen consumption rates (OCR) in OCT4WT and OCT4ex1_KO HUVECs with arrows indicating treatments with specific stressors: oligomycin, carbonyl cyanite-4 (trifluoromethoxy) phenylhydrazone (FCCP), and Rotenone/Antimycin A. (H) Quantification of OCR in OCT4WT and OCT4ex1_KO HUVECs revealed a significant difference in basal mitochondrial respiration, maximum respiration, spare respiratory capacity (SRC), and ATP production. Values = mean ± S.E.M.; *P < 0.05 by two-way ANOVA, n = 3 independent experiments.
Figure 5
Figure 5
Abcg2 is a direct target of OCT4 and is associated with EC phenotypic transitions in human and mouse atherosclerotic arteries. (A) Comparing in vivo aortic and lung scRNA-seq data sets with the oPPOSUM 3.0 database revealed Abcg2 and Manf1 as putative targets of OCT4. (B) ChIP analysis on cultured mouse aortic wild-type EC with or without cholesterol loading using antibodies specific for OCT4 compared with non-immune IgG (red line). Values = mean ± S.E.M.; data were analysed by unpaired t-test, n = 2 representative experiments; *P < 0.05. NC—results for the negative control loci primer set. (C) A feature plot of Abcg2 gene distribution within the scRNA-seq t-SNE map. (D) The expression level of Abcg2 in different cellular states, which has been identified by the pseudotime analysis. The red rectangle indicates State 2, unique for Oct4Δ/Δ cells, with low Abcg2 expression levels. Dots represent individual cells at each time point. The curve line represents the average of Abcg2 expression between all cells at each time point. (E) Immunostaining of YFP, ABCG2, ACTA2, and DAPI on representative BCA sections collected from 4 weeks WD-fed Oct4Δ/Δ and Oct4+/+ male mice. Scale bar = 10 µm. (F) Quantification of the percentage of YFP+ABCG2+ cells within total YFP+ cells. Values = mean ± S.E.M.. Data were analysed by non-parametric Mann–Whitney test, *P < 0.05 Oct4+/+ (n = 7) vs. Oct4Δ/Δ (n = 8) mice. (G and H) Publicly available scRNAseq data on unsorted cells from atherosclerotic human coronary arteries (Wirka et al., 2019) were reanalysed to trace ABCG2 expression in EC. (G) Uniform manifold approximation and projection (UMAP) visualization of cells present in human atherosclerotic arteries, showing enrichment of ABCG2 expression specifically in EC based on EC genes CDH5 and PECAM1. (H) Pairwise Pearson correlation of ABCG2 with all other genes in cells extracted from the CDH5+PECAM1+ EC cluster. Examples of the top highly correlated and anti-correlated genes and molecular pathways are indicated on the graph.
Figure 6
Figure 6
Inhibition of intracellular ROS rescues mitochondrial respiration and EndoMT in the OCT4-deficient ECs. (A) Representative western blot showing protein levels of ABCG2 and GAPDH in OCT4WT and OCT4ex1_KO HUVECs. Replicates correspond to independent experiments. The relative ABCG2/GAPDH ratio based on the densitometry analysis is indicated beneath the blots. (B) Quantification of extracellular haem concentrations in OCT4WT and OCT4ex1_KO HUVEC cultured media. Values = mean ± S.E.M.; *P < 0.05 by unpaired t-test; n = 3 independent experiments. (C and D) Loss of OCT4 increased ROS generation within HUVEC in response to hemin chloride treatment. (C) Schematic showing the experimental design for the loss-of-function assay of ABCG2 after treatment with succinylacetone (endogenous inhibitor of haem synthesis) followed by FTC (specific ABCG2 inhibitor) to inhibit ABCG2 in OCT4WT HUVECs and subsequent intracellular ROS estimation in OCT4WT, OCT4ex1_KO, and OCT4WT+FTC HUVECs. (D) Hemin chloride-induced ROS generation was then measured by DCF intensity and showed dose–response with increasing hemin chloride concentration. OCT4WT+FTC group recapitulated the OCT4ex1_KO phenotype in the presence of increasing hemin chloride. Values = mean ± S.E.M; Data were analysed by linear mixed-model ANOVA followed by Tukey’s post hoc test, *P < 0.05, **P < 0.01, and ***P < 0.001; n = 3 independent experiments. (E) Seahorse mitochondrial stress test measuring the oxygen consumption rates (OCR) in OCT4WT, OCT4ex1_KO HUVECs, and OCT4ex1_KO HUVECs cultured in the presence of the ROS inhibitor, N-acetyl-l-cysteine (NAC). NAC significantly improved basal mitochondrial respiration, spare respiratory capacity, and ATP production in OCT4ex1_KO HUVECs. Error bars represent mean ± S.E.M.*P < 0.05, **P < 0.01 by linear mixed-model ANOVA followed by Tukey’s post hoc test, n = 3 independent experiments. Results for OCT4WTand OCT4ex1_KO HUVECs are the same as in Figure 4H. (F) Schematic showing experimental design for in vitro EndoMT experiments. (G and H) qRT–PCR analyses demonstrated that EC transfected with blocking siOct4 have lower Oct4 and Pecam1 levels (G) but higher levels of the EndoMT markers and Nfkb mRNA gene expression (H) in response to TGFβ1 treatment as compared with siNT control cells. The presence of NAC significantly improved TGFb1-induced gene expression alterations. Data were analysed by one-way ordinary ANOVA (mixed-model), followed by Tukey’s multiple comparisons test (*P < 0.05, **P < 0.01, ***P < 0.001, and #P = 0.07). Values = mean ± S.E.M; n = 3 independent experiments.
Figure 7
Figure 7
Overexpression of ABCG2 improves ROS accumulation and mitochondrial functions in OCT4-deficient ECs. (A) Schematic showing experimental design for the overexpression of ABCG2 in OCT4WT and OCT4ex1_KO HUVECs. Cells were infected with human ABCG2 overexpressing adenovirus containing His-Tag (Adv-ABCG2) or control adenovirus (Adv-GFP) for 24 h, followed by functional assays. (B) Representative western blot showing protein levels of His-tag and GAPDH in Adv-ABCG2-infected OCT4WT and OCT4ex1_KO HUVECs. The relative His-tag/GAPDH ratio based on the densitometry analysis is indicated beneath the blots. (C) qRT–PCR analysis showed significant increases in mRNA levels for ABCG2 in OCT4WT and OCT4ex1_KO HUVECs infected with Adv-ABCG2 as compared with Adv-GFP. *P < 0.05 by unpaired Student t-test; n = 3 independent experiments. (DF) Quantification of extracellular haem concentrations in cultured media (D), intracellular ROS accumulation (E), and mitochondria membrane potential (F) in OCT4WT and OCT4ex1_KO HUVECs with and without ABCG2 overexpression. (G) Representative immunofluorescence staining using MitoSpy to visualize mitochondria morphology. Scale bar = 20 µm. (H) Quantification of the mitochondria fragmentation count based on the fragmentation score system. (DF, H) Values = mean ± S.E.M.; *P < 0.05 by one-way ANOVA followed by Tukey’s post hoc test; n = 3 independent experiments. (I) Proposed model of the atheroprotective role of OCT4 in ECs: Activation of the pluripotency factor OCT4 in ECs at the early stages of atherosclerosis development results in up-regulating ABCG2 that in turn plays a role in regulating haem and ROS levels inside of cells and leads to atheroprotection. Loss of OCT4 results in haem and ROS accumulation leading to inflammation, EndoMT, pathological angiogenesis, and mitochondrial dysfunction and promoting atherosclerosis progression.

Similar articles

Cited by

References

    1. Benjamin EJ, Muntner P, Alonso A, Bittencourt MS, Callaway CW, Carson AP, Chamberlain AM, Chang AR, Cheng S, Das SR, Delling FN, Djousse L, Elkind MSV, Ferguson JF, Fornage M, Jordan LC, Khan SS, Kissela BM, Knutson KL, Kwan TW, Lackland DT, Lewis TT, Lichtman JH, Longenecker CT, Loop MS, Lutsey PL, Martin SS, Matsushita K, Moran AE, Mussolino ME, O’Flaherty M, Pandey A, Perak AM, Rosamond WD, Roth GA, Sampson UKA, Satou GM, Schroeder EB, Shah SH, Spartano NL, Stokes A, Tirschwell DL, Tsao CW, Turakhia MP, VanWagner LB, Wilkins JT, Wong SS, Virani SS. Heart disease and stroke Statistics—2019 update: a report from the American Heart Association. Circulation 2019:139:e56–e528. - PubMed
    1. Busse R, Fleming I. Vascular endothelium and blood flow. Handb Exp Pharmacol 2006:43–78. - PubMed
    1. Gimbrone MA, Garcia-Cardena G. Endothelial cell dysfunction and the pathobiology of atherosclerosis. Circ Res 2016;118:620–636. - PMC - PubMed
    1. Chen PY, Qin L, Barnes C, Charisse K, Yi T, Zhang X, Ali R, Medina PP, Yu J, Slack FJ, Anderson DG, Kotelianski V, Wang F, Tellides G, Simons M. FGF regulates TGF-beta signaling and endothelial-to-mesenchymal transition via control of let-7 miRNA expression. Cell Rep 2012;2:1684–1696. - PMC - PubMed
    1. Chen PY, Qin L, Baeyens N, Li G, Afolabi T, Budatha M, Tellides G, Schwartz MA, Simons M. Endothelial-to-mesenchymal transition drives atherosclerosis progression. J Clin Invest 2015;125:4514–4528. - PMC - PubMed

Publication types

MeSH terms