Preclinical Modeling of Leiomyosarcoma Identifies Susceptibility to Transcriptional CDK Inhibitors through Antagonism of E2F-Driven Oncogenic Gene Expression
- PMID: 35325095
- PMCID: PMC9167705
- DOI: 10.1158/1078-0432.CCR-21-3523
Preclinical Modeling of Leiomyosarcoma Identifies Susceptibility to Transcriptional CDK Inhibitors through Antagonism of E2F-Driven Oncogenic Gene Expression
Abstract
Purpose: Leiomyosarcoma (LMS) is a neoplasm characterized by smooth muscle differentiation, complex copy-number alterations, tumor suppressor loss, and the absence of recurrent driver mutations. Clinical management for advanced disease relies on the use of empiric cytotoxic chemotherapy with limited activity, and novel targeted therapies supported by preclinical research on LMS biology are urgently needed. A lack of fidelity of established LMS cell lines to their mesenchymal neoplasm of origin has limited translational understanding of this disease, and few other preclinical models have been established. Here, we characterize patient-derived xenograft (PDX) models of LMS, assessing fidelity to their tumors of origin and performing preclinical evaluation of candidate therapies.
Experimental design: We implanted 49 LMS surgical samples into immunocompromised mice. Engrafting tumors were characterized by histology, targeted next-generation sequencing, RNA sequencing, and ultra-low passage whole-genome sequencing. Candidate therapies were selected based on prior evidence of pathway activation or high-throughput dynamic BH3 profiling.
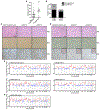
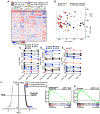
Results: We show that LMS PDX maintain the histologic appearance, copy-number alterations, and transcriptional program of their parental tumors across multiple xenograft passages. Transcriptionally, LMS PDX cocluster with paired LMS patient-derived samples and differ primarily in host-related immunologic and microenvironment signatures. We identify susceptibility of LMS PDX to transcriptional cyclin-dependent kinase (CDK) inhibition, which disrupts an E2F-driven oncogenic transcriptional program and inhibits tumor growth.
Conclusions: Our results establish LMS PDX as valuable preclinical models and identify strategies to discover novel vulnerabilities in this disease. These data support the clinical assessment of transcriptional CDK inhibitors as a therapeutic strategy for patients with LMS.
©2022 American Association for Cancer Research.
Figures


Similar articles
-
Establishment and characterization of uterine sarcoma and carcinosarcoma patient-derived xenograft models.Gynecol Oncol. 2017 Sep;146(3):538-545. doi: 10.1016/j.ygyno.2017.06.005. Epub 2017 Jun 16. Gynecol Oncol. 2017. PMID: 28625393
-
Oncogenic Gene-Expression Programs in Leiomyosarcoma and Characterization of Conventional, Inflammatory, and Uterogenic Subtypes.Mol Cancer Res. 2020 Sep;18(9):1302-1314. doi: 10.1158/1541-7786.MCR-20-0197. Epub 2020 Jun 9. Mol Cancer Res. 2020. PMID: 32518213 Free PMC article.
-
Establishment and characterization of patient-derived xenograft and its cell line of primary leiomyosarcoma of bone.In Vitro Cell Dev Biol Anim. 2018 Jun;54(6):458-467. doi: 10.1007/s11626-018-0258-2. Epub 2018 May 29. In Vitro Cell Dev Biol Anim. 2018. PMID: 29845452
-
Leiomyosarcomas: whole genome sequencing for a whole biology characterization.Curr Opin Oncol. 2019 Jul;31(4):317-321. doi: 10.1097/CCO.0000000000000550. Curr Opin Oncol. 2019. PMID: 31033567 Review.
-
Targeting the Molecular and Immunologic Features of Leiomyosarcoma.Cancers (Basel). 2023 Mar 31;15(7):2099. doi: 10.3390/cancers15072099. Cancers (Basel). 2023. PMID: 37046760 Free PMC article. Review.
Cited by
-
Preclinical Models of Visceral Sarcomas.Biomolecules. 2023 Nov 6;13(11):1624. doi: 10.3390/biom13111624. Biomolecules. 2023. PMID: 38002306 Free PMC article. Review.
-
Hyper-Dependence on NHEJ Enables Synergy between DNA-PK Inhibitors and Low-Dose Doxorubicin in Leiomyosarcoma.Clin Cancer Res. 2023 Dec 15;29(24):5128-5139. doi: 10.1158/1078-0432.CCR-23-0998. Clin Cancer Res. 2023. PMID: 37773632 Free PMC article.
-
PDX models for functional precision oncology and discovery science.Nat Rev Cancer. 2025 Mar;25(3):153-166. doi: 10.1038/s41568-024-00779-3. Epub 2024 Dec 16. Nat Rev Cancer. 2025. PMID: 39681638 Free PMC article. Review.
-
The Role of CDK Pathway Dysregulation and Its Therapeutic Potential in Soft Tissue Sarcoma.Cancers (Basel). 2022 Jul 12;14(14):3380. doi: 10.3390/cancers14143380. Cancers (Basel). 2022. PMID: 35884441 Free PMC article. Review.
-
Patient-derived xenograft models in cancer therapy: technologies and applications.Signal Transduct Target Ther. 2023 Apr 12;8(1):160. doi: 10.1038/s41392-023-01419-2. Signal Transduct Target Ther. 2023. PMID: 37045827 Free PMC article. Review.
References
Publication types
MeSH terms
Grants and funding
LinkOut - more resources
Full Text Sources
Other Literature Sources

