. 2022 Aug 1;28(8):1143-1150.
doi: 10.1093/ibd/izac046.

Mechanoscopy: A Novel Device and Procedure for in vivo Detection of Chronic Colitis in Mice

Affiliations

Mechanoscopy: A Novel Device and Procedure for in vivo Detection of Chronic Colitis in Mice

Shijie He et al. Inflamm Bowel Dis. .

Abstract

Background: Gut stiffening caused by fibrosis plays a critical role in the progression of inflammatory bowel disease (IBD) and colon cancer. Previous studies have characterized the biomechanical response of healthy and pathological gut, with most measurements obtained ex vivo.

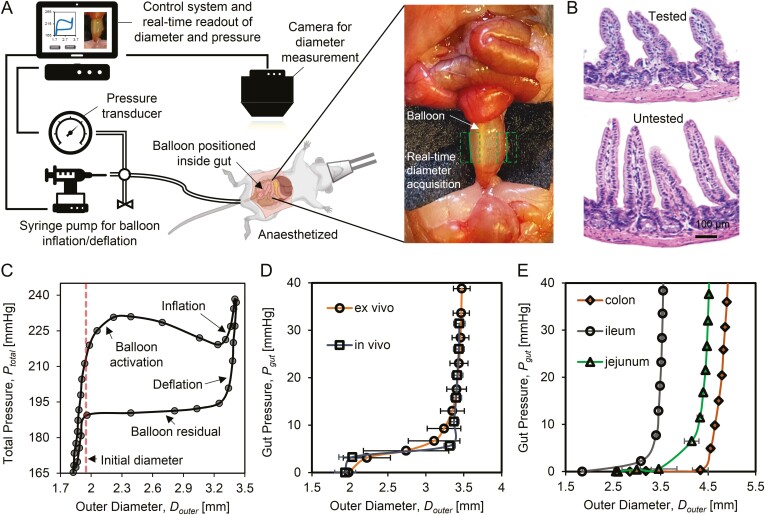
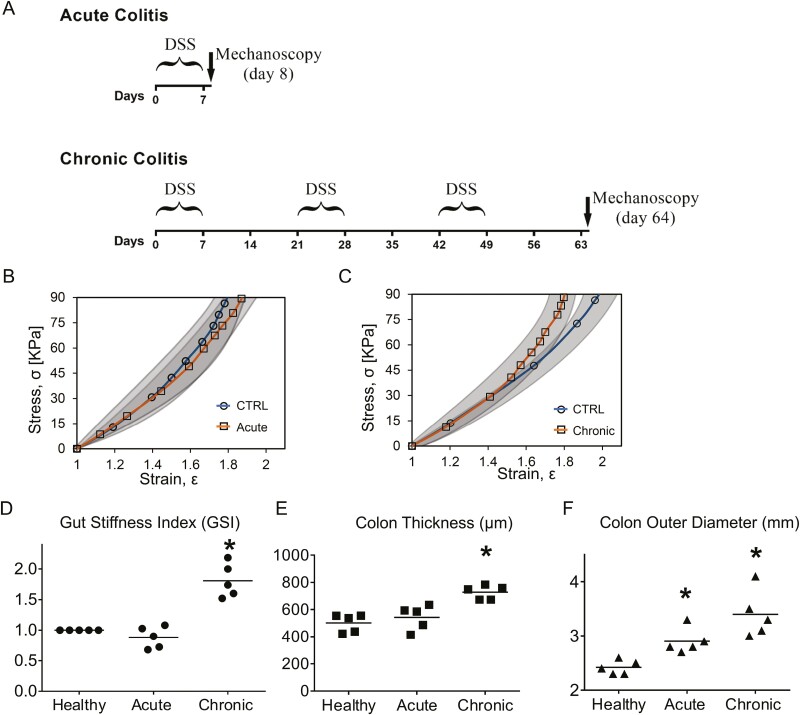
Methods: Here, we developed a device and accompanying procedure for in vivo quantification of gut stiffness, termed mechanoscopy. Mechanoscopy includes a flexible balloon catheter, pressure sensor, syringe pump, and control system. The control system activates the balloon catheter and performs automated measurements of the gut stress-strain biomechanical response.

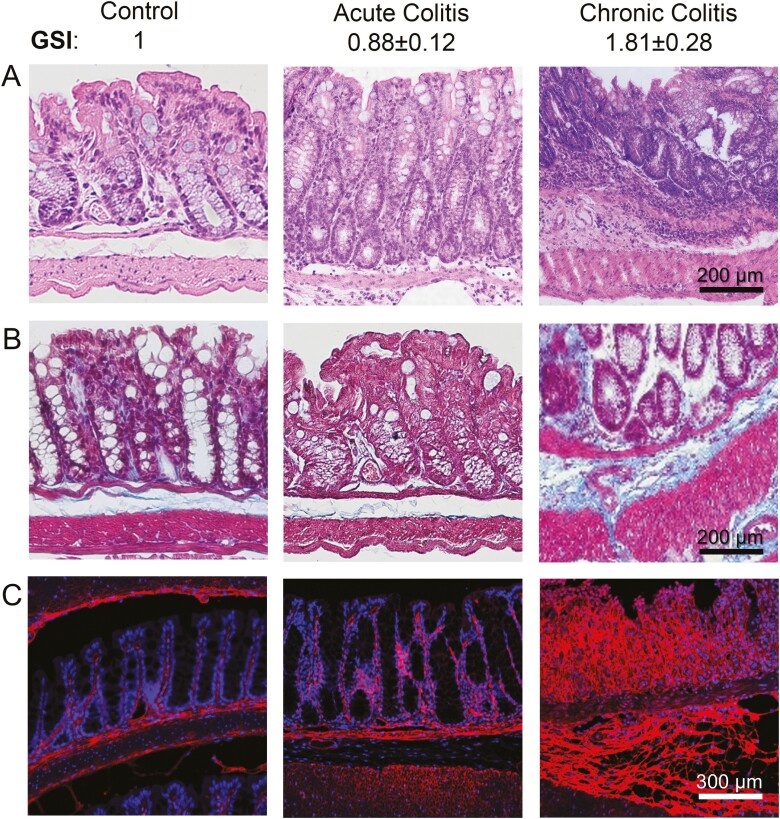
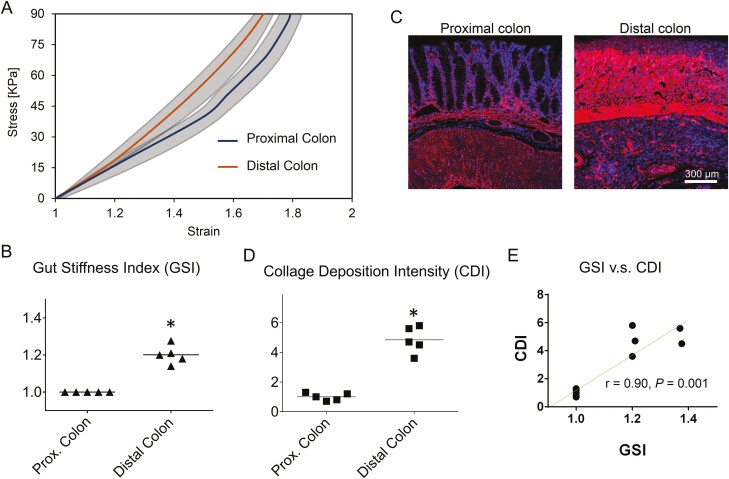
Results: A gut stiffness index (GSI) is identified based on the slope of the obtained stress-strain response. Using a colitis mouse model, we demonstrated that GSI positively correlates with the extent of gut fibrosis, the severity of mucosal damage, and the infiltration of immune cells. Furthermore, a critical strain value is suggested, and GSI efficiently detects pathological gut fibrotic stiffening when the strain exceeds this value.

Conclusions: Based on these results, we envision that mechanoscopy and GSI will facilitate the clinical diagnosis of IBD.

Keywords: gut fibrosis; gut inflammation; tissue stiffness.

Plain language summary

Here, we present a novel procedure/device, termed mechanoscopy, which we have demonstrated to accurately detect and differentiate between fibrosis and inflammation in rodent models of colitis. Thus, mechanoscopy offers a translationally relevant approach for ultrasensitive and minimally invasive IBD diagnosis.


Figures

Figure 1.
Figure 1.
Schematic of real-time gut diameter and stiffness measurement using mechanoscope. A, The mechanoscope includes control system, pressure transducer, balloon catheter, syringe pump for the balloon inflation/deflation, and gut diameter measurement camera. The control system coordinates the pressure transducer and gut diameter measurement camera to automatically record real-time pressure and diameter. The gut diameter measurement module is integrated into the control system, which identifies the gut (green dashed box) and detects the gut edges (green solid line). B, H&E staining shows that during testing, no damage of mucosa and muscle layer occurs in tested samples compared with an adjacent untested section of ileum. C, In testing cycles the gut outer diameter, Douter is recorded in correspondence with total pressure, Ptotal. A test cycle includes 4 phases, balloon activation, inflation, deflation, and balloon residual. The initial diameter (red dashed line) marks the gut diameter at rest prior to testing. D, Gut pressure (Pgut) is calculated after removing balloon residual from Ptotal. No significant differences are detected for Pgut-Douter tissue response under in vivo and ex vivo testing conditions. E, Pgut as a function of Douter are measured from different gut segmentations, jejunum, ileum, and colon samples.
Figure 2.
Figure 2.
Gut diameter and gut stiffness index (GSI) for potential inflammation diagnosis. A, Illustration for the acute colitis model and the chronic colitis model. B, The stress-strain responses acquired from the deflation phase of colon show no significant difference between healthy group and acute colitis group. Gray areas show standard deviation. C, Beyond the critical strain at a level of 1.5, chronic colitis group shows significant colon stiffening compared with the healthy group. D, GSI is defined as the local slope of stress-strain curve at ε = 1.6 and normalized with respect to the healthy group. Gut stiffness index shows slight decreases for the acute group, but not significant decreases. However, GSI significantly increases about 1.8 times for chronic group. E, Compared with the healthy group, the chronic colitis colon significantly thickened 42%. F, Compared with the healthy group, the gut initial outer diameters increase significantly for both the acute and chronic groups. The chronic colitis group shows a greater increase (n = 5, V.S. healthy group, P < .05, Student t test).
Figure 3.
Figure 3.
Gut stiffness index predicts the mouse colon fibrosis in chronic colitis. A, H&E staining, (B) Masson trichrome staining, and (C) collagen IV immunofluorescent staining from the healthy group, acute colitis group, and chronic colitis group, respectively. Compared with the healthy group and the acute colitis group, the GSI score is greater in the chronic colitis group. Correspondingly, the epithelial deterioration, collagen deposition, and tissue thickening are most severe in the chronic colitis group (n = 5).
Figure 4.
Figure 4.
Gut stiffness index is positively correlated with the fibrosis score (FS) and collagen IV deposition intensity (CDI) in the chronic colitis colon. Quantification of FS (A) and CDI (B), correlation coefficients for GSI vs FS (C) and GSI vs CDI (D) of acute colitis colon, correlation coefficients for GSI vs FS (E) and GSI vs CDI (F) of chronic colitis colon. Correlation coefficient “1” suggests perfect positive correlation; “0” for no correlation; and “−1” for perfect negative correlation (n = 5, V.S. healthy group, P < .05, Student t test).
Figure 5.
Figure 5.
Gut stiffness index predicts the region-dependent fibrosis and severity of chronic colitis in mouse colon. A, The stress-strain responses showed that the stiffening of the colon was more severe in the distal region than in the proximal region. Gray areas show standard deviation. Gut stiffness index based on the slope of the stress-strain curves at ε=1.6 is normalized with respect to the proximal group. B, The GSI is increased by 19% in the distal colon compared with the proximal colon. C, The IF staining of collagen IV showed more excessive collagen deposition and more severe damage of the colon mucosa in the distal colon. D, The normalized CDI was greater in distal colon compared with the proximal colon. E, The correlation coefficient of GSI vs CDI across the proximal colon and the distal colon is 0.90 (n = 5, V.S. healthy group, P < .05, Student t test).

References

    1. Stewart DC, Berrie D, Li J, et al.Quantitative assessment of intestinal stiffness and associations with fibrosis in human inflammatory bowel disease. PLoS One. 2018;13(7):e02003771–e02003716. - PMC - PubMed
    1. Zhao J, Liao D, Wilkens R, Krogh K, Glerup H, Gregersen H. Bowel stiffness associated with histopathologic scoring of stenosis in patients with Crohn’s disease. Acta Biomater. 2021;130:332–342. - PubMed
    1. Venu VKP, Alston L, Iftinca M, et al.Nr4A1 modulates inflammation-associated intestinal fibrosis and dampens fibrogenic signaling in myofibroblasts. 2021;321(3):G297–G297. - PubMed
    1. Johnson LA, Rodansky ES, Sauder KL, et al.Matrix stiffness corresponding to strictured bowel induces a fibrogenic response in human colonic fibroblasts. Inflamm Bowel Dis. 2013;19(5):891–903. - PMC - PubMed
    1. Gabbiadini R, Zacharopoulou E, Furfaro F, et al.Application of ultrasound elastography for assessing intestinal fibrosis in inflammatory bowel disease: fiction or reality? Curr Drug Targets. 2021;22(3):347–355. - PubMed

Publication types

Substances