. 2022 Apr 22;50(7):4113-4126.
doi: 10.1093/nar/gkac171.

Genetic code degeneracy is established by the decoding center of the ribosome

Affiliations

Genetic code degeneracy is established by the decoding center of the ribosome

Shixin Ye et al. Nucleic Acids Res. .

Abstract

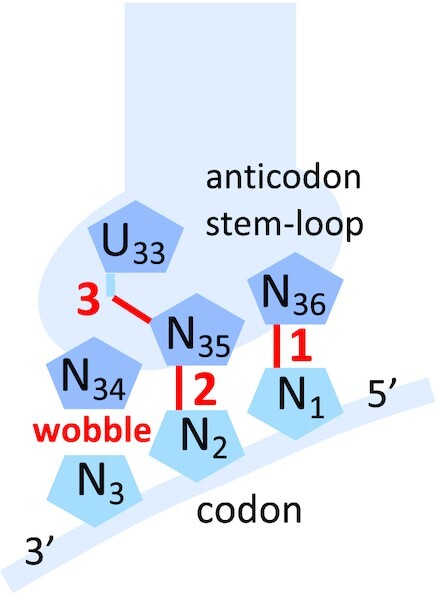
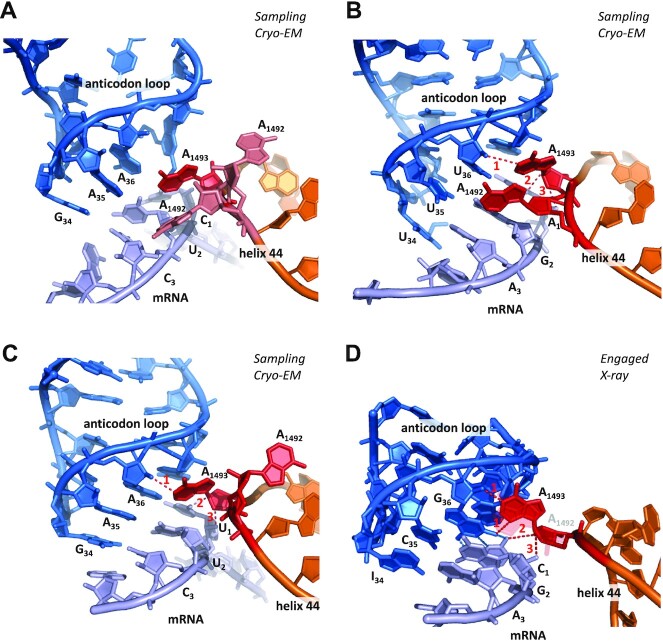
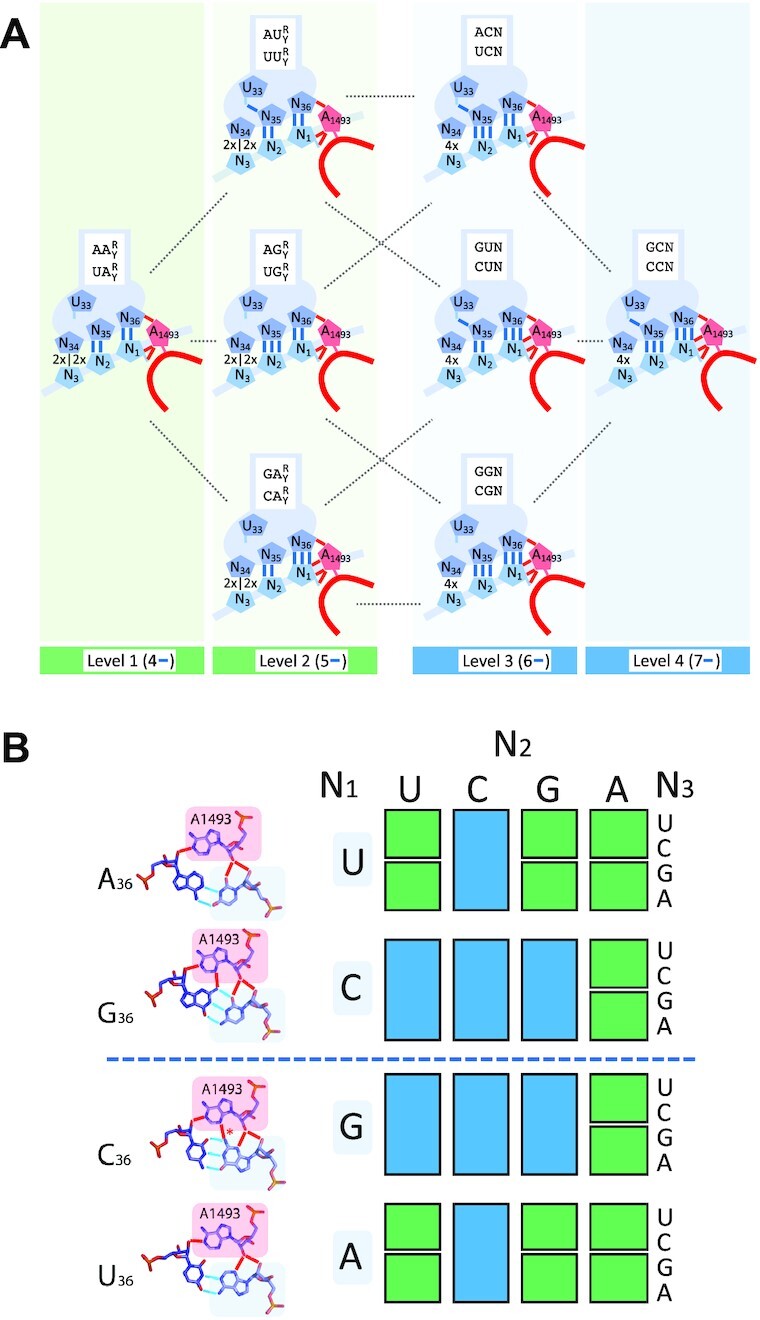
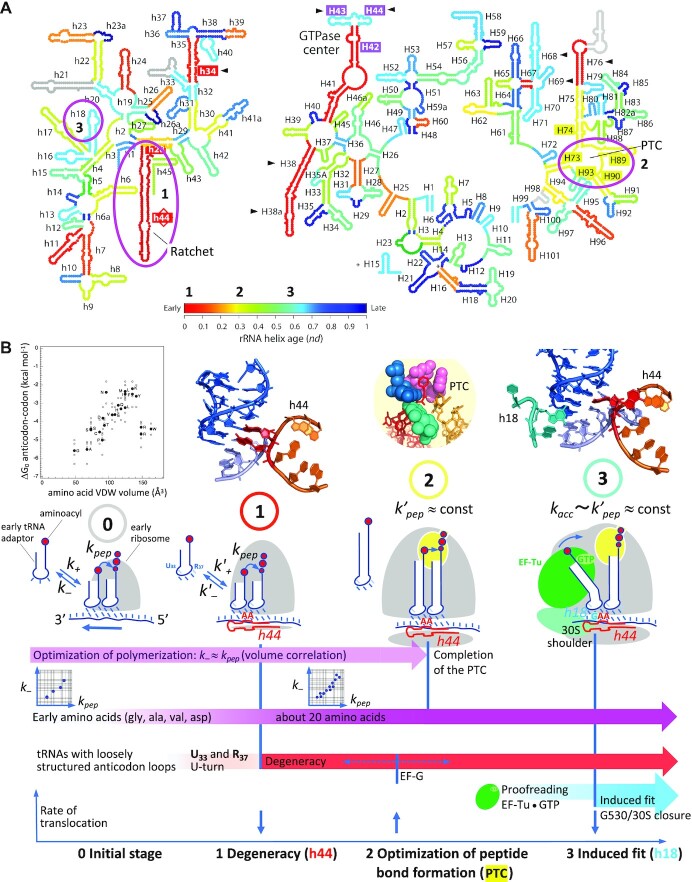
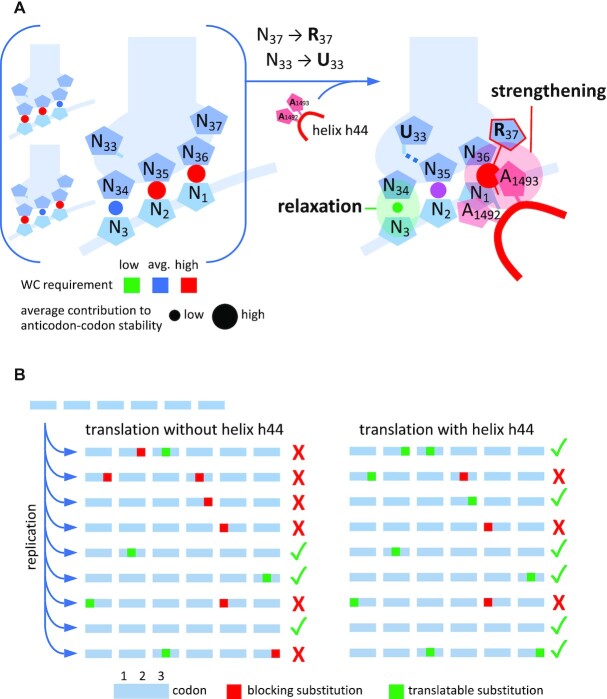
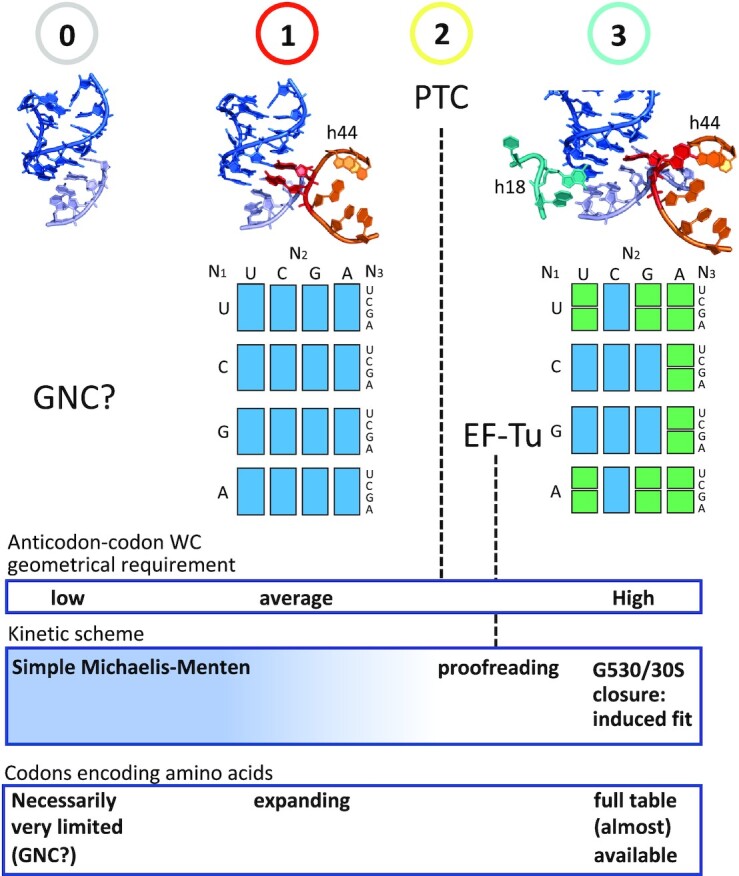
The degeneracy of the genetic code confers a wide array of properties to coding sequences. Yet, its origin is still unclear. A structural analysis has shown that the stability of the Watson-Crick base pair at the second position of the anticodon-codon interaction is a critical parameter controlling the extent of non-specific pairings accepted at the third position by the ribosome, a flexibility at the root of degeneracy. Based on recent cryo-EM analyses, the present work shows that residue A1493 of the decoding center provides a significant contribution to the stability of this base pair, revealing that the ribosome is directly involved in the establishment of degeneracy. Building on existing evolutionary models, we show the evidence that the early appearance of A1493 and A1492 established the basis of degeneracy when an elementary kinetic scheme of translation was prevailing. Logical considerations on the expansion of this kinetic scheme indicate that the acquisition of the peptidyl transferase center was the next major evolutionary step, while the induced-fit mechanism, that enables a sharp selection of the tRNAs, necessarily arose later when G530 was acquired by the decoding center.


Figures

Figure 1.
Figure 1.
Anticodon–codon interaction and structural interpretation of the three parameters of Lagerkvist (in red). See text for explanations.
Figure 2.
Figure 2.
Cryo-EM (AC) and X-ray (D) structures of anticodon–mRNA complex within the decoding center of the ribosome (for clarity, G530 and helix h18 are not shown). (A) Non-cognate interaction, with AC mismatch at the first position in the state of tRNA sampling (pdb 5wfk, (18)). Although A1493 is ON, no hydrogen bond with the minor groove can occur. CryoEM resolution is 3.4 Å. (B) Non-cognate interaction, with GU mismatch at the second position in the state of tRNA sampling (pdb 5uyp, (15)). A1493 binds to the minor groove. Hydrogen bond D-A lengths are 1: 3.6 Å; 2: 3.0 Å; 3: 4.5 Å (avg.: 3.7 Å). CryoEM resolution is 3.9 Å. (C) Cognate interaction in the state of tRNA sampling (pdb 5uyl, (15)). A1493 binds to the minor groove. Hydrogen bond D-A lengths are 1: 3.0 Å; 2: 3.1 Å; 3: 3.8 Å (avg.: 3.3 Å). CryoEM resolution is 3.6 Å. (D) X-ray structure of a cognate interaction (pdb 1xnq, Murphy and Ramakrishnan 2004) illustrating an A minor interaction with a GC base pair at the first position. Hydrogen bond D-A lengths are 1: 2.6 Å; 1’: 2.9 Å; 2: 3.3 Å; 3: 2.5 Å (avg.: 2.8 Å). Compared to pdb 5uyl, examination of the 5uym pdb structure suggests that the shorter length of these bonds results from A1493 and A1492 being both bound to the anticodon–codon complex. X-ray resolution is 3.05 Å. In order to highlight hydrogen bonds, the angle of view was tilted compared to the other structures, and A1492 is semi-transparent. Overall, A1492 is found about 50% of the time in the ‘ON’ state during tRNA sampling (18). Specific densities of A1492 are such that it is 50% ON/50% OFF in the 5wfk structure (light pink), ON in the 5uyp structure (red) and OFF in the 5uyl structure (red).
Figure 3.
Figure 3.
Relation between hydrogen bonding patterns involved in the stability of the WC geometry of N35-N2 and degeneracy. (A) Levels of stability of the WC geometry of the N35-N2 base pair during tRNA sampling, as determined by hydrogen bonds associated with Lagerkvist’s parameters (in blue) and residue A1493 (in red). Levels 1 and 2 specify contiguous two-fold degenerate codon families (ending with either R or Y, depicted as 2x|2x at the wobble position), while levels 3 and 4 specify four-fold degenerate codon families (ending with N, depicted as 4x at the wobble position). Corresponding codon families are shown in white boxes. R = purine, Y = pyrimidine, N = any of the four bases. (B) Yeast or human mitochondrial genetic code table highlighting the two families of degeneracy (same color code as in A). Amino acids are not specified to point out that they are not primarily involved in the determination of these families. The A minor interaction between A1493 and N36-N1 is shown on the left. All shown hydrogen bonding patterns were found in experimental structures (see Figure 2), except that of C36-G1-A1493, for which no structure could be identified in the pdb database. In that case, the only hypothetical hydrogen bond, highlighted with an asterisk*, is expected to occur similarly as for the G36-C1-A1493 configuration due to the position of the G1/36(C1-NH2) amino group at the center of the base pair.
Figure 4.
Figure 4.
Evolution of rRNA structures in the model of Harish and Caetano-Anollés and evolution of decoding in translation based on the analysis of degeneracy. (A) rRNA evolution. Three specific helices (or groups of helices) involved in transitions in the evolutionary model of decoding are highlighted. Adapted from Harish and Caetano-Anollés (19). (B) Evolutionary model of decoding on the ribosome. From the origin until the advent of the PTC, a Michaelis–Menten type of kinetic inferred from the volume correlation (11) governs the rate of translation, with tRNA association (k+) and dissociation (k-) rate constants, and a kinetic constant of peptide bond formation (kpep), sometimes called kcat in earlier works (11,31,32). The advent of U33 and R37, as well as helix h44 (A1493 and A1492) modulated these kinetic constants (k'+, k'-). The step of tRNA accommodation, that appeared concomitantly with EF-Tu, is characterized by an approximately uniform kinetic constant kacc. Relevant features are shown above each evolutionary stage: (0) Volume correlation. The anticodon–codon ΔG0s are assumed to relate to dissociation rate constants k-s through k- ∼ exp (ΔG0) (11), while data on intramolecular reactions suggest a similar exponential dependence between kpep and van der Waals volume (33,34), with some apparent exceptions (asn, arg, trp). (1) Decoding center with h44 only. (2) Peptidyl transferase center (PTC). (3) Whole decoding center with helix h18. See text for additional explanations. Note that all three considered transitions highlighted in A and B concur, although these two models were established essentially independently.
Figure 5.
Figure 5.
Evolutionary transition 1: from early tRNA anticodon loops and no decoding center to U33 and R37 -shaped anticodon loops and helix h44 on the ribosome (A1493 and A1492). (A) Left: initial loop of tRNA adapter, with little structuration, bound to a codon in an absence of decoding center. Although the shape of the loop might provide a high flexibility to the base pair at the third position, single GU wobble base pairs may also occur in pos. 2 or 1 (background) while still providing enough stability to ensure peptide bond formation in the early translation mechanism. Right: the advent of R37 and helix h44 strengthened the anticodon–codon interaction at the first position, while the U-turn (U33) helped relax base pairing specificity at the third position. R37 stacking on N36-N1 is schematized with a thin red line. (B) Translation of early coding sequences: suggested improved processivity resulting from transition 1. Because the early replication mechanism is inaccurate, RNA sequences accumulate mutations, and thus may not always be fully translated due to reduced sets of tRNAs (left). The advent of h44 together with anticodon loop structuration (see A) provided an improved processivity during translation by lowering base pairing requirement at the third position (right).
Figure 6.
Figure 6.
Anticodon–codon interaction and codon degeneracy in the genetic code during ribosome evolution. From an early hypothetical structure with no decoding center (initial state, 0), in which the properties of a GNC code may have provided a required stability to an early translation system (42,44), evolutionary models and the dynamics of the decoding center suggest that helix h44 with A1493 and A1492 appeared first (transition 1), which enabled an extended degeneracy at the third position (blue boxes). The completion of the PTC (transition 2) and the appearance of EF-Tu (proofreading) necessarily occurred before a controlled hydrolysis on EF-Tu by the decoding center through G530 and 30S closure (transition 3), which gave rise to modern degeneracy. Inferred kinetic scheme and codons occurring from stage 0 to transition 3 are indicated at the bottom.

Similar articles

Cited by

References

    1. Nirenberg M. Historical review: deciphering the genetic code–a personal account. Trends Biochem. Sci. 2004; 29:46–54. - PubMed
    1. Crick F.H. Codon–anticodon pairing: the wobble hypothesis. J. Mol. Biol. 1966; 19:548–555. - PubMed
    1. Ogle J.M., Brodersen D.E., Clemons W.M.J., Tarry M.J., Carter A.P., Ramakrishnan V.. Recognition of cognate transfer RNA by the 30S ribosomal subunit. Science. 2001; 292:897–902. - PubMed
    1. Ogle J.M., Murphy F.V, Tarry M.J., Ramakrishnan V.. Selection of tRNA by the ribosome requires a transition from an open to a closed form. Cell. 2002; 111:721–732. - PubMed
    1. Ogle J.M., Ramakrishnan V.. Structural insights into translational fidelity. Annu. Rev. Biochem. 2005; 74:129–177. - PubMed