. 2022 May;29(5):409-424.
doi: 10.1089/cmb.2021.0316. Epub 2022 Mar 21.

Integrating Long-Range Regulatory Interactions to Predict Gene Expression Using Graph Convolutional Networks

Affiliations

Integrating Long-Range Regulatory Interactions to Predict Gene Expression Using Graph Convolutional Networks

Jeremy Bigness et al. J Comput Biol. 2022 May.

Abstract

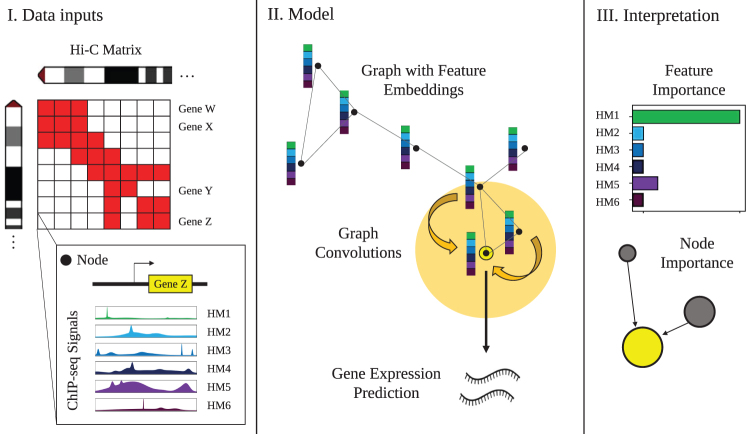
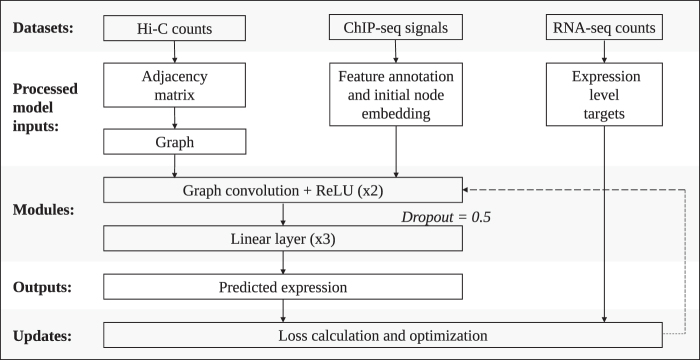
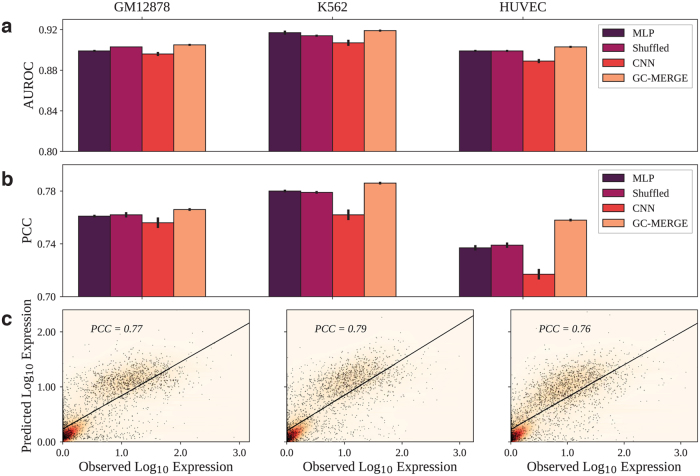
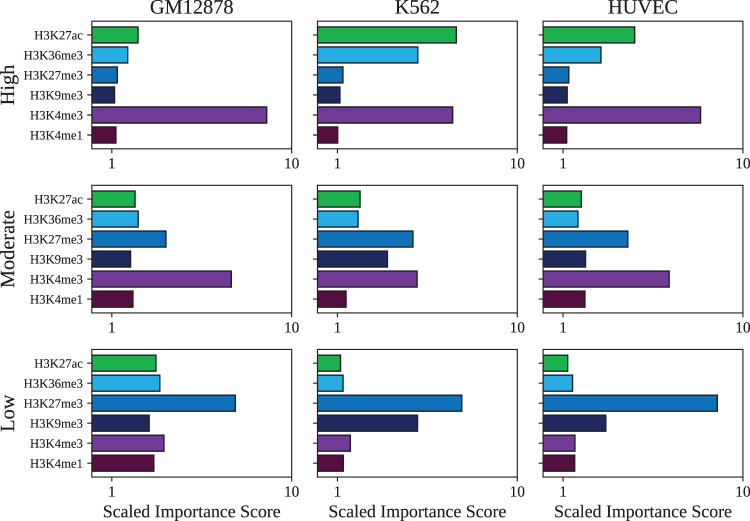
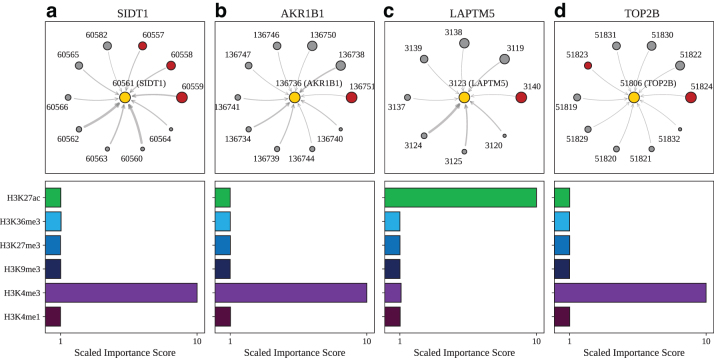
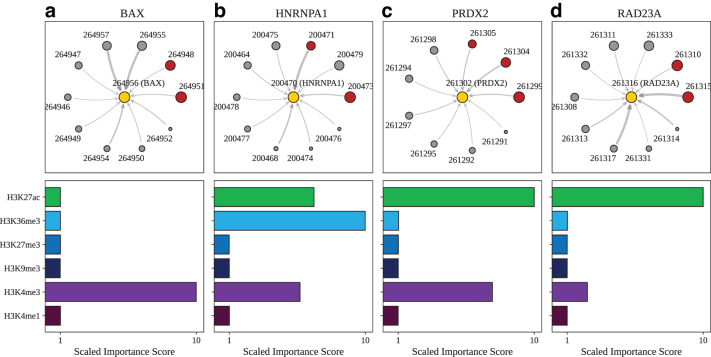
Long-range regulatory interactions among genomic regions are critical for controlling gene expression, and their disruption has been associated with a host of diseases. However, when modeling the effects of regulatory factors, most deep learning models either neglect long-range interactions or fail to capture the inherent 3D structure of the underlying genomic organization. To address these limitations, we present a Graph Convolutional Model for Epigenetic Regulation of Gene Expression (GC-MERGE). Using a graph-based framework, the model incorporates important information about long-range interactions via a natural encoding of genomic spatial interactions into the graph representation. It integrates measurements of both the global genomic organization and the local regulatory factors, specifically histone modifications, to not only predict the expression of a given gene of interest but also quantify the importance of its regulatory factors. We apply GC-MERGE to data sets for three cell lines-GM12878 (lymphoblastoid), K562 (myelogenous leukemia), and HUVEC (human umbilical vein endothelial)-and demonstrate its state-of-the-art predictive performance. Crucially, we show that our model is interpretable in terms of the observed biological regulatory factors, highlighting both the histone modifications and the interacting genomic regions contributing to a gene's predicted expression. We provide model explanations for multiple exemplar genes and validate them with evidence from the literature. Our model presents a novel setup for predicting gene expression by integrating multimodal data sets in a graph convolutional framework. More importantly, it enables interpretation of the biological mechanisms driving the model's predictions.

Keywords: Hi-C; deep learning; gene expression; graph neural networks; histone modifications.


Conflict of interest statement

The authors declare they have no conflicting financial interests.

Figures

FIG. 1.
FIG. 1.
Overview of GC-MERGE. Our framework integrates local HM signals and long-range spatial interactions among genomic regions to predict and understand gene expression. (I) Inputs to the model include Hi-C maps for each chromosome, with the binned chromosomal regions corresponding to nodes in the graph, and the average ChIP-seq readings of six core histone marks in each region, which constitute the initial feature embedding of the nodes. (II) For nodes corresponding to regions containing a gene, the model performs repeated graph convolutions over the neighboring nodes to yield either a binarized class prediction of gene expression activity (either active or inactive) or a continuous, real-valued prediction of expression level. (III) Finally, explanations for the model's predictions for any gene-associated node can be obtained by calculating the importance scores for each of the features and the relative contributions of neighboring nodes. Therefore, the model provides biological insight into the pattern of histone marks and the genomic interactions that work together to predict gene expression. GC-MERGE, Graph Convolutional Model of Epigenetic Regulation of Gene Expression; HM, histone mark.
FIG. 2.
FIG. 2.
Overview of the GCN model architecture. The data sets used in our model are Hi-C maps, ChIP-seq signals, and RNA-seq counts. A binarized adjacency matrix (AN×N) is produced from the Hi-C maps by subsampling from the Hi-C matrix. The nodes v in the graph are annotated with features from the ChIP-seq data sets (xv). Two graph convolutions, each followed by ReLU, are performed. The output from here is fed into a dropout layer (probability = 0.5), followed by a linear module that comprised three dense layers, in which ReLU follows the first two layers. For the classification model, the output is fed through a softmax layer, and then the argmax is taken to make the final prediction (yv). For the regression model, the final output represents the base-10 logarithm of the expression level (with a pseudocount of 1).
FIG. 3.
FIG. 3.
Comparison of AUROC and PCC scores for all models. GC-MERGE gives state-of-the-art performance for both the classification and the regression tasks. For each reported metric, we take the average of 10 runs and denote the standard deviation by the error bars on the graph. (a) For the classification task, the AUROC metrics for GM12878, K562, and HUVEC were 0.91, 0.92, and 0.90, respectively. For each of these cell lines, GC-MERGE improves prediction performance over other baselines. (b) For the regression task, GC-MERGE obtains PCC scores of 0.77, 0.79, and 0.76 for GM12878, K562, and HUVEC, respectively. These scores are better than the respective baselines. (c) Scatter plots of the logarithm of the predicted expression values versus the true expression values are shown for all three cell lines. AUROC, area under the receiver operating characteristic curve; GM12878, lymphoblastoid; HUVEC, human umbilical vein endothelial cell; K562, myelogenous leukemia; PCC, Pearson correlation coefficient.
FIG. 4.
FIG. 4.
Histone mark profiles for subsets of genes expressed at high levels, intermediate levels, and low levels. (a) For GM12878, the average histone mark profile for the top 100 genes by expression level is dominated by H3K4me3 as would be expected for actively transcribed genes. The histone mark profile for genes at intermediate expression value is characterized by high importance scores for H3K4me3 and H3K27me3, which is correlated with a bivalent/poised TSS. Lastly, the histone mark profile for genes with low expression shows that the H3K27me3 signal is most important, which is associated with repression. Similar patterns can be observed for (b) K562 and (c) HUVEC. TSS, transcription start site.
FIG. 5.
FIG. 5.
Model explanations for exemplar genes validated by promoter capture Hi-C. Top: For (a) SIDT1, designated as node 60561 (yellow circle), the subgraph of neighbor nodes is displayed. The size of each neighbor node correlates with its predictive importance as determined by GNNExplainer. Nodes in red denote regions corresponding to known enhancer regions regulating SIDT1 (Jung et al., 2019) (note that multiple interacting fragments can be assigned to each node, see Supplementary Table S3). All other nodes are displayed in gray. The thickness of each edge is inversely correlated with the genomic distance between each neighbor node and the central node, such that thicker edges indicate neighbor nodes that are closer in sequence space to the gene of interest. Nodes with importance scores corresponding to outliers have been removed for clarity. Bottom: The scaled feature importance scores for each of the six core histone marks used in this study are shown in the bar graph. Results also presented for (b) AKR1B1, (c) LAPTM5, and (d) TOP2B.
FIG. 6.
FIG. 6.
Model explanations for exemplar genes validated by CRISPRi-FlowFISH. Top: For (a) BAX, designated as node 264956 (yellow circle), the subgraph of neighbor nodes is displayed. The size of each neighbor node correlates with its predictive importance as determined by GNNExplainer. Nodes in red denote regions corresponding to known enhancer regions regulating BAX (Fulco et al., 2019) (note that multiple interacting fragments can be assigned to each node, see Supplementary Table S3). All other nodes are displayed in gray. The thickness of each edge is inversely correlated with the genomic distance between each neighbor node and the central node, such that thicker edges indicate neighbor nodes that are closer in sequence space to the gene of interest. Nodes with importance scores corresponding to outliers have been removed for clarity. Bottom: The scaled feature importance scores for each of the six core histone marks used in this study are shown in the bar graph. Results also presented for (b) HNRNPA1, (c) PRDX2, and (d) RAD23A.

References

    1. Agarwal, V., and Shendure, J.. 2020. Predicting mRNA abundance directly from genomic sequence using deep convolutional neural networks. Cell Rep. 31, 107663. - PubMed
    1. Avsec, Z., Agarwal, V., Visentin, D., et al. . 2021. Effective gene expression prediction from sequence by integrating long-range interactions. Nat. Methods 18, 1196–1203. - PMC - PubMed
    1. Cheng, C., Yan, K.-K., Yip, K.Y., et al. . 2011. A statistical framework for modeling gene expression using chromatin features and application to modENCODE datasets. Genome Biol. 12, R15. - PMC - PubMed
    1. Dekker, J., and Misteli, T.. 2015. Long-range chromatin interactions. Cold Spring Harb. Perspect. Biol. 7, a019356. - PMC - PubMed
    1. Dong, X., Greven, M.C., Kundaje, A., et al. . 2012. Modeling gene expression using chromatin features in various cellular contexts. Genome Biol. 13, R53. - PMC - PubMed

Publication types

LinkOut - more resources