. 2022 Apr 14;185(8):1414-1430.e19.
doi: 10.1016/j.cell.2022.02.025. Epub 2022 Mar 23.

Facile discovery of surrogate cytokine agonists

Affiliations

Facile discovery of surrogate cytokine agonists

Michelle Yen et al. Cell. .

Abstract

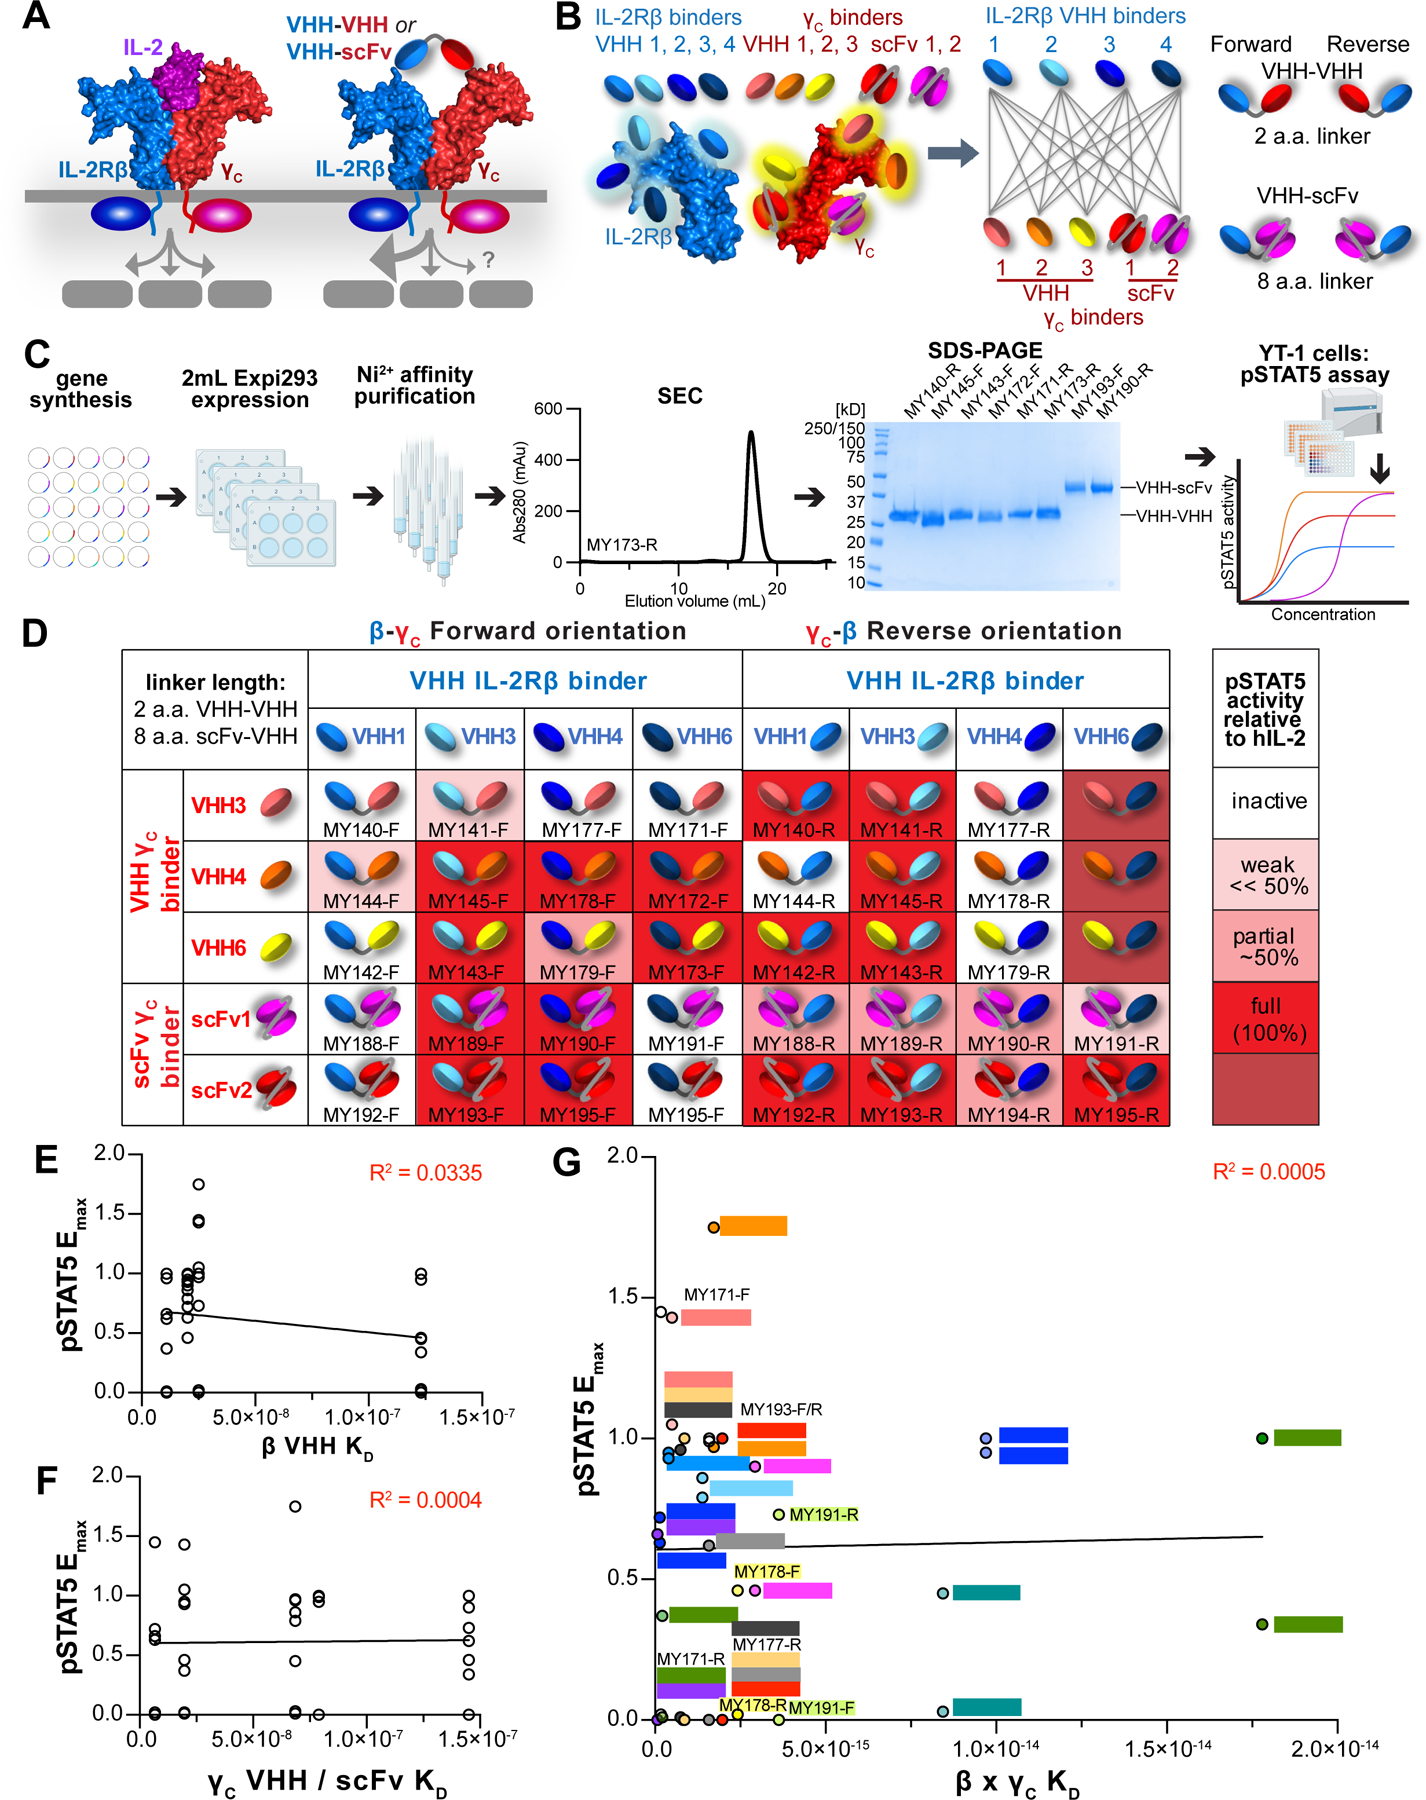
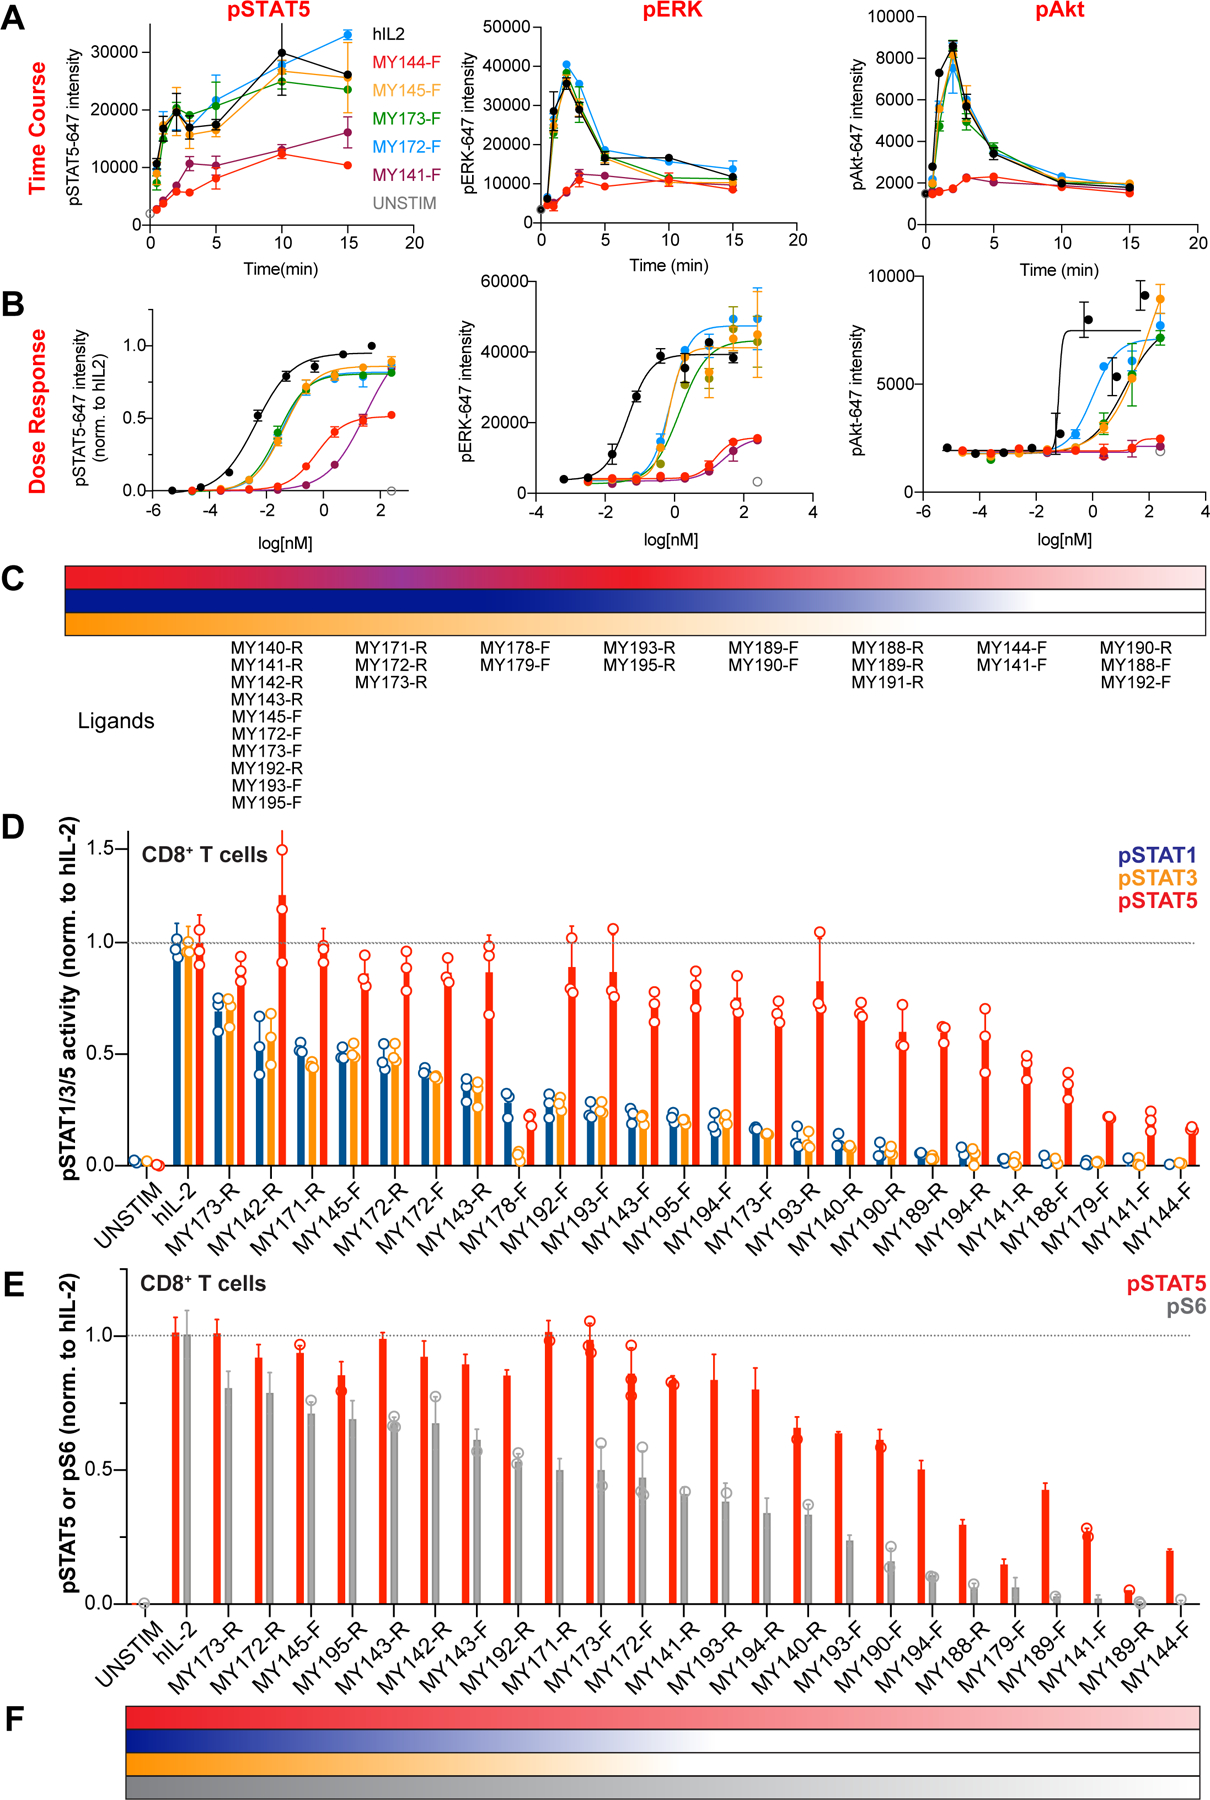
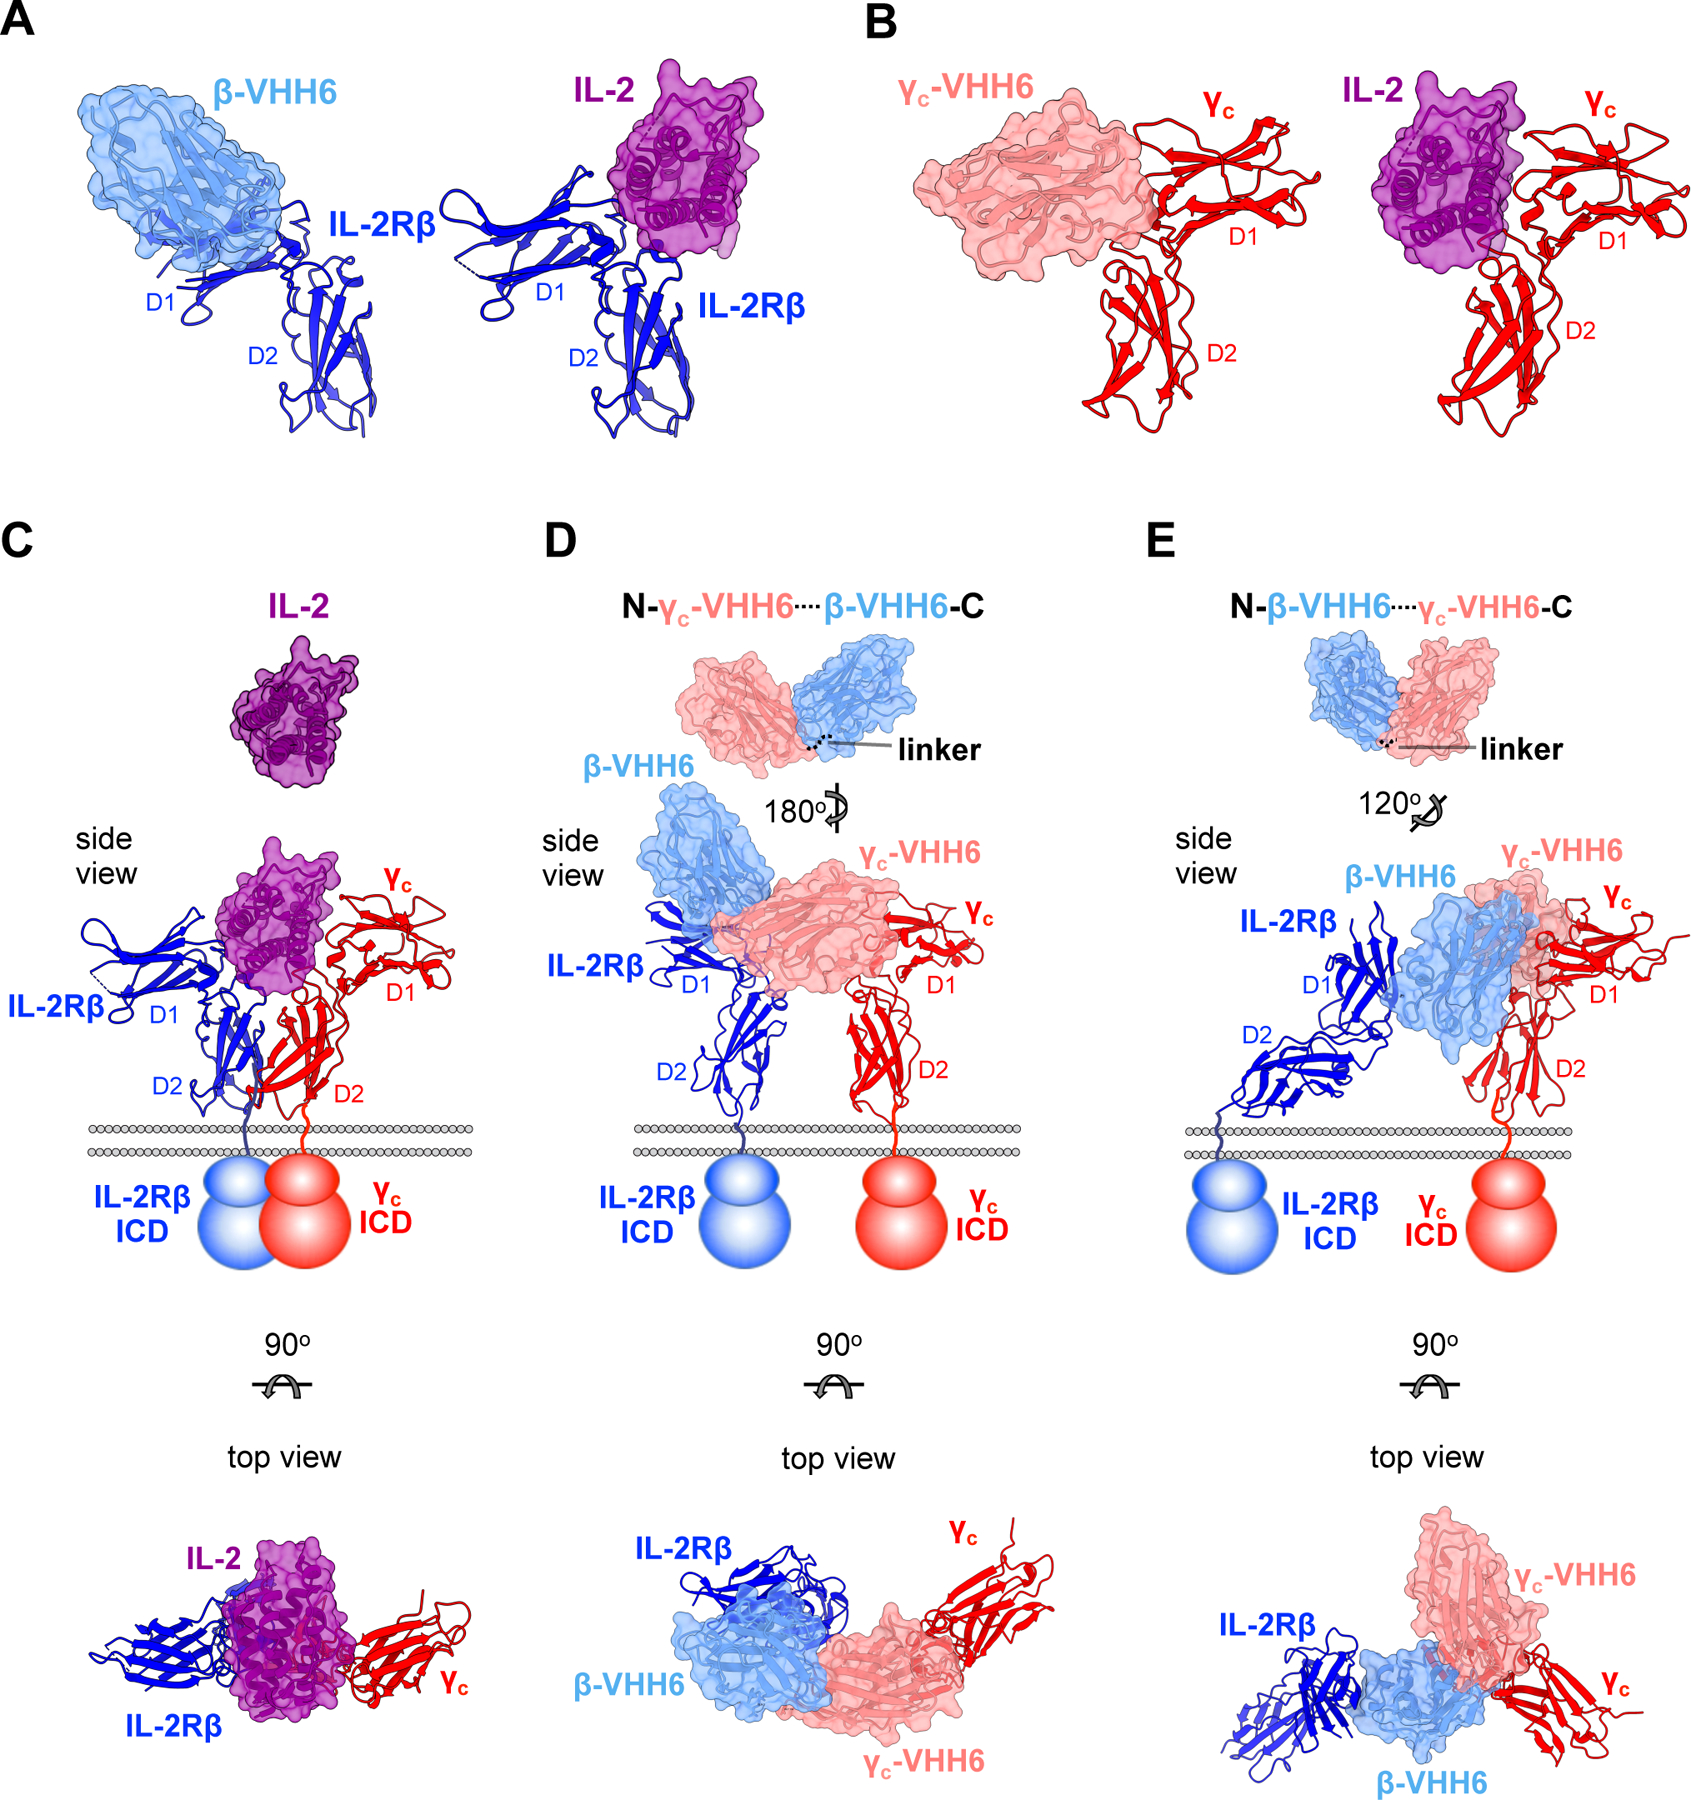
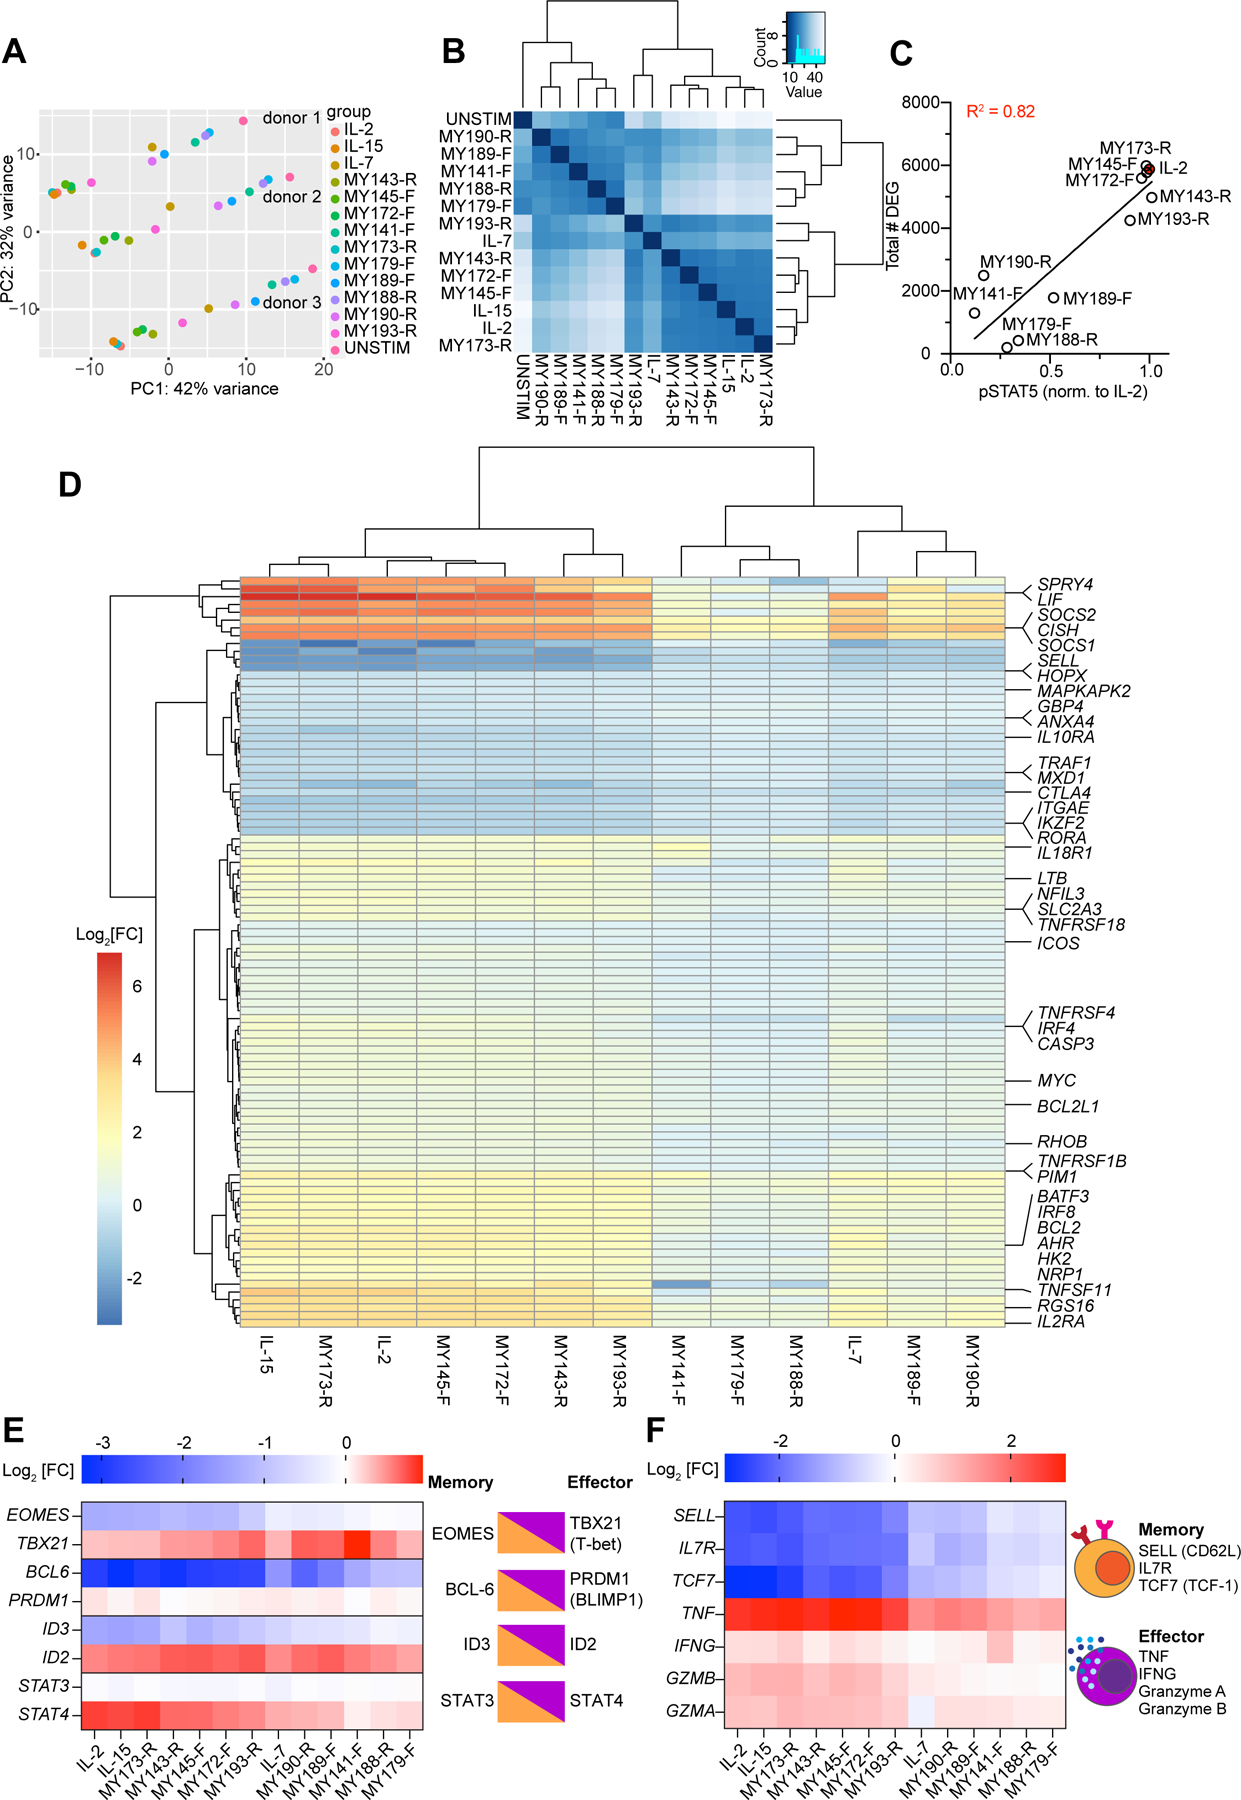
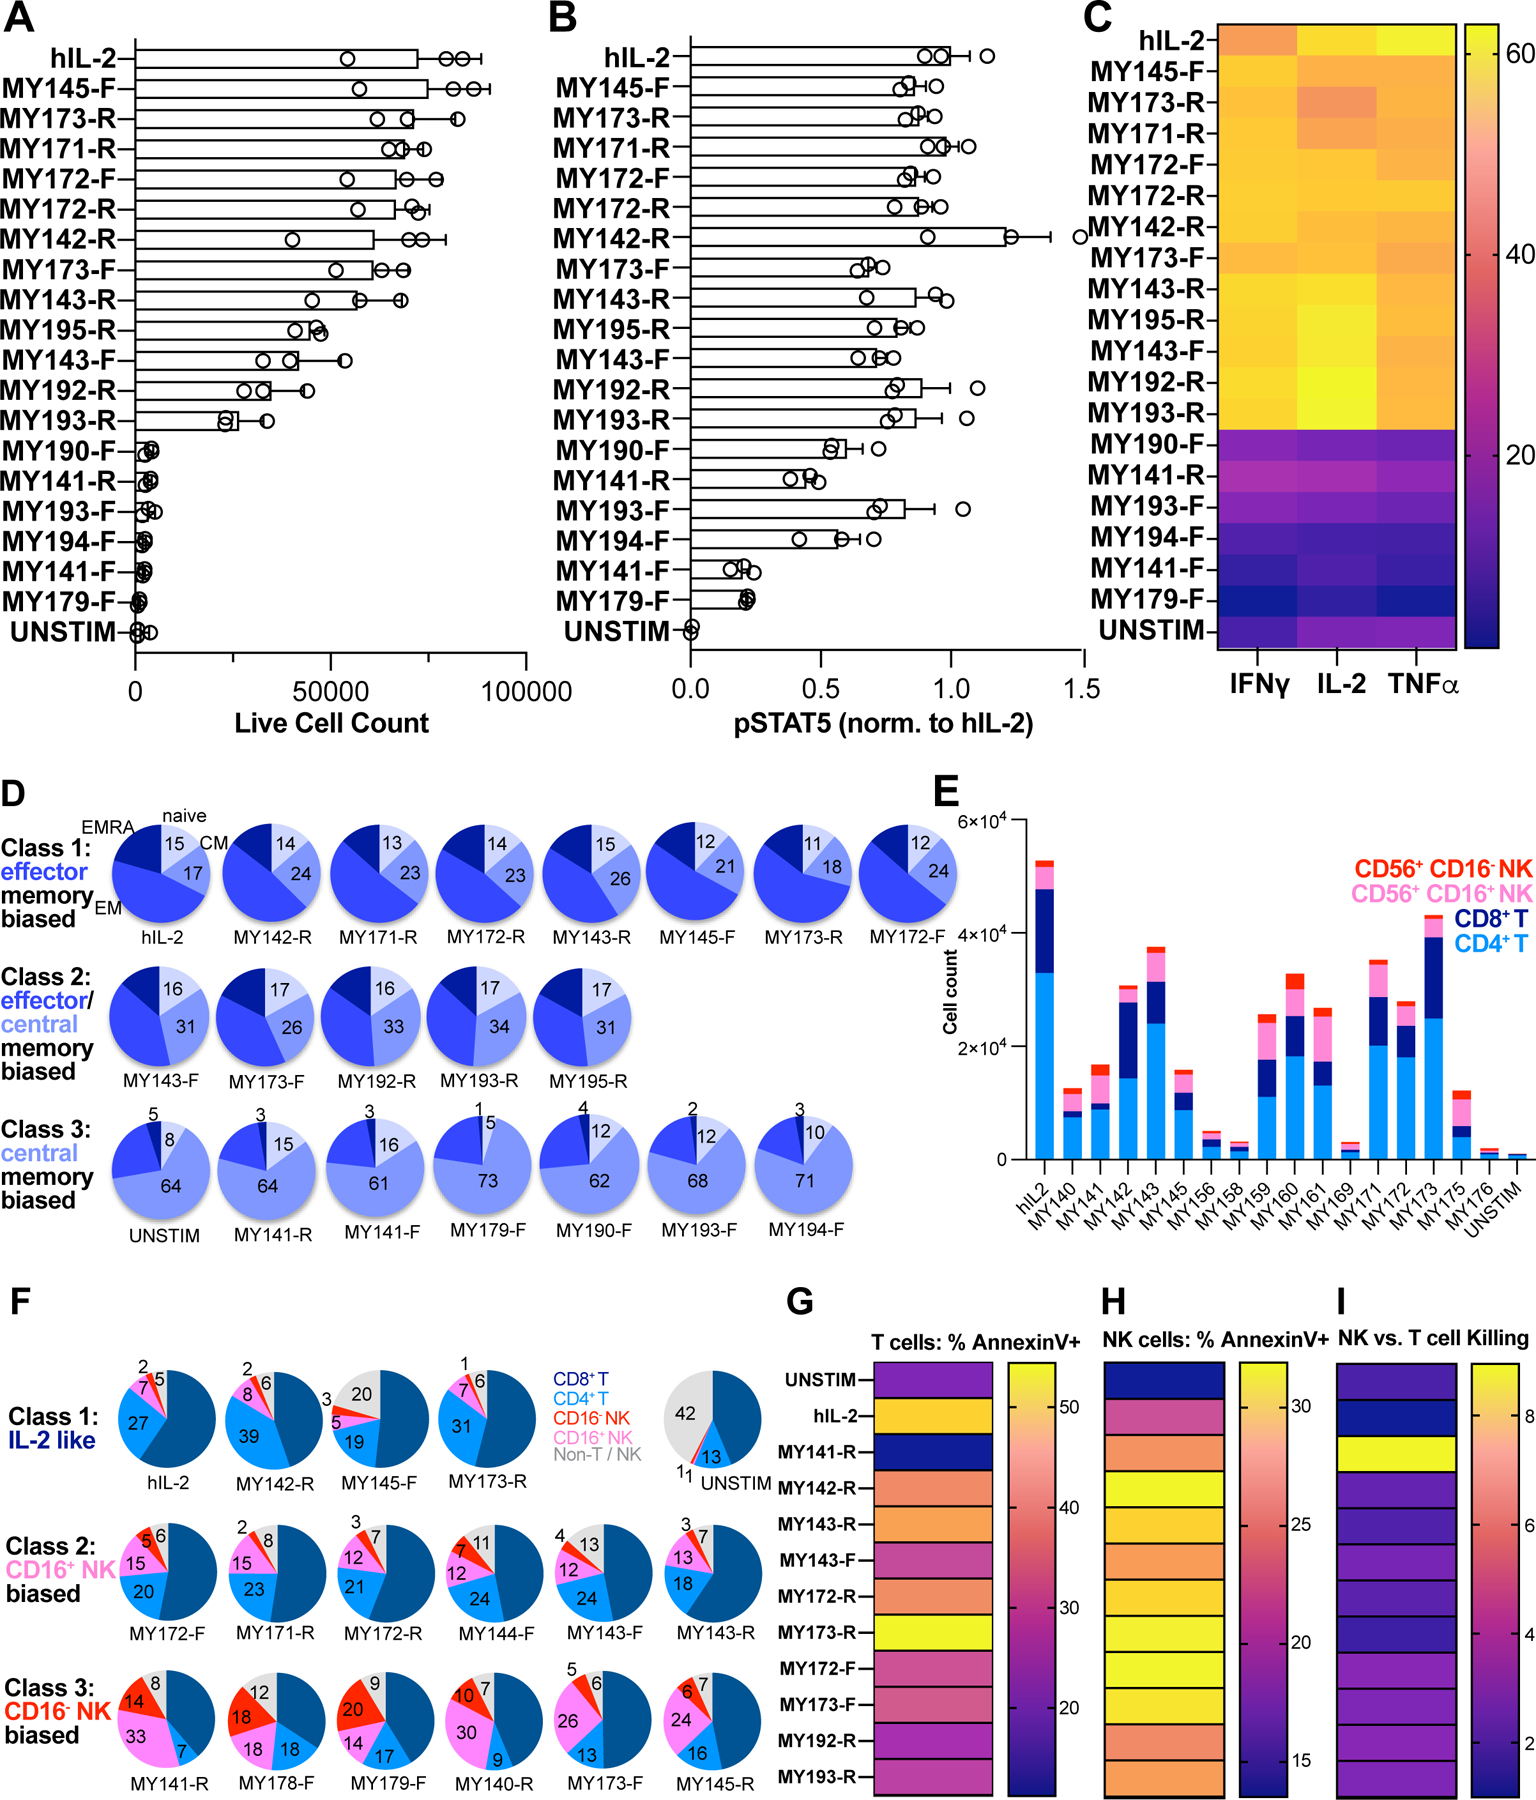
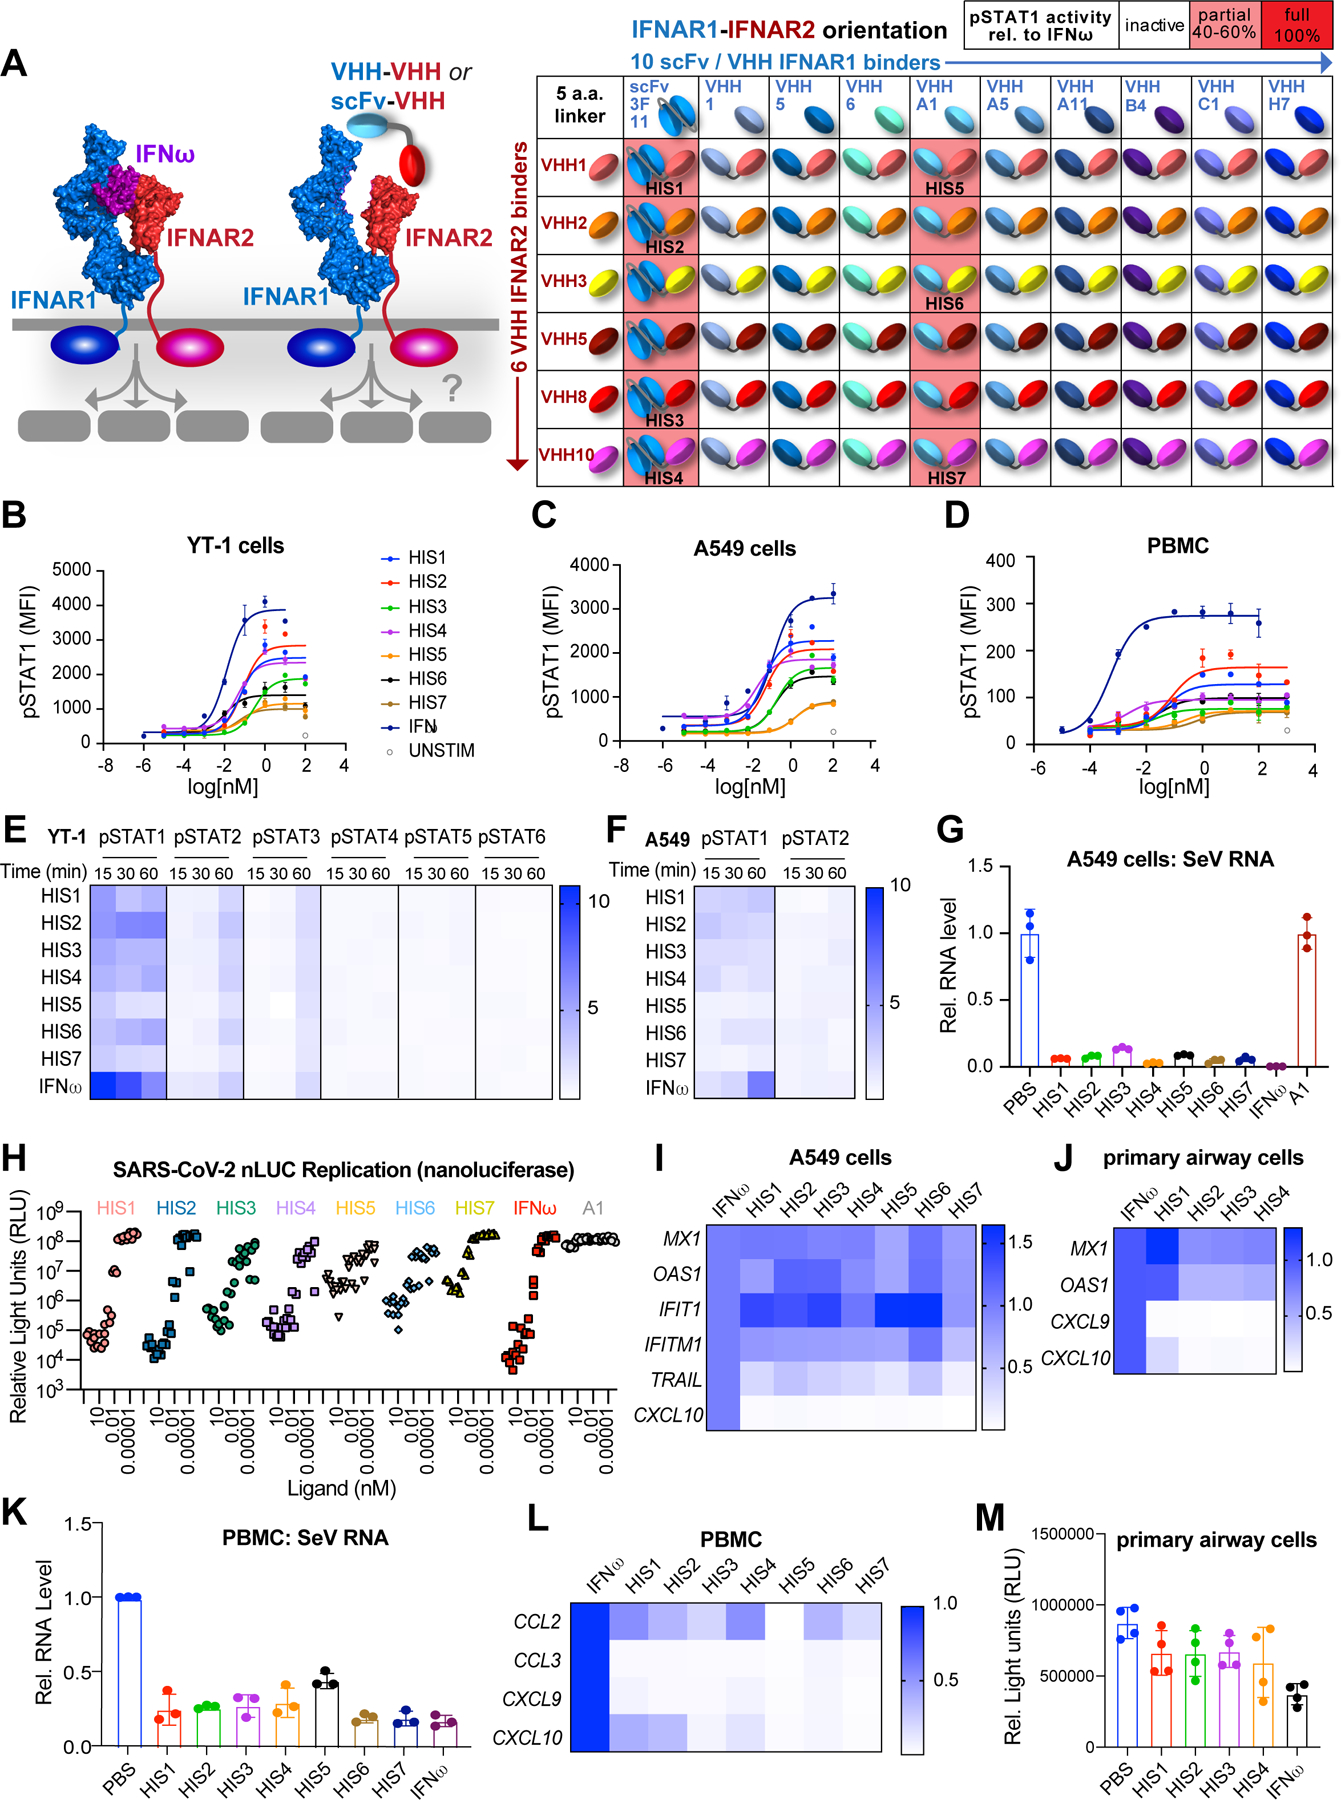
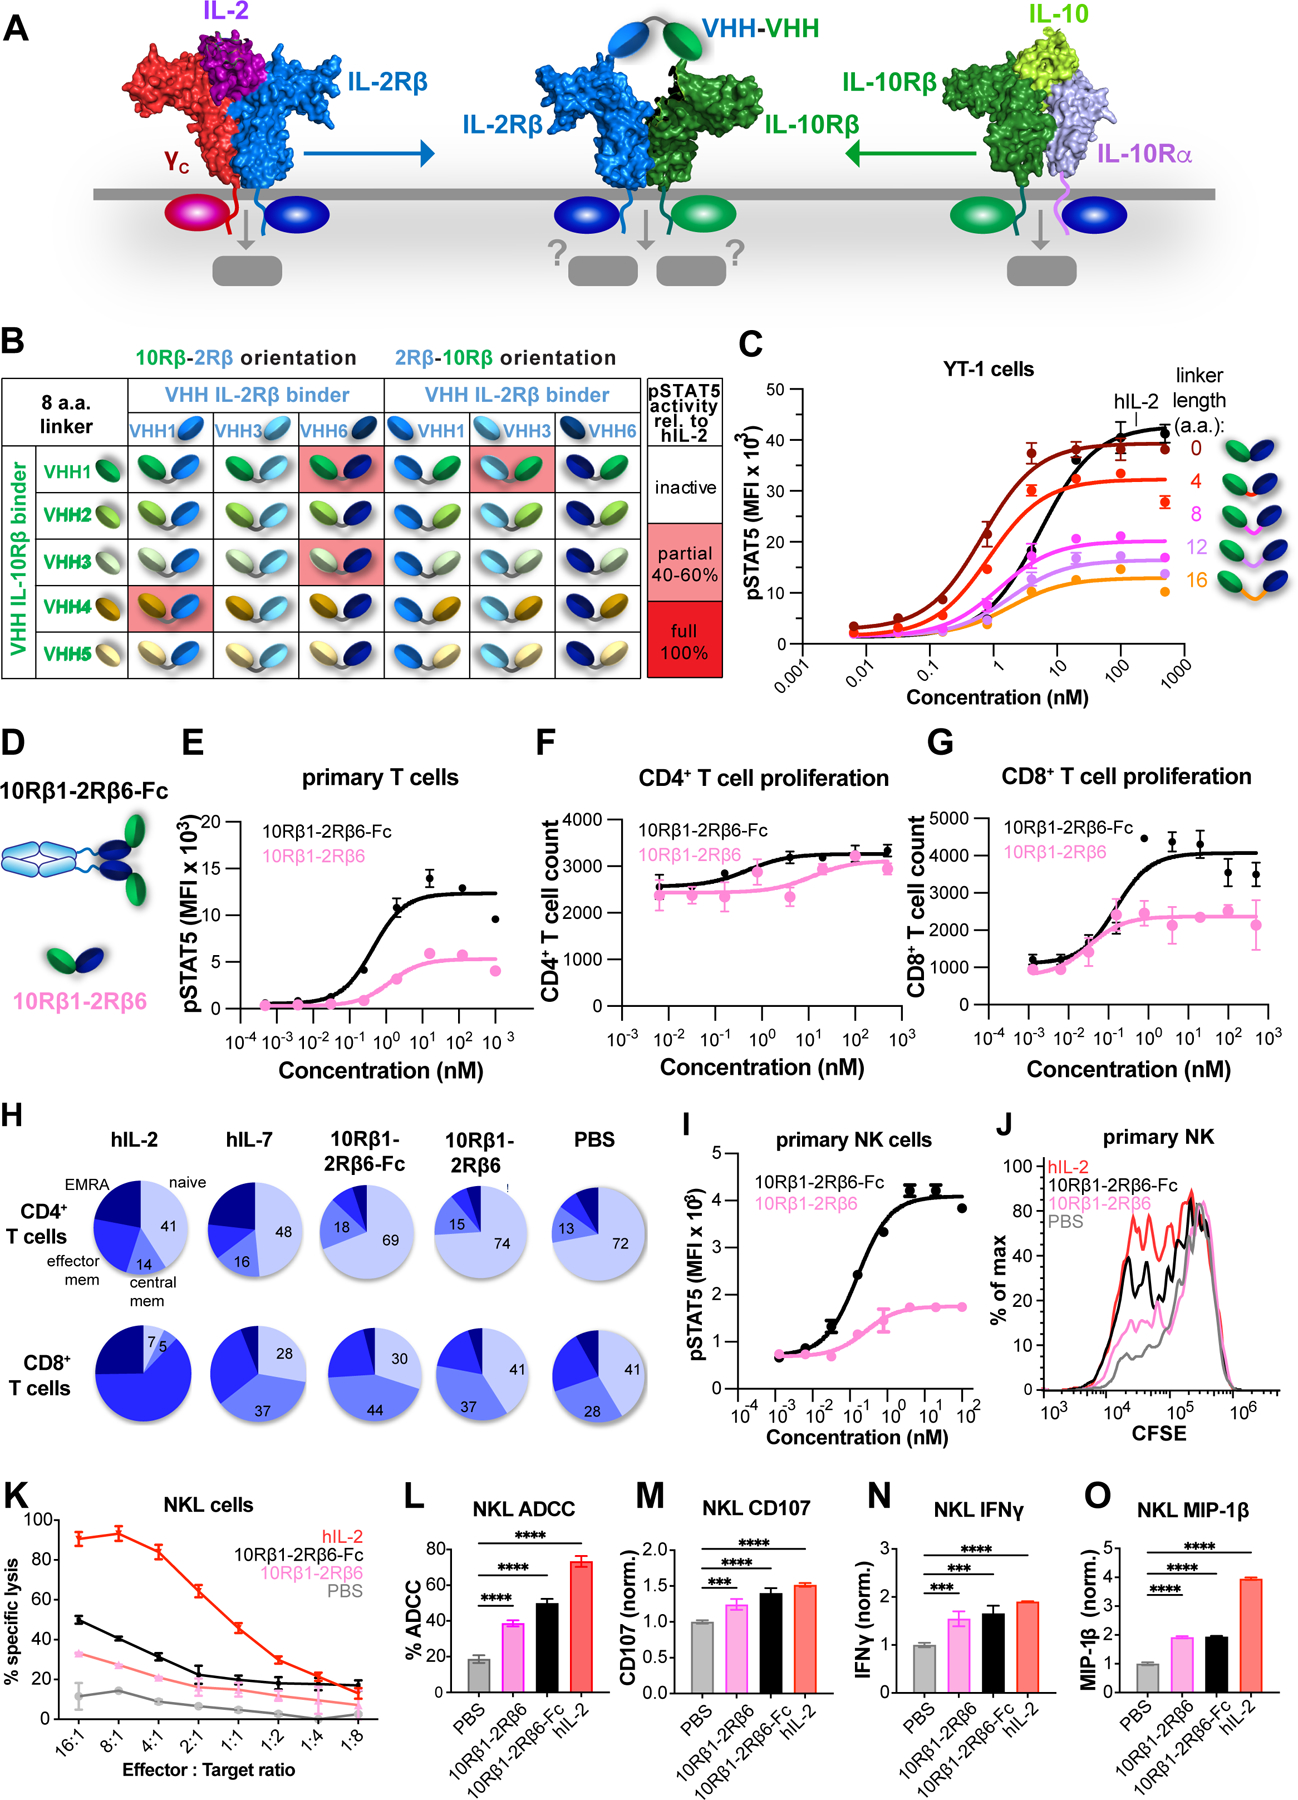
Cytokines are powerful immune modulators that initiate signaling through receptor dimerization, but natural cytokines have structural limitations as therapeutics. We present a strategy to discover cytokine surrogate agonists by using modular ligands that exploit induced proximity and receptor dimer geometry as pharmacological metrics amenable to high-throughput screening. Using VHH and scFv to human interleukin-2/15, type-I interferon, and interleukin-10 receptors, we generated combinatorial matrices of single-chain bispecific ligands that exhibited diverse spectrums of functional activities, including potent inhibition of SARS-CoV-2 by surrogate interferons. Crystal structures of IL-2R:VHH complexes revealed that variation in receptor dimer geometries resulted in functionally diverse signaling outputs. This modular platform enabled engineering of surrogate ligands that compelled assembly of an IL-2R/IL-10R heterodimer, which does not naturally exist, that signaled through pSTAT5 on T and natural killer (NK) cells. This "cytokine med-chem" approach, rooted in principles of induced proximity, is generalizable for discovery of diversified agonists for many ligand-receptor systems.

Keywords: SARS-CoV-2; VHH; bispecific antibodies; cell signaling; cytokine engineering; interferon; interleukin-10; interleukin-2; scFv.


Conflict of interest statement

Declaration of interests K.C.G., M.Y., J.R., and Q.L. are co-inventors on a provisional patent 63/306,882 based upon the technology described in this manuscript. K.C.G. is the founder of Synthekine Therapeutics.

Figures

Figure 1.
Figure 1.. Platform for generation and screening of bispecific IL-2Rβ/γC surrogate agonists.
(A) Platform for discovery of surrogate IL-2 receptor agonists based on construction of bispecific VHH or scFv specific for IL-2Rβ and γC. (B) Schematic representation of VHH and scFv binding to diverse epitopes along the IL-2Rβ or γc extracellular domains (left), combinatorial matrix to generate a collection of β-γ dimerizing ligands (middle), and representation of VHH–VHH or VHH–scFv fusion constructs connected by short linkers in Forward or Reverse orientations (right). (C) Schematic pipeline for protein expression and activity screening of surrogate ligands. Bispecific VHH were produced by gene synthesis of VHH monomers and cloning, expressed at 2mL scale in Expi293 cells, and purified via their 6-His tags on Ni2+ affinity resin followed by size exclusion chromatography (SEC) and SDS-PAGE analysis. Protein activity was measured via a pSTAT5 phosphoflow assay on YT-1 cells. (D) Heatmap of pSTAT5 activity evoked by bispecific antibody pairings. YT-1 cells were stimulated with saturating ligand concentration for 20 min., fixed and permeabilized, then stained with α-STAT5(pY694)-AlexaFluor647 and analyzed via flow cytometry. (E) Affinity to IL-2Rβ does not predict STAT5 activity. Each circle represents a bispecific molecule, with pSTAT5 Emax (normalized to hIL-2) plotted against the affinity of its IL-2Rβspecific VHH. Data were fit by linear regression, with R2 = 0.0335. (F) Affinity to γC does not predict STAT5 activity. Each circle represents a bispecific molecule, with pSTAT5 Emax (normalized to hIL-2) plotted against the affinity of its γC-specific VHH or scFv. Data were fit by linear regression, with R2 = 0.0004. (G) Overall receptor binding affinity (IL-2Rβ × γC KD) is not predictive of STAT5 activity. Bispecific molecules with identical IL-2Rβ × γC antibody usage are depicted in the same color. Data were fit by linear regression, with R2 = 0.0005. See also Figures S1 and S2A–S2B.
Figure 2.
Figure 2.. Profiling signaling properties of IL-2 surrogate ligands.
(A) Kinetics of pSTAT5, pERK, and pAkt signaling evoked by IL-2 or surrogate agonists. YT1 cells were serum-starved for 1–2hr., then stimulated with 50nM ligand for 0.5–15min. at 37°C, fixed and permeabilized, then stained with fluorescently-conjugated phospho-antibodies before reading on a flow cytometer. (B) Dose-response relationship of pSTAT5, pERK, and pAkt activity evoked by IL-2 or surrogate agonists. Serum-starved YT-1 cells were stimulated with varying concentration of ligand for 3min., then processed as in (A) for phosphoflow analysis. (C) Classification of signal strength for IL-2 surrogate agonists, with relative strength of activity encoded by colored gradients. (D) T cell blasts were stimulated with 50nM hIL-2 or surrogate agonist for 20min. at 37°C, fixed and permeabilized, then stained with fluorescently conjugated antibodies against pSTAT1, pSTAT3, or pSTAT5 and read on a flow cytometer. Raw fluorescence intensities were background subtracted against that of unstimulated cells, then normalized to hIL-2 values. (E) T cell blasts were stimulated with 50nM hIL-2 or surrogate agonist for 1hr. at 37°C. Cells were fixed and permeabilized, then stained with fluorescently-conjugated antibodies against pSTAT5 and pS6, and read on a flow cytometer. Data are baseline subtracted and normalized as in (D). (F) Summary of ligand signaling properties across pSTAT1/3/5 and pAkt pathways, with relative strength of activity encoded by colored gradients. Data were collected in triplicate, with graphs displaying the mean ± sem. See also Figures S2 and S3.
Figure 3.
Figure 3.. Dimeric geometries from crystal structures of IL-2Rβ:VHH and γc:VHH complexes.
(A) Side view comparisons between the human IL-2:IL-2Rβ binary complex (PDB: 2B5I) (Wang et al., 2005) and β-VHH6:IL-2Rβ binary complex. Surface representations of IL-2 and β-VHH6 are colored in purple and light blue, respectively, while IL-2Rβ is shown in ribbon representation in navy. (B) Side view comparisons of IL-2:γC and γC-VHH6:γC receptor complexes. γC-VHH6 is shown in pink, with γC colored in red (C) Crystal structure of the human IL-2:IL-2Rβ:γC ternary complex (PDB: 2B5I) (Wang et al., 2005). Side view with membrane bilayer and schematic representation of receptor transmembrane and intracellular domains (ICD) is shown at middle. Top view (below) is related to the side view by a 90° rotation about the horizontal axis. (D) Model of γC-VHH6–β-VHH6 bound to its receptors. Structures of the γC-VHH6:γC and IL-2Rβ:β-VHH6 were determined separately. The γC-VHH6–β-VHH6 linker distance was modeled in and represented by a dotted line (top), with a side and top views of receptor-bound model shown underneath. (E) Model of β-VHH6–γC-VHH6 bound to its receptors. The VHH–VHH linker was modeled as in (D). See also Table S1.
Figure 4.
Figure 4.. Transcriptional profiling of IL-2 surrogate agonists.
(A) Principal component analysis (PCA) of gene expression in CD8+ T cells from 3 donors stimulated with IL-2 or surrogate ligands for 24 hours. Samples from a given donor lie along a horizontal line, with unstimulated samples at the right and IL-2/IL-15 treated samples at the left. The effect of various ligand stimulations is largely described by PC1. (B) Euclidean distance matrix showing overall similarities in mRNA expression between treatment conditions. Samples within the same treatment condition were pooled together. Dendrograms depict the results of unsupervised hierarchical clustering between samples, with the branch length being proportional to the distance between samples. (C) Relationship between surrogate ligand pSTAT5 activity and the total number of differentially expressed genes (DEG) induced by ligand stimulation. STAT5 phosphorylation was normalized to that of hIL-2 stimulated cells. (D) Hierarchical clustering of “Hallmark” STAT5 targets (curated by mSigDB) (Liberzon et al., 2015; Subramanian et al., 2005) whose expression was significantly altered by treatment cytokine or surrogate agonist treatment (padj < 0.05). Differential gene expression is represented as the log2 fold-change (Log2[FC]) of normalized mRNA counts. Genes are arrayed by row and ligands by column. (E) Log2 fold expression change of transcription factors which play opposing roles in CD8+ memory vs. effector differentiation. Opposing transcription factor pairs are diagrammed (right) with the accompanying log2 fold changes induced by surrogate ligands (left). (F) Log2 fold expression change of selected markers of memory and effector T cells (left). Memory T cells express CD62L (encoded by SELL), IL7 receptor, and the transcription factor TCF1 (encoded by TCF7), whereas effector CD8+ T cells produce abundant amounts of cytokines TNFα and IFNγ and cytolytic molecules such as granzymes A and B (right).
Figure 5.
Figure 5.. IL-2 surrogate agonists support T and NK cell proliferation and cytolysis.
Naïve T cells were isolated from PBMC by negative magnetic selection, preactivated for 4d with surface-bound α-CD3 + soluble α-CD28, then cultured in the presence of 100nM hIL-2 or surrogate agonist for 8d. (A) Total T cell count after differentiation in the presence of indicated ligand. Wells were set up in triplicate. (B) pSTAT5 activity in preactivated T cells, normalized to that of hIL-2. (C) Cytokine profiling of CD8+ T cells was performed by stimulating cells with PMA + ionomycin in the presence of brefeldin A and monensin, followed by intracellular staining to assess IFNγ, IL-2, and TNFα production. Data represent an average of 3 replicate wells and are colored by heat map encoding the percentage of CD8+ cells expressing the indicated cytokine. (D) Cells were stained with surface antibodies against CD4, CD8, CCR7, and CD45RA to enumerate differentiation into T cell memory subtypes. The fraction of naïve, central memory, effector memory, and TEMRA cells are represented using pie charts. (E) PBMC were cultured for 2 weeks in the presence of 100nM hIL-2 or surrogate agonists, then stained with phenotyping markers for T and NK cells and enumerated using flow cytometry. The graph displays absolute live cell counts of CD8+ T, CD4+ T, CD16+ NK, and CD16NK cells. (F) Pie charts of cell count data from (E) depict the fraction of T and NK cell types. (G) T cell cytolytic activity stimulated by culture with hIL-2 or surrogate agonists. Pre-activated human T cells were lentivirally transduced with A3A TCR and cultured for 10d in the presence of 100nM hIL-2 or IL-2 surrogate agonists to generate CTLs. Cytotoxicity was measured by mixing effector T cells with a fixed number of CTV-labeled A375 melanoma target cells for 4–6hr., then assessing apoptosis via annexin V staining. (H) NK cytolytic activity stimulated by culture with hIL-2 or surrogate agonists. Pre-activated NK cells were cultured for 4 weeks in the presence of 100nM hIL-2 or surrogate agonists and mixed with 25,000 CTV-labeled K562 target cells per well. Following 5hr. incubation, cells were stained with annexin V-PE, then analyzed for early apoptosis using flow cytometry. (I) Relative efficiency of NK vs. T cell cytolysis supported by surrogate IL-2 ligands. Annexin V positivity rates were normalized to hIL-2 in NK cells (H) or T cells (G) cultured with surrogate ligands, then ratioed and represented as a heat map. See also Figures S4 and S5.
Figure 6.
Figure 6.. Type I Interferon surrogate agonists exhibit biased signaling and inhibit viral replication.
(A) Schematic representation of bispecific type I IFN surrogate ligands which heterodimerize IFNAR1 and IFNAR2 (left). A collection of 11 IFNAR1 binders (1 scFv, 10 VHH) were paired with 6 IFNAR2 binders (VHH), resulting in 66 combinations of IFNAR1-IFNAR2 fusion molecules connected via a 5 a.a. linker (right). Twelve of these molecules induced pSTAT1 activity on YT-1 cells (pink shading). The IFNAR2-specific scFv “3F11” was identified from the patent US7662381B2 (Cardarelli et al., 2010). Seven of the hits, “HIS1–7,” were selected for further analysis. (B-D) Dose-response relationship of STAT1 phosphorylation evoked by IFNω or surrogate agonists. YT-1 cells (B), A549 cells (C), or PBMCs (D) were stimulated with saturating ligand concentration for 20 min., fixed and permeabilized, then stained with α-STAT1(pY701)-AlexaFluor647 and analyzed via flow cytometry. (E) Heatmap representation of STAT1-STAT6 phosphorylation evoked by surrogate agonists in YT-1 cells at different time points and normalized to the activation induced by IFNω. (F) Heatmap representation of STAT1 and STAT2 phosphorylation evoked by HIS in A549 cells at varying time points, normalized to activation induced by IFNω. (G) qRT-PCR analysis of SeV RNA in A549 cells pre-treated with 10nM HIS or IFNω for 24hr. followed by SeV infection (MOI=0.1) for 24hr. (H) SARS-CoV-2 nLUC A549-hACE2 Antiviral Assay. A549-hACE2 cells were treated with varying concentration of HIS, IFNω, or negative control (monomer VHH “A1”) for 24hr. prior to infection with SARS-CoV2 nLUC. SARS-CoV-2 nLUC replication (relative light units) for triplicate wells per VHH dilution is shown. (I-J) Heatmap representation of selected ISGs induced by HIS in A549 cells (I) or human primary bronchial/tracheal epithelial cells (J). Gene expression is normalized to the level induced by IFNω. (K) qRT-PCR analysis of SeV RNA in PBMCs pre-treated with 10nM HIS or IFNω for 24hr. followed by SeV infection (MOI=0.5) for 24hr. (L) Heatmap representation of selected ISGs induced by HIS in PBMCs. (M) CellTiter-GLO assay of human primary bronchial/tracheal epithelial cells treated with 10nM HIS or IFNω for 72hr. See also Figure S6.
Figure 7.
Figure 7.. A surrogate agonist that enforces proximity between IL-2Rβ and IL-10Rβ activates pSTAT5 signaling in T and NK cells.
(A) Schematic showing non-natural receptor pairing of IL-10Rβ/IL2-Rβ to compel formation of a synthetic JAK1/TYK2 heterodimer. (B) Thirty IL-10β/IL-2Rβ VHH pairings (with 8 a.a. linkers) in forward and reverse orientations were expressed and assayed for pSTAT5 activity in YT-1 CD25cells. Of the thirty combinations, four pairings had partial pSTAT5 activity (pink shading). (C) Modulation of ligand activity by linker length. 10Rβ12Rβ6 agonists with varying linker length between 0–16 a.a. were tested for pSTAT5 signaling in YT-1 cells. (D) Modulation of agonist activity by Fc-mediated dimerization. (E) Dimerization of the 10Rβ1–2Rβ6 ligand via Fc-fusion enhances pSTAT5 in primary human T cells. (F-G) CD8+ but not CD4+ T cell proliferation is driven by 10Rβ1–2Rβ6 and 10Rβ1– 2Rβ6-Fc. Pre-activated human T cells were cultured with varying concentrations of 10Rβ1– 2Rβ6 (pink) and 10Rβ1–2Rβ6-Fc agonists (black). Dose-response relationship of CD4+ (F) and CD8+ (G) T cells proliferation is indicated. (H) CD8+ but not CD4+ T cell differentiation is driven by 10Rβ1–2Rβ6 and 10Rβ1–2Rβ6-Fc. (I) Dose-response of 10Rβ1–2Rβ6 agonist (pink) and 10Rβ1–2Rβ6-Fc agonist (black) on pSTAT5 in primary effector NK cells. Data (mean ± SD) are from three independent replicates. (J) Effector NK cells were labelled with 5μM CFSE for 20min at 37°C. Histogram at 100nM ligand concentration displays proliferation of effector NK following 3d culture. (K) NKL killing of K562 tumor cells is enhanced by treatment with 10Rβ1–2Rβ6 (pink), 10Rβ1–2Rβ6-Fc (black) and hIL-2 (red). (L-O) Degranulation and activation of NKL cells in response to 10Rβ1–2Rβ6, 10Rβ1–2Rβ6-Fc, and hIL-2. See also Figure S7.

Comment in

References

    1. Berraondo P, Sanmamed MF, Ochoa MC, Etxeberria I, Aznar MA, Pérez-Gracia JL, Rodríguez-Ruiz ME, Ponz-Sarvise M, Castañón E, and Melero I (2018). Cytokines in clinical cancer immunotherapy. British Journal of Cancer 120, 6–15. - PMC - PubMed
    1. Cameron BJ, Gerry AB, Dukes J, Harper JV, Kannan V, Bianchi FC, Grand F, Brewer JE, Gupta M, Plesa G, et al. (2013). Identification of a Titin-derived HLA-A1-presented peptide as a cross-reactive target for engineered MAGE A3-directed T cells. Sci Transl Med 5, 197ra103. - PMC - PubMed
    1. Cardarelli JM, Witte A, and Srinivasan M (2010). Interferon Alpha Receptor 1 Antibodies and Their Uses. US Patent 7662381 B2, filed June 20, 2005, and granted February 16, 2010
    1. Cooper MA, Fehniger TA, and Caligiuri MA (2001). The biology of human natural killercell subsets. Trends Immunol 22, 633–640. - PubMed
    1. Corman SL, and Mohammad RA (2010). Eltrombopag: a novel oral thrombopoietin receptor agonist. Ann Pharmacother 44, 1072–1079. - PubMed

Publication types