. 2022 Apr 7;29(4):559-576.e7.
doi: 10.1016/j.stem.2022.02.011. Epub 2022 Mar 23.

PPARdelta activation induces metabolic and contractile maturation of human pluripotent stem cell-derived cardiomyocytes

Affiliations

PPARdelta activation induces metabolic and contractile maturation of human pluripotent stem cell-derived cardiomyocytes

Nadeera M Wickramasinghe et al. Cell Stem Cell. .

Abstract

Pluripotent stem-cell-derived cardiomyocytes (PSC-CMs) provide an unprecedented opportunity to study human heart development and disease, but they are functionally and structurally immature. Here, we induce efficient human PSC-CM (hPSC-CM) maturation through metabolic-pathway modulations. Specifically, we find that peroxisome-proliferator-associated receptor (PPAR) signaling regulates glycolysis and fatty acid oxidation (FAO) in an isoform-specific manner. While PPARalpha (PPARa) is the most active isoform in hPSC-CMs, PPARdelta (PPARd) activation efficiently upregulates the gene regulatory networks underlying FAO, increases mitochondrial and peroxisome content, enhances mitochondrial cristae formation, and augments FAO flux. PPARd activation further increases binucleation, enhances myofibril organization, and improves contractility. Transient lactate exposure, which is frequently used for hPSC-CM purification, induces an independent cardiac maturation program but, when combined with PPARd activation, still enhances oxidative metabolism. In summary, we investigate multiple metabolic modifications in hPSC-CMs and identify a role for PPARd signaling in inducing the metabolic switch from glycolysis to FAO in hPSC-CMs.

Keywords: PPAR signaling; cardiac maturation; fatty acid oxidation; metabolism; stem cells.


Conflict of interest statement

Declaration of interests The authors declare no competing interest.

Figures

Figure 1.
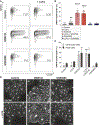
Figure 1.. PPAR isoforms show distinct expression and function during hPSC-CM differentiation and maturation
(A) RT-qPCR analysis of PPARA, PPARD, and PPARG during hPSC-CM differentiation (n = 4) and in human fetal heart tissue (week 16 of gestation). (B) Composite IF images for cardiac troponin T (cTnT) or alpha-actinin (ACNT2) in combination with PPARa, PPARd, or PPARg on week 16 human fetal heart (left ventricle). DAPI is used to visualize nuclei. Scale bars: 25 μm. (C) Flow cytometry analysis of hPSC-CMs at day 20 of differentiation for SIRPA and CD90. (D and E) Flow cytometry analysis of hPSC-CMs at day 35 of differentiation for SIRPA and CD90 or for ACTN2-eGFP. Cells were treated with PPAR antagonists for 2 weeks prior to analysis. (F) Quantification of SIRPA+CD90— hPSC-CMs from (C). (G) Quantification of total cell numbers from (C). (H) Quantification of SIRPA+CD90— hPSC-CMs from (D). (I) ACTN2-eGFP fluorescence intensity in hPSC-CMs treated with PPAR antagonists for 2 weeks (days 20–35). (J) Quantification of ACTN2-eGFP mean fluorescence intensity in (I). (K) Composite IF images for cTnT and ACTN2 in hPSC-CMs treated with PPAR antagonists for 2 weeks (days 20–35). DAPI is used to visualize nuclei. Scale bars: 50 μm. (L) ScRNA-seq UMAP clustering of hPSC-CMs (left) and expression of cTnT (green) and vimentin (purple) (right). (M) cTnT+ (red) and Vimentin+ (blue) cells were grouped, and expression of PPAR isoforms assessed. (N) Expression of PPARA, PPARD, and PPARG in hPSC-CMs. Biological replicates are identified by same shape of respective data points. Data represented as mean ± SD. Statistics: Student’s t tests relative to control (far left) (*p < 0.05; **p < 0.01; ***p < 0.001; **** p < 0.0001). AVJ, atrioventricular junction; HH, human heart (adult); LA, left atria; LV, left ventricle; RA, right atrial; RV, right ventricle.
Figure 2.
Figure 2.. PPARd activation induces changes in cell morphology, cell size, and number of nuclei in hPSC-CMs
(A) Schematic of experimental outline. (B) IF analysis for cTnT 4 weeks after PPAR modulations. Representative images are shown, scale bars: 50 μm. (C and D) Mean vector length and circularity standard deviation quantified by MatFiber from IF analysis images for cTnT (n = 3, >15 hPSC-CMs/biological replicate). (E) Cell surface area measured on images from IF analysis for ACTN2 (n = 3, >15 hPSC-CMs/biological replicate). (F) Percentage of binucleated hPSC-CMs determined on images from IF analysis for ACTN2 and DAPI stain (n = 4, >250 hPSC-CMs/condition). Data represented as mean ± SD. Statistics: one-way ANOVA and Tukey test for multiple comparisons (*p ≤ 0.05; **p ≤ 0.01); ***p ≤ 0.001; **** p ≤ 0.0001) relative to control (far left).
Figure 3.
Figure 3.. PPARd activates the FAO transcriptional program in hPSC-CMs
(A) Comparison of KEGG pathways differentially regulated in PPAR modulated hPSC-CMs compared with control 4 weeks after continuous PPAR modulation (set size−number of genes from KEGG pathway in dataset). (B) Expression of key candidates involved in FAO. (C) Genes differentially expressed in PPARd-modulated compared with control hPSC-CMs with gene sets of differentially expressed genes between D27 hPSC-CMs and the adult heart (Pavlovic et al., 2018). (D) Schematic of PPARd modulations and hPSC-CM harvest time points. (E) Temporal analysis of gene expression changes reveals significantly regulated genes only on days 1, 2, 3, and 7 (left), changed at all time points (middle), and regulated late (right). (F) Venn diagram of upregulated (top) and downregulated (bottom) genes after 7 days, a 7-day pulse, and 28 days of PPARd activation compared with control. (G) Stacked bar chart of the promoter- and enhancer-associated peaks identified by ATAC-seq. (H) Heatmap of 50 genes with the greatest differential chromatin accessibility (25 most increased accessibility; 25 most decreased accessibility) between control and PPARd-activated hPSC-CMs. (I) ATAC-seq tracks for PDK4, DYSF, and NIPSNAP3B. Statistics: DESeq2 was used to normalize read counts and determine differentially expressed genes with p < 0.05 relative to control (far left).
Figure 4.
Figure 4.. PPARd activation induces key FAO components in ventricular and atrial hPSC-CMs
(A) Flow cytometry analysis 4 weeks after continuous PPAR modulations. (B) Quantification from (A), (n = 7–19 biological replicates). (C) Flow-cytometry analysis of CD36 expression after PPAR modulation in ventricular and atrial hPSC-CMs (n = 2–4). (D) IF analysis for VLCAD 4 weeks after continuous PPAR modulation. Scale bars, 50 μm. Data represented as mean ± SD. Statistics: Student’s t tests relative to control (far left) (*p < 0.05; **p < 0.01; ***p < 0.001; ****p < 0.0001).
Figure 5.
Figure 5.. PPARd activation induces mitochondrial maturation and FAO in hPSC-CMs
(A) MitoTracker Deep Red dye analysis 4 weeks after continuous PPARd modulations. Scale bars: 50 μm. (B and C) Mitochondrial content quantification by MitoTracker Deep Red flow cytometry. Representative flow cytometry plots for control and LCFA + GW0742 treated hPSC-CMs (B) and quantification in all conditions (C) (n = 6). (D) TEM analysis 4 weeks after continuous PPARd modulations. Mitochondria pseudo-colored in blue. Scale bars: 500 nm. (E and F) Quantification of mitochondrial area and length on TEM images. Data collected from 5–10 images per conditions, with a minimum of 10 mitochondria per image. (G and H) Oxygen consumption rate (OCR) in hPSC-CMs and hPSC-derived fibroblasts (black) 4 weeks after continuous PPARd modulations (n = 4; n = 5–8 technical replicates/condition; normalized to cell number). (I) FAO flux assay 4 weeks after PPARd modulation (n = 4). Data represented as mean ± SD. Statistics: (C, H, and I) Student’s t tests (*p < 0.05; **p < 0.01; ***p < 0.001; **** p < 0.0001) relative to control (far left). (E and F) One-way ANOVA and Tukey test for multiple comparisons (*p ≤ 0.05; **p ≤ 0.01); ***p ≤ 0.001; ****p ≤ 0.0001) relative to control (far left).
Figure 6.
Figure 6.. PPARd activation improves hPSC-CM electrophysiological and contractile maturation
(A and B) Action potential (AP) measurements (A) and calcium transient analysis (B) on single hPSC-CMs 4 weeks after continuous PPARd activation or inhibition, paced at 0.5 Hz (n = 3 biological replicates, 4–10 hPSC-CMs measured/condition/replicate). (C and D) Representative AP (C) and calcium transients (D) traces of control and LCFA + GW0742 treated hPSC-CMs. (E) Schematic of experimental outline for EHT analysis. (F) Brightfield images of EHTs 4 weeks after PPAR modulation. (G) Contractile force measurements in spontaneously contracting EHTs during the 4 weeks of continuous PPARd modulations. (H) Analyses of EHTs 4 weeks after continuous PPARd modulations. EHTs were paced at 1.0 Hz (n = 4; 3 EHTs/biological replicate). Biological replicates identified by same shape of respective data points. Data represented as mean ± SD. Statistics: Student’s t tests relative to control (far left) (*p < 0.05; **p < 0.01; ***p < 0.001; **** p < 0.0001).
Figure 7.
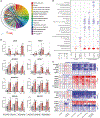
Figure 7.. Transient lactate exposure has long-term effects on hPSC-CMs and PPARd activation induces a metabolic switch across multiple culture systems
(A) Chord-plot illustration of differentially regulated KEGG pathways in hPSC-CMs transiently exposed to lactate compared with control. (B) KEGG pathways comparison between hPSC-CMs after lactate selection and 4 weeks of continuous PPARd modulations relative to control. (C) Gene expression analysis (RNA-seq data, n = 3) in hPSC-CMs transiently exposed to lactate followed by PPARd modulation (4 weeks) and control. (D) Gene expression analysis (RNA-seq, n = 3) of PPARd-modulated hPSC-CMs from 2D monolayers (control), EHTs, lactate selection, and age-matched embryoid bodies (EBs). All conditions on FACS-isolated hPSC-CMs (SIRPA+CD90−). Data represented as mean ± SD. Statistics: DESeq2 was used to normalize read counts and determine differentially expressed genes with p < 0.05 relative to control (far left).

References

    1. Ahmadian M, Suh JM, Hah N, Liddle C, Atkins AR, Downes M, and Evans RM (2013). PPARγ signaling and metabolism: the good, the bad and the future. Nat. Med. 19, 557–566. - PMC - PubMed
    1. Ascuitto RJ, and Ross-Ascuitto NT (1996). Substrate metabolism in the developing heart. Semin. Perinatol. 20, 542–563. - PubMed
    1. Barak Y, Liao D, He W, Ong ES, Nelson MC, Olefsky JM, Boland R, and Evans RM (2002). Effects of peroxisome proliferator-activated receptor δ on placentation, adiposity, and colorectal cancer. Proc. Natl. Acad. Sci. USA 99, 303–308. - PMC - PubMed
    1. Barger PM, and Kelly DP (2000). PPAR signaling in the control of cardiac energy metabolism. Trends Cardiovasc. Med. 10, 238–245. - PubMed
    1. Barrie SE, and Harris P (1977). Myocardial enzyme activities in guinea pigs during development. Am. J. Physiol. 233, H707–H710. - PubMed

Publication types