. 2022 Apr:78:103956.
doi: 10.1016/j.ebiom.2022.103956. Epub 2022 Mar 21.

Epigenetic landscape in the kick-and-kill therapeutic vaccine BCN02 clinical trial is associated with antiretroviral treatment interruption (ATI) outcome

Affiliations

Epigenetic landscape in the kick-and-kill therapeutic vaccine BCN02 clinical trial is associated with antiretroviral treatment interruption (ATI) outcome

Bruna Oriol-Tordera et al. EBioMedicine. 2022 Apr.

Abstract

Background: The BCN02-trial combined therapeutic vaccination with a viral latency reversing agent (romidepsin, RMD) in HIV-1-infected individuals and included a monitored antiretroviral pause (MAP) as an efficacy read-out identifying individuals with an early or late (< or > 4weeks) viral-rebound. Integrated -omics analyses were applied prior treatment interruption to identify markers of virus control during MAP.

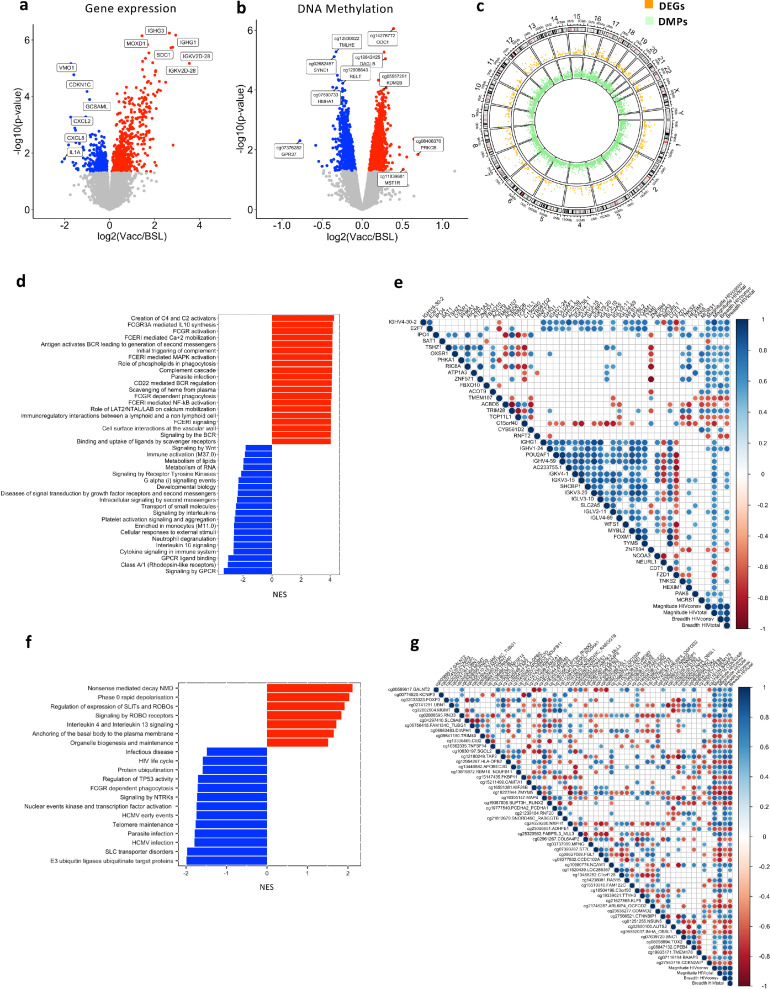
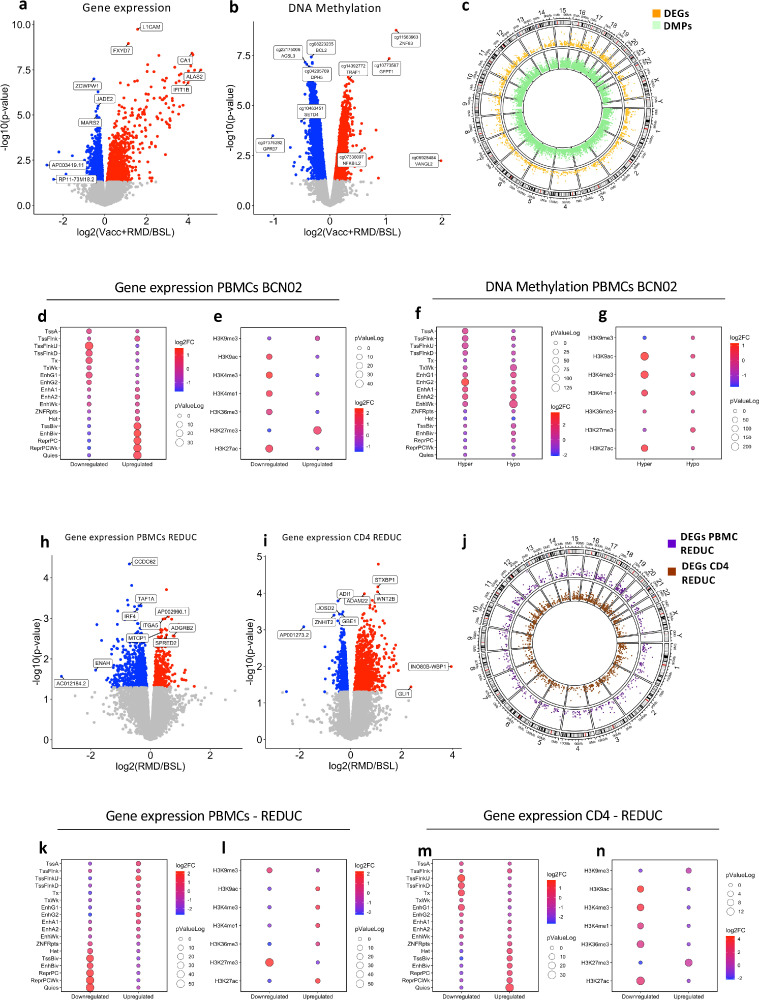
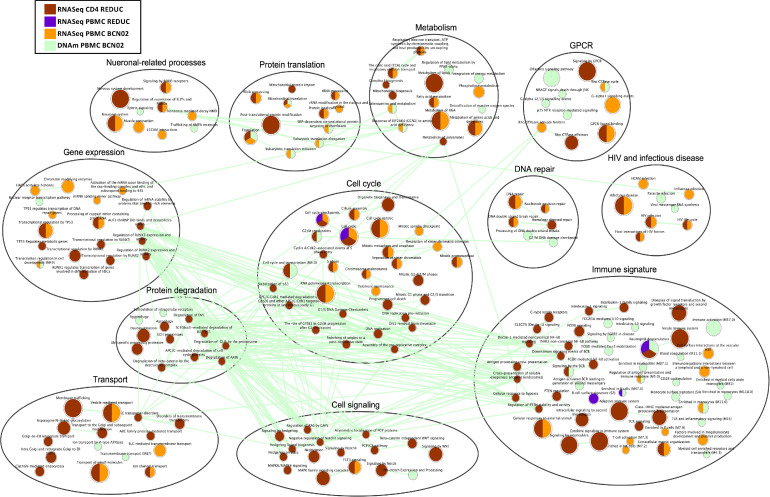
Methods: PBMC, whole-genome DNA methylation and transcriptomics were assessed in 14 BCN02 participants, including 8 Early and 4 Late viral-rebound individuals. Chromatin state, histone marks and integration analysis (histone-3 acetylation (H3Ac), viral load, proviral levels and HIV-specific T cells responses) were included. REDUC-trial samples (n = 5) were included as a control group for RMD administration alone.

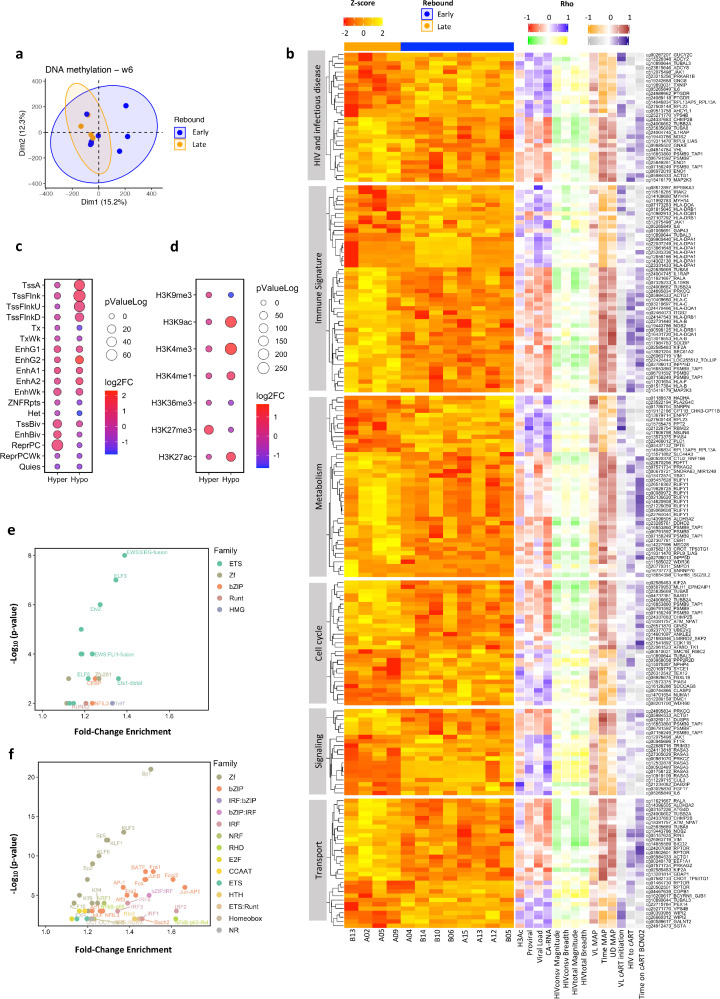
Findings: DNA methylation imprints after receiving the complete intervention discriminated Early versus Late viral-rebound individuals before MAP. Also, differential chromatin accessibility and histone marks at DNA methylation level were detected. Importantly, the differential DNA methylation positions (DMPs) between Early and Late rebounders before MAP were strongly associated with viral load, proviral levels as well as the HIV-specific T-cell responses. Most of these DMPs were already present prior to the intervention and accentuated after RMD infusion.

Interpretation: This study identifies host DNA methylation profiles and epigenetic cascades that are predictive of subsequent virus control in a kick-and-kill HIV cure strategy.

Funding: European Union Horizon 2020 Framework Programme for Research and Innovation under Grant Agreement N°681137-EAVI2020 and N°847943-MISTRAL, the Ministerio de Ciencia e Innovación (SAF2017_89726_R), and the National Institutes of Health-National Institute of Allergy and Infectious Diseases Program Grant P01-AI131568.

Keywords: DNA methylation; Epigenetics; HIV-1 vaccine.


Conflict of interest statement

Declaration of interests BM is a consultant of AELIX THERAPEUTICS, S.L outside the submitted work. CB is co-founder, chief science officer and shareholder of AELIX THERAPEUTICS. J.M. has received research funding, consultancy fees and lecture sponsorships from and has served on advisory boards for various companies (MSD, Gilead Sciences, Viiv Healthcare, and Janssen-Cilag). All other authors declare that they have no competing interests.

Figures

Fig 1
Figure 1
Impact of vaccination on gene expression and DNA methylation in the BCN02 trial. (a) and (b) show the Volcano Plots for the 1287 DEGs and the 5447 DMPs between post-vaccination and baseline, respectively (p-value < 0.05). X-axis show the log2 Fold-Change, and Y-axis the -log10 p-value. Grey colour indicates p-value > 0.05; red, p-value < 0.05 and FC > 0 and blue, p-value < 0.05 and FC < 0. (c) CIRCOS plot that includes an outer track with the chromosomes, genes and CpG positions in the genome. The two inner tracks are the Manhattan plots for DMPs (green) and DEGs (orange) between post-vaccination and baseline time points. (d) and (f) show the pathway enrichment (GSEA) for DEGs and DMPs, respectively. Red colour reflects NES > 0 and blue, NES < 0. (e) Correlation plots of DEGs with breadth and magnitude of the virus vaccine-specific T-cell response evaluated by IFNg ELISpot as detailed in the methods section (p-value < 0.05 & Rho > |0.6|). For both, DEGs and magnitude and breadth of the T-cell response, the log2 change between vaccination and baseline was used. (g) Correlation plot for DMPs and T-cell responses (p-value < 0.01 & Rho > |0.6|) against the HIVconsv immunogen or total HIV-1. For both, DMPs and magnitude and breadth of the T cell response, the log2 change between vaccination and baseline was used. Blue indicates positive and red indicates negative Rho values (Spearman's correlation). Blanks make reference to non-significant correlations.
Fig 2
Figure 2
Effect of combined intervention on gene expression and DNA methylation. (a) Volcano plot of the 3106 DEGs between time points Vacc+RMD and baseline. (b) Volcano plot of the 15139 DMPs between time points Vacc+RMD and baseline. (c) Manhattan plot in CIRCOS. The outer circle shows the chromosomes and positions of DEGs and DMPs. The inner tracks show the Manhattan plot for DMPs (green) and DEGs (orange) between Vacc+RMD and baseline time points. (d) shows the 18-state ChromHMM enrichment and (e) the histone mark enrichment for DMPs. The same was done for DEGs in (f) and (g). (h) and (i) Volcano plots of for DEGs in total PBMCs and isolated CD4 T cell after RMD-only treatment (REDUC), respectively. Colour key is the same as in (a) and (b). (j) Manhattan plot for RMD-only treatment (REDUC) DEGs in PBMC (purple) and CD4 (brown). (k and m) ChromHMM 18-state enrichment based on DEGs in total PBMCs (in k) or CD4 T cells (in m). Histone marks enrichment for DEGs in PBMC (l) and in CD4 T cells (n). For Volcano plots (a, b, h, i) X-axis show the log2 Fold-Change, and Y-axis the -log10p-value. Grey colour indicates p-value > 0.05; red, p-value > 0.05 and FC > 0 and blue, p-value > 0.05 and FC < 0. For ChromHMM and Histone marks enrichments, the colour of the dots is associated with the log2 Fold-change enrichment, and the dot size, with the log10p-value.
Fig 3
Figure 3
Effect of RMD on gene expression and DNA methylation in the BCN02 and REDUC trial. Enrichment Map of enriched pathways and BTMs (GSEA adjusted p-value < 0.2) in DEGs before and after RMD infusion in PBMCs of BCN02 (Orange) and in REDUC PBMC (Purple) or isolated REDUC CD4 T cells (Brown). DMPs before and after RMD infusion in BCN02 are shown (Green). The colour of the nodes indicates the different datasets. Edges represent the similarity of the nodes (cutoff = 0.7).
Fig 4
Figure 4
Differential DNA methylation between individuals with an Early or Late rebound. (a) PCA for DNA methylation at time point Vacc+RMD. Blue and orange colours indicate Early and Late rebounders, respectively. (b) Heatmap of Z-score methylation levels of DMPs (p-value < 0.01) between Early and Late rebound at Vacc+RMD in different pathways (Y-axis). The right part of the heatmap shows the correlation (Spearman's Rho) between DMPs methylation levels and different parameters. For correlations with histone 3 acetylation (H3Ac), proviral levels, ultrasensitive viral load and cell-associated RNA (CA-RNA), red colour shows a negative correlation and blue a positive one. For correlations with the magnitude and breadth of the HIVconsv- or HIVtotal-specifc T cell response, green shows a negative correlation and yellow a positive one. For correlations with viral load at day of cART resumption (VL MAP), time on MAP and time in MAP with undetectable viral load (UD MAP), orange shows a negative correlation and brown a positive one. For correlations with VL at cART initiation, time from HIV infection until cART initiation (HIV to cART) and time on cART at BCN02 entry, grey shows a negative correlation and purple a positive one. (c) 18-state ChromHMM enrichment and (d) the histone marks enrichment for DMPs between and Early and Late rebounders. In the x axis, Hyper and Hypo refer to hypermethylated or hypomethylated DMPs in Early rebounding individuals. The Log2 Fold-Change is shown by the dot colour, while the -log10p-value, with the dot size. (e) Transcription factor (TF) enrichment based on DMPs hypermethylated in Early individuals, and (f) based on DMPs hypomethylated in Early individuals. Colours indicate the TF family, and the name of the TF is shown when Log2 Fold-Change > 0.3. (F) Heatmap of Z-score methylation levels of DMPs (p-value < 0.01) between Early and Late rebound at Vacc+RMD in different pathways (Y-axis). The right part of the heatmap shows the correlation (Spearman's Rho) between DMPs methylation levels and different parameters. For correlations with histone 3 acetylation (H3Ac), proviral levels, ultrasensitive viral load and cell-associated RNA (CA-RNA), red colour shows a negative correlation and blue a positive one. For correlations with the magnitude and breadth of the HIVconsv- or HIVtotal-specifc T cell response, green shows a negative correlation and yellow a positive one. For correlations with viral load at day of cART resumption (VL MAP), time on MAP and time in MAP with undetectable viral load (UD MAP), orange shows a negative correlation and brown a positive one. For correlations with VL at cART initiation, time from HIV infection until cART initiation (HIV to cART) and time on cART at BCN02 entry, grey shows a negative correlation and purple a positive one.

Comment in

References

    1. Ward A.R., Mota T.M., Jones R.B. Immunological approaches to HIV cure. Semin Immunol. 2021;51 https://linkinghub.elsevier.com/retrieve/pii/S1044532320300282 Available from. - PubMed
    1. Ndung'u T., McCune J.M., Deeks S.G. Why and where an HIV cure is needed and how it might be achieved. Nature. 2019;576(7787):397–405. https://www.nature.com/articles/s41586-019-1841-8 Available from. - PMC - PubMed
    1. Bailon L., Mothe B., Berman L., Brander C. Novel approaches towards a functional cure of HIV/AIDS. Drugs. 2020;80:859–868. doi: 10.1007/s40265-020-01322-y. Available from; - DOI - PMC - PubMed
    1. Kim Y., Anderson J.L., Lewin S.R. Getting the “kill” into “shock and kill”: strategies to eliminate latent HIV. Cell Host Microbe. 2018;23:14–26. doi: 10.1016/j.chom.2017.12.004. Cell Press. Available from; - DOI - PMC - PubMed
    1. Delagrèverie H.M., Delaugerre C., Lewin S.R., Deeks S.G., Li J.Z. Ongoing clinical trials of human immunodeficiency virus latency-reversing and immunomodulatory agents. Open Forum Infect Dis. 2016;3(4) https://academic.oup.com/ofid/article/3/4/ofw189/2593325 Available from. - PMC - PubMed