. 2022 Apr:78:103949.
doi: 10.1016/j.ebiom.2022.103949. Epub 2022 Mar 21.

Serial measurement of M. tuberculosis in blood from critically-ill patients with HIV-associated tuberculosis

Affiliations

Serial measurement of M. tuberculosis in blood from critically-ill patients with HIV-associated tuberculosis

David A Barr et al. EBioMedicine. 2022 Apr.

Abstract

Background: Despite being highly prevalent in hospitalised patients with severe HIV-associated tuberculosis (TB) and sepsis, little is known about the mycobacteriology of Mycobacterium tuberculosis bloodstream infection (MTBBSI). We developed methods to serially measure bacillary load in blood and used these to characterise MTBBSI response to anti-TB therapy (ATT) and relationship with mortality.

Methods: We established a microscopy method for direct visualisation of M. tuberculosis bacilli in blood using a novel lysis-concentration protocol and the fluorescent probe, 4-N,N-dimethylaminonaphthalimide-trehalose (DMN-Tre). We tested blood using GeneXpert® MTB/RIF-Ultra (Xpert-ultra) and Myco/F lytic culture after processing blood through lysis-wash steps to remove PCR inhibitors and anti-microbial drug carry-over. HIV-positive patients predicted to have MTBBSI gave blood samples 0, 4, 24, 48 and 72 h after ATT initiation. Bacillary loads were quantified using microscopy, Xpert-ultra cycle threshold, and culture time-to-positivity. Pharmacodynamics were modelled using these measures combined on an ordinal scale, including association with 12-week mortality.

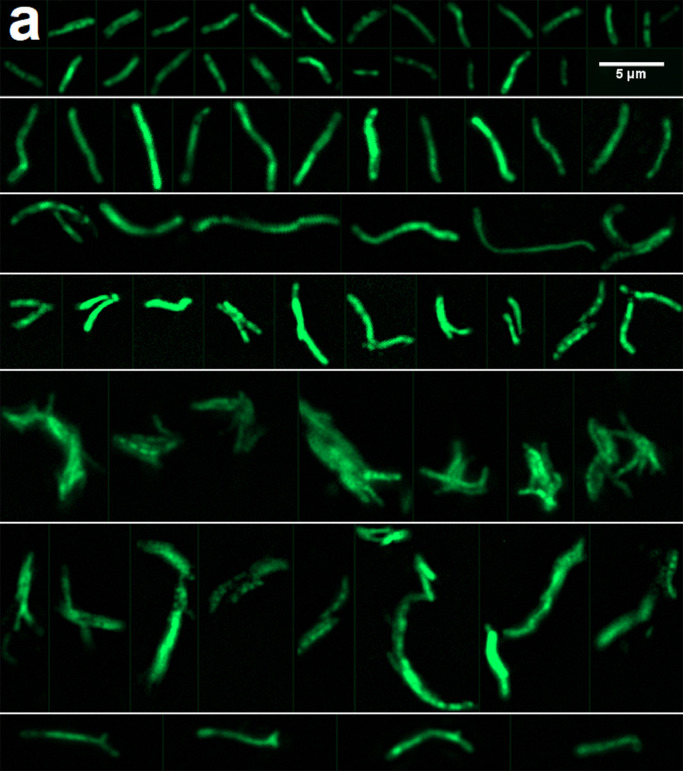
Findings: M. tuberculosis was detected in 27 of 28 recruited participants; 25 (89%) by blood Xpert-ultra, 22 (79%) by DMN-Tre microscopy, and 21 (75%) by Myco/F lytic blood culture. Eight (29%) participants died by 12-week follow-up. In a combined pharmacodynamic model, predicted probabilities of negative DMN-Tre microscopy, blood Xpert-ultra, or blood culture after 72 h treatment were 0·64, 0·27, and 0·94, respectively, in those who survived, compared with 0·23, 0·06, and 0·71 in those who died (posterior probability of slower clearance of MTBBSI in those that died >0·99). DMN-Tre microscopy of blood demonstrated heterogenous bacillary morphologies, including microcolonies and clumps. Bacillary cell-length varied significantly with ATT exposure (mean cell-length increase 0·13 log-µm/day; 95%CrI 0·10-0·16).

Interpretation: Pharmacodynamics of MTBBSI treatment can be captured using DMN-Tre microscopy, blood Xpert-ultra and culture. This could facilitate interventional trials in severe HIV-associated TB.

Funding: Wellcome Trust, NIH Fogarty International Center, South African MRC, NIHR(UK), National Research Foundation of South Africa.

Keywords: Blood stream infection; Critical-illness; HIV-associated tuberculosis; Pharmacodynamics; Sepsis.


Conflict of interest statement

Declaration of interests CRB and MK, are cofounders of OliLux Biosciences which has licensed patents related to the Two dyes presented in this paper. All other authors have declared that no conflict of interest exists.

Figures

Fig 1
Figure 1
Description of clinical phenotype and relationship with outcome and markers of MTBBSI a. Heatmap of binary clinical signs from baseline assessment at time of recruitment (black tile = present, white tile = absent). Participants (rows) and clinical signs (columns) are hierarchically clustered (indicated by row dendrogram), with two highest level clusters of participants indicated by a colour key (cluster A, top ten rows, green; cluster B bottom 18 rows, blue). Each participant's 12-week outcome status and MTBBSI quantification results from day of recruitment are also shown on a navy-yellow colour scale to indicate level of correspondence with the clustered clinical signs data. The figure shows that patient clinical phenotype observed from the bedside, and classified by an unsupervised clustering algorithm, corresponds closely to blood bacillary load measures and risk of mortality. b. The same clinical signs data as above represented in two dimensions using Multiple Correspondence Analysis (MCA). Each point is a participant, with 12-week outcome status indicated by fill-colour, and cluster membership from panel A indicated by outline shape and colour. Also shown are projections of the markers of MTBBSI bacillary load in this MCA space: Pearson's correlation coefficient with MCA dimension 1 and 2 are indicated by arrowhead x and y coordinates respectively. Tables below show regression beta coefficients for univariable models regressing markers of MTBBSI bacillary load and 12-week outcome on MCA dimension 1 and 2, respectively. c. Density histograms showing distribution of 12 key blood results by 12-week outcome status. d. Principal Components Analysis with varimax rotation summarising the same 12 variables. Variables where higher observed values are associated with more adverse clinical status are coloured yellow; variables where lower values are broadly more adverse are coloured blue; and variables where derangement outside normal range in either direction is adverse are coloured grey. e. Projection of individuals and markers of MTBBSI bacillary load in the 2-dimensional blood assay PCA space, with univariable linear models regressing markers of MTBBSI bacillary load and 12-week outcome on PC 1 and 2 respectively. Hb = haemoglobin; MCHC = mean corpuscular haemoglobin concentration; platelets = platelet count x109/L; MPV = mean platelet volume; wcc = total white cell count x109/L; cd4 = CD4+ cell count cells/mm3; urea = serum urea mmol/L, creat = serum creatinine umol/L; Na = serum sodium mmol/L; AST = aspartate transaminase U/L; lactate = venous lactate mmol/L; glucose = venous glucose mmol/L. AST_resid = residual variance in aspartate transaminase after adjusting for alanine transaminase.
Fig 2
Figure 2
Results of serial quantification of MTBBSI during first 3 days of anti-TB therapy Qualitative and quantitative results of three MTBBSI detection methods, with urine Xpert-ultra results as a comparator. a. Time plot showing qualitative results by patient timepoint. pid = Patient identity number from study. Data from 20 patient time-points are missing because either patient had died (n = 3), or was unavailable/declined venesection (n = 17). Remaining non-available samples are from technical failures including contamination and lost samples. b. Proportion of positive test results by time. Valid available tests were used as denominator, as shown in “at risk” table below plot. c. Pairwise agreement between test results assessed by Cohen's Kappa statistic, with hierarchical clustering applied to the pairwise Kappa values shown with dendrogram. d. Quantitative results by timepoint. Lines connect data from individual participants. Negative samples are not plotted for Xpert-ultra and MFL culture; negative DMN-Tre microscopy results plotted as 0 values. e. Univariate (density histogram for x-axis variable) and bivariate (scatter plot) distributions of quantitative results from (D). Bivariable natural cubic spline regression with three degrees of freedom also shown: black line indicates median posterior fitted values; shaded band is 95% interval for posterior fitted values. As assessed by leave-one-out cross-validation based on the posterior likelihood, non-linear cubic spline models had significantly better fit than corresponding linear models for all the observed bivariable distributions, with the exception of blood ∼ urine mean rpoB Ct which is included as a comparator only.
Fig 3
Fig. 3
Ordinal regression modelling pharmacodynamics of MTBBSI bacillary load and relationship with mortality a. Observed values for MTBBSI quantification results on ordinal scale by timepoint, disaggregated by method and outcome status, are shown with coloured lines connecting individual participants’ results. Overlaid on this raw data are predicted values from the ordinal regression model by the three fixed-effect (population-level) predictor variables: timepoint, method and outcome status. Black line indicates median predicted value from 1000 draws from the model posterior predictions; shaded area is the 50% prediction interval (interquartile range for 1000 draws from the model posterior predictions). This prediction interval includes uncertainty in location of the population-level parameters (intercepts and beta coefficients) as well as residual variation and random effects for individual participant; the 50% prediction interval therefore represents simulated values for new unobserved patients drawn from the patient population under study. b. Expected proportions of patients in each ordinal scale category by timepoint, method and outcome status based on model fit. These are mean posterior probabilities for each ordinal category, for an “average” participant (i.e., with random-effects of 0). c. Uncertainty in model fixed-effect (population-level) beta coefficients. Posterior distribution of coefficients are shown with violin plots and box-plots (range, interquartile range and median), on logit scale. For example, median value for the Time in days (slope) coefficient is -0.58; this indicates an odds ratio of exp(-0.58) = 0.56 for difference in bacillary load ordinal distribution toward category 10, per 1-day increase in time since start of ATT; i.e., lower ordinal categories with time. Patients who died had on average greater odds of higher ordinal category distribution compared to those who survived (Died (intercept) coefficient), and a less rapid shift in ordinal distribution towards category 1 over time on ATT (Time * Died interaction (slope) coefficient). DMN-Tre and MFL blood culture ordinal scale distributions on average had lower odds of higher ordinal distribution compared to blood Xpert-ultra. Evidence that coefficients were different from 0 (null effect) in direction indicated is formally tabulated: posterior probability shows proportion of posterior distribution of coefficient estimates > or < 0 as indicated; evidence ratio is the evidence of posterior distributions for and against the stated hypothesis. For example, the model estimates a probability of 99.8% that Time in days (slope) coefficient is less than 0; i.e., that ordinal distribution shifts towards category 1 with time, and 88% probability that this shift is less marked in those that died.
Fig 4
Figure 4
Microscopy analysis of bacillary morphologies in blood using DMN-Tre fluorescence a. DMN-Trehalose microscopy of MTBBSI bacilli. Shown are images from several patients, which have been ordered by bacillary morphological characteristics not by patient. Most bacilli were 2–4 µm long curved rods (top row panel), but cell-lengths 4–6 µm (second row panel) and longer (third row panel) were observed. Homogenous and heterogenous DMN-Tre probe uptake is shown. Doublets were seen (fourth row panel). Microcolonies and clumps were observed in some participants (fifth and sixth row panels). Morphologies suggestive of branching were also occasionally observed (seventh row panel). b. Distribution of measured cell-lengths for 1200 bacilli in blood samples from 10 participants. Bin widths are 0.2 µm. c. Expected and predicted cell-length in µm from mixed-effects regression of log cell-length on time in days, with random intercept and slope by participant. Median and 95 % credible interval for median cell-length are shown (indicating population-level fixed effect of time); outer dashed lines show 95 % prediction interval where 95 % of bacillary lengths are predicted to be in any given patient (indicating random variation between patients plus residual variation). d. Model predicted posterior distribution (boxplots) overlaid on observed cell-length values by participant and timepoint demonstrating model fit to data.

References

    1. Ford N., Matteelli A., Shubber Z., et al. TB as a cause of hospitalization and in-hospital mortality among people living with HIV worldwide: a systematic review and meta-analysis. J Int AIDS Soc. 2016;19(1):20714. - PMC - PubMed
    1. Jacob S.T., Pavlinac P.B., Nakiyingi L., et al. Mycobacterium tuberculosis bacteremia in a cohort of HIV-infected patients hospitalized with severe sepsis in Uganda-high frequency, low clinical suspicion [corrected] and derivation of a clinical prediction score. PLoS One. 2013;8(8):e70305. - PMC - PubMed
    1. Andrews B., Semler M.W., Muchemwa L., et al. Effect of an early resuscitation protocol on in-hospital mortality among adults with sepsis and hypotension: a randomized clinical trial. JAMA. 2017;318(13):1233–1240. - PMC - PubMed
    1. Ford N., Shubber Z., Meintjes G., et al. Causes of hospital admission among people living with HIV worldwide: a systematic review and meta-analysis. Lancet HIV. 2015;2(10):e438–ee44. - PubMed
    1. Barr D.A., Lewis J.M., Feasey N., et al. Mycobacterium tuberculosis bloodstream infection prevalence, diagnosis, and mortality risk in seriously ill adults with HIV: a systematic review and meta-analysis of individual patient data. Lancet Infect Dis. 2020 - PMC - PubMed