. 2022 Mar 7;11(3):510.
doi: 10.3390/antiox11030510.

Apoptosis-Inducing Factor Deficiency Induces Tissue-Specific Alterations in Autophagy: Insights from a Preclinical Model of Mitochondrial Disease and Exercise Training Effects

Affiliations

Apoptosis-Inducing Factor Deficiency Induces Tissue-Specific Alterations in Autophagy: Insights from a Preclinical Model of Mitochondrial Disease and Exercise Training Effects

Sara Laine-Menéndez et al. Antioxidants (Basel). .

Abstract

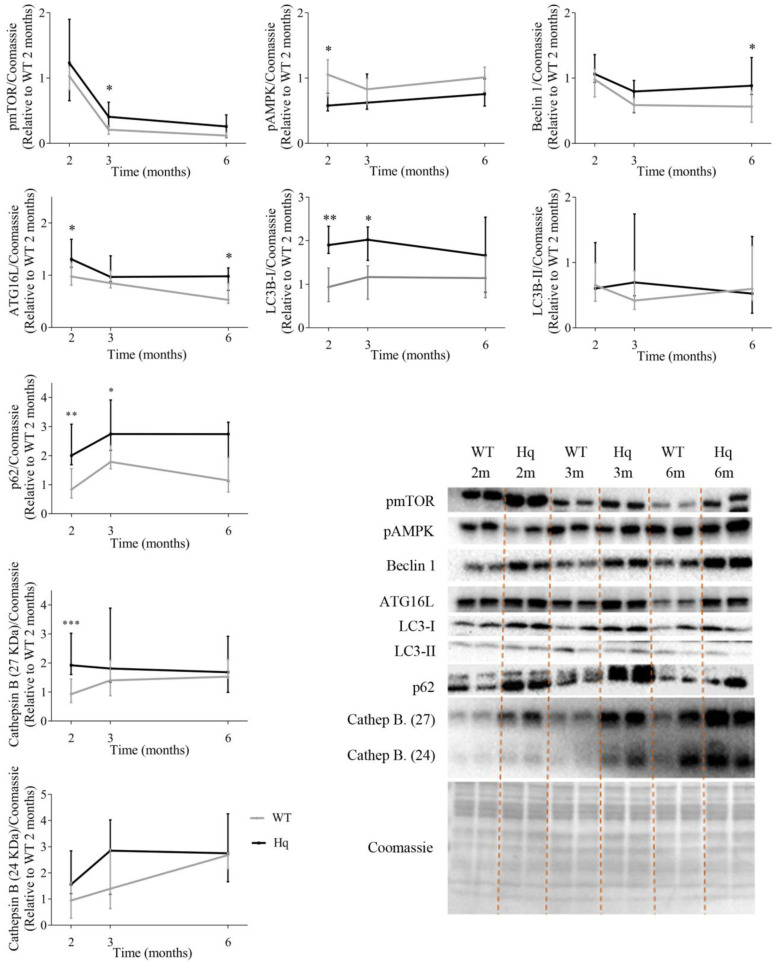
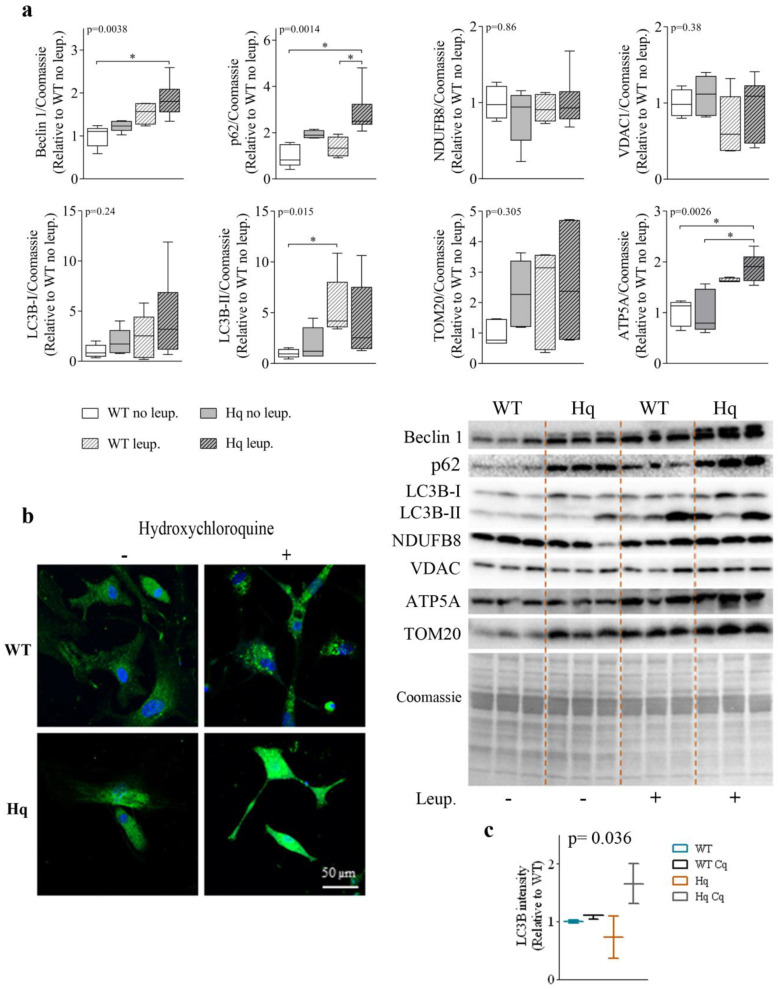
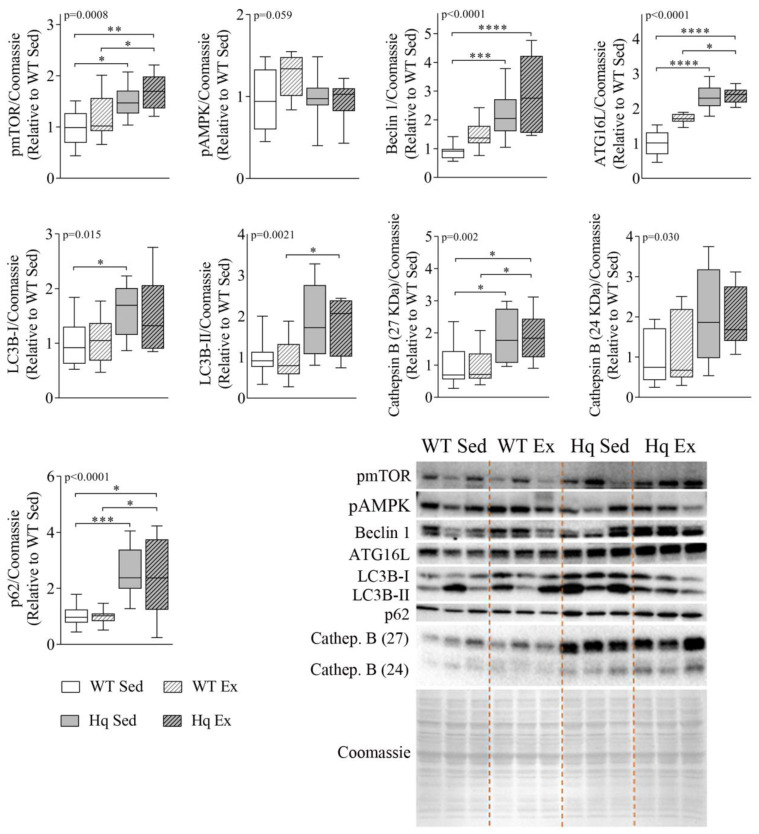
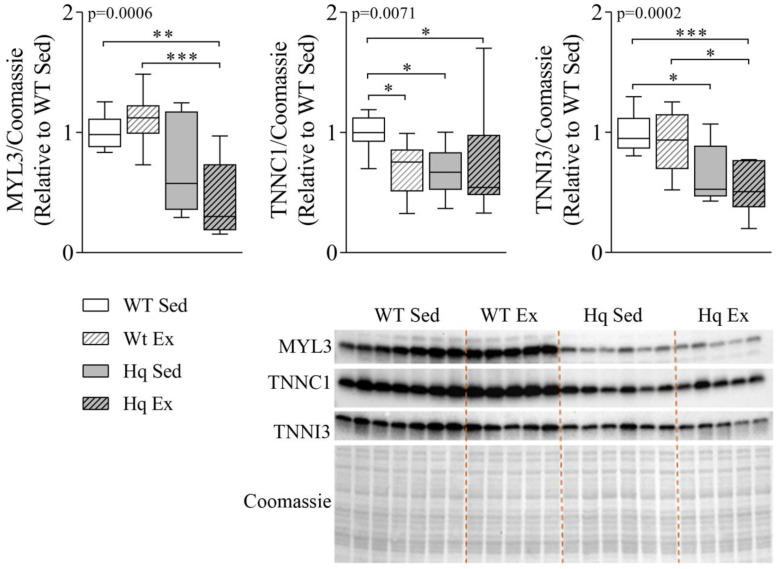
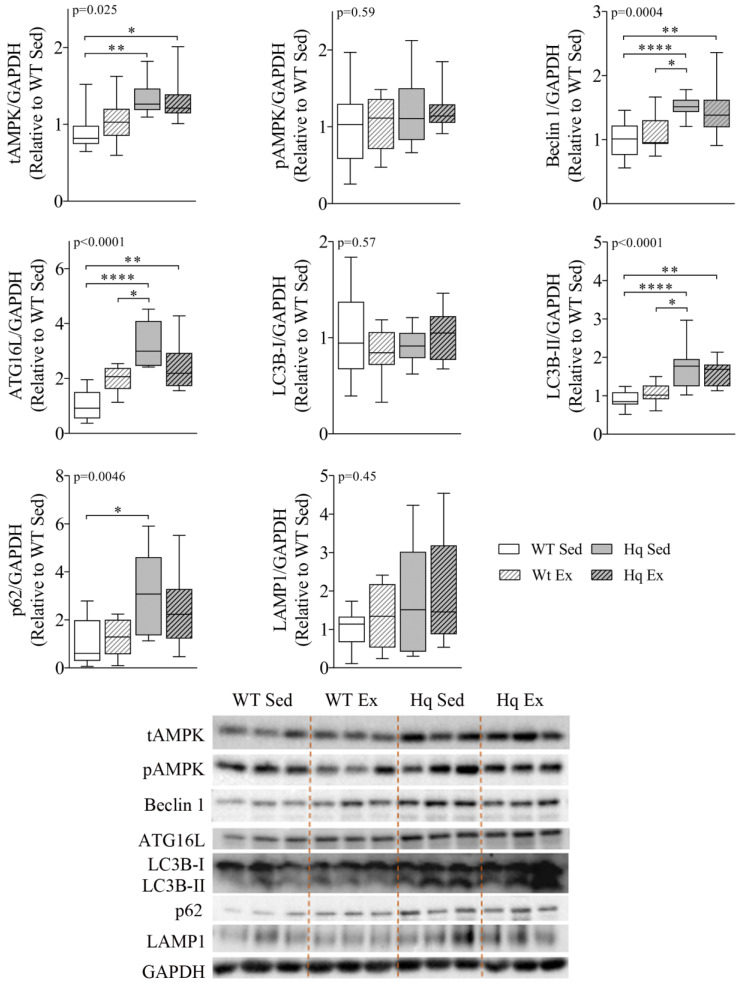
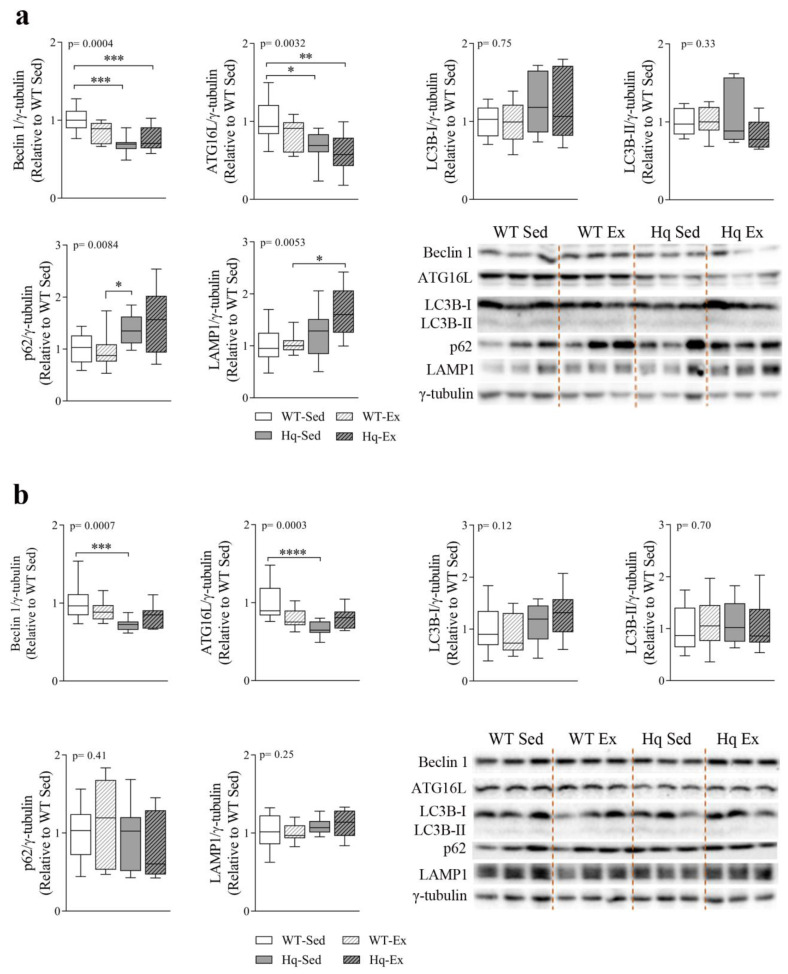
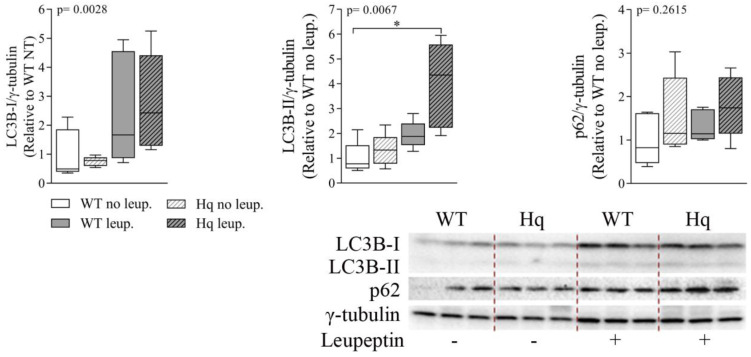
We analyzed the effects of apoptosis-inducing factor (AIF) deficiency, as well as those of an exercise training intervention on autophagy across tissues (heart, skeletal muscle, cerebellum and brain), that are primarily affected by mitochondrial diseases, using a preclinical model of these conditions, the Harlequin (Hq) mouse. Autophagy markers were analyzed in: (i) 2, 3 and 6 month-old male wild-type (WT) and Hq mice, and (ii) WT and Hq male mice that were allocated to an exercise training or sedentary group. The exercise training started upon onset of the first symptoms of ataxia in Hq mice and lasted for 8 weeks. Higher content of autophagy markers and free amino acids, and lower levels of sarcomeric proteins were found in the skeletal muscle and heart of Hq mice, suggesting increased protein catabolism. Leupeptin-treatment demonstrated normal autophagic flux in the Hq heart and the absence of mitophagy. In the cerebellum and brain, a lower abundance of Beclin 1 and ATG16L was detected, whereas higher levels of the autophagy substrate p62 and LAMP1 levels were observed in the cerebellum. The exercise intervention did not counteract the autophagy alterations found in any of the analyzed tissues. In conclusion, AIF deficiency induces tissue-specific alteration of autophagy in the Hq mouse, with accumulation of autophagy markers and free amino acids in the heart and skeletal muscle, but lower levels of autophagy-related proteins in the cerebellum and brain. Exercise intervention, at least if starting when muscle atrophy and neurological symptoms are already present, is not sufficient to mitigate autophagy perturbations.

Keywords: Harlequin; OXPHOS; autophagy; brain; cerebellum; heart; mitochondrial diseases; skeletal muscle.


Conflict of interest statement

The authors declare no conflict of interest. The funders had no role in the design of the study; in the collection, analyses, or interpretation of data; in the writing of the manuscript, or in the decision to publish the results.

Figures

Figure 1
Figure 1
Autophagy proteins in the heart (time course study). Representative Western blots and quantifications of proteins involved in autophagy in total heart homogenates from wild-type (WT) and Harlequin (Hq) male mice at 2, 3 and 6 months (m) (n = 8 mice). Total protein content per lane estimated by Coomassie Blue staining was used as loading control. Data (median and interquartile range) are expressed relative to protein levels in the 2-month-old WT group. Black lines: Hq mice; gray lines: WT mice. Mann–Whitney U-test: * p < 0.05; ** p < 0.01; *** p < 0.001 significantly different from the age-matched WT group. Abbreviations: pmTOR, mTOR phosphorylated at residue Ser2448; pAMPK, AMPK phosphorylated at residue Thr172; ATG16L, autophagy-related protein 16-like; LC3B-I, microtubule-associated protein 1B light chain I; LC3B-II, microtubule-associated protein 1B light chain II; Cathep. B, cathepsin B.
Figure 2
Figure 2
Autophagic flux and mitochondrial markers in the heart. (a) Representative Western blots and quantifications of autophagy (Beclin 1, p62, LC3B-I, LC3B-II) and mitochondrial (NDUFB8, VDAC, TOM20 and ATP5A) markers in heart homogenates of 3-month-old wild-type (WT) and Harlequin (Hq) male mice, whether untreated (no leup.) or treated with leupeptin (leup.) (n = 5–6 mice). Quantification of Western blots. Total protein content per lane estimated by Coomassie Blue staining was used as loading control. Data (median, interquartile range, minimum and maximum values) are expressed relative to the untreated WT group. (b) Representative images of LC3B (green) and nuclei (blue) staining in cardiomyocytes from WT and Hq male neonatal mice untreated (−) and treated (+) with hydroxychloroquine (native colors are shown). (c) Quantification of mean fluorescence intensity of LC3B per cell in untreated and hydroxychloroquine-treated WT and Hq neonatal cardiomyocytes (n = 5–15 cells from 2–3 mice). Data (median and interquartile range) are expressed relative to the untreated WT mean value. p-values for group effect (Kruskal–Wallis test) are shown above the graphs. Symbols for significant differences in post hoc (Dunn’s test) pairwise comparisons: * p < 0.05. Abbreviations: ATP5A, ATP synthase lipid-binding protein; TOM20, mitochondrial import receptor subunit TOM20; NDUF8, mitochondrial NADH dehydrogenase (ubiquinone) 1 beta subcomplex subunit 8; VDAC, voltage-dependent anion-selective channel protein.
Figure 3
Figure 3
Effects of exercise training on autophagy in the heart tissue. Representative Western blots and quantifications of mTOR phosphorylated at residue Ser2448 (pmTOR), AMPK phosphorylated at residue Thr172 (pAMPK), Beclin 1, autophagy-related protein 16-like (ATG16L), microtubule-associated protein 1B light chain I (LC3B-I) and II (LC3B-II), p62 and cathepsin B (Cathep. B), in heart homogenates from wild-type (WT) and Harlequin (Hq), sedentary (Sed) and trained (Ex) mice of the intervention study (n = 10–12 male mice, age 5.3 months). Total protein content per lane estimated by Coomassie Blue staining was used as loading control. Data (median, interquartile range, minimum and maximum values) are relative to the control group (WT Sed). p-values for group effect (Kruskal–Wallis test) are shown above the graphs. Symbols for significant differences in post hoc (Dunn’s test) pairwise comparisons: * p < 0.05; ** p < 0.01; *** p < 0.001; **** p < 0.0001.
Figure 4
Figure 4
Sarcomere protein levels in the heart. Representative Western blots and quantifications of protein levels of myosin light chain 3 (MYL3), troponin C1 (TNNC1) and troponin I (TNNI3) in heart homogenates from wild-type (WT) and Harlequin (Hq), sedentary (Sed) and trained (Ex) mice in the intervention study (n = 10–12 male mice, age 5.3 months). Quantification of Western blots. Total protein content per lane estimated by Coomassie Blue staining was used as loading control. Significant p-values for group effect (Kruskal–Wallis test) are shown above the graphs. Symbols for significant differences in post hoc (Dunn’s test) pairwise comparisons: * p < 0.05; ** p < 0.01; *** p < 0.001.
Figure 5
Figure 5
Autophagy proteins and effects of exercise training in skeletal muscle. Representative Western blots and quantifications of total AMPK (tAMPK), AMPK phosphorylated at residue Thr172 (pAMPK), autophagy-related protein 16-like (ATG16L), Beclin 1, microtubule-associated protein 1B light chain I (LC3B-I) and II (LC3B-II), p62 and lysosomal-associated membrane protein 1 (LAMP1) in biceps femoris homogenates from wild-type (WT) and Harlequin (Hq), sedentary (Sed) and exercise-trained (Ex) mice in the intervention study (n = 10–12 male mice, age 5.3 months). GAPDH was used as protein loading control. Data (median, interquartile range, minimum and maximum values) are relative to the control group (WT Sed). p-values for group effect (Kruskal–Wallis test) are shown above the graphs. Symbols for significant differences in post hoc (Dunn’s test) pairwise comparisons: * p < 0.05; ** p < 0.01; **** p < 0.0001.
Figure 6
Figure 6
Autophagy proteins and effects of exercise training in central nervous system. Representative Western blot and densitometry analysis of autophagy-related protein 16-like (ATG16L), Beclin 1, microtubule-associated protein 1B light chain I (LC3B-I) and II (LC3B-II), p62 and lysosomal-associated membrane protein (LAMP1) in cerebellum (a) and brain (b) homogenates of wild-type (WT) and Harlequin (Hq), sedentary (Sed) and exercise-trained (Ex) mice of the intervention study (n = 10–12 male mice, age 5.3 months). γ-tubulin was used as protein loading control. Data (median, interquartile range, minimum and maximum values) are relative to the control group (WT Sed). p-values for group effect (Kruskal–Wallis test) are shown in the above graphs. Symbols for significant differences in post hoc (Dunn’s test) pairwise comparisons: * p < 0.05; ** p < 0.01; *** p < 0.001; **** p < 0.0001.
Figure 7
Figure 7
Autophagic flux analysis in the cerebellum. Representative Western blots and quantifications of autophagy markers p62, microtubule-associated protein 1B light chain I (LC3B-I) and II (LC3B-II), in cerebellum homogenates of 3-month-old wild-type (WT) and Harlequin (Hq) mice, untreated (no leup.) and treated with leupeptin (leup.) (n = 5–6 male mice). γ-tubulin was used as protein loading control. Data (median, interquartile range, minimum and maximum values) are expressed relative to untreated WT group. p-values for group effect (Kruskal–Wallis test) are shown in the above graphs. Symbols for significant differences in post hoc (Dunn’s test) pairwise comparisons: * p < 0.05.

Similar articles

References

    1. Schaefer A.M., Taylor R.W., Turnbull D.M., Chinnery P.F. The epidemiology of mitochondrial disorders—Past, present and future. Biochim. Biophys. Acta (BBA)-Bioenerg. 2004;1659:115–120. doi: 10.1016/j.bbabio.2004.09.005. - DOI - PubMed
    1. Mcfarland R., Turnbull D.M. Batteries not included: Diagnosis and management of mitochondrial disease. J. Intern. Med. 2009;265:210–228. doi: 10.1111/j.1365-2796.2008.02066.x. - DOI - PubMed
    1. Hüttemann M., Lee I., Pecinova A., Pecina P., Przyklenk K., Doan J.W. Regulation of oxidative phosphorylation, the mitochondrial membrane potential, and their role in human disease. J. Bioenerg. Biomembr. 2008;40:445–456. doi: 10.1007/s10863-008-9169-3. - DOI - PubMed
    1. Ghezzi D., Zeviani M. Human diseases associated with defects in assembly of OXPHOS complexes. Essays Biochem. 2018;62:271–286. - PMC - PubMed
    1. Emperador S., Garrido-Pérez N., Amezcua-Gil J., Gaudó P., Andrés-Sanz J.A., Yubero D., Fernández-Marmiesse A., O’Callaghan M.M., Escobar J.D.O., Iriondo M., et al. Molecular Characterization of New FBXL4 Mutations in Patients with mtDNA Depletion Syndrome. Front. Genet. 2019;10:1300. doi: 10.3389/fgene.2019.01300. - DOI - PMC - PubMed

LinkOut - more resources