. 2022 Mar 8;11(3):514.
doi: 10.3390/antiox11030514.

Vitamin K2 (Menaquinone-7) Reverses Age-Related Structural and Cognitive Deterioration in Naturally Aging Rats

Affiliations

Vitamin K2 (Menaquinone-7) Reverses Age-Related Structural and Cognitive Deterioration in Naturally Aging Rats

Hany A Elkattawy et al. Antioxidants (Basel). .

Abstract

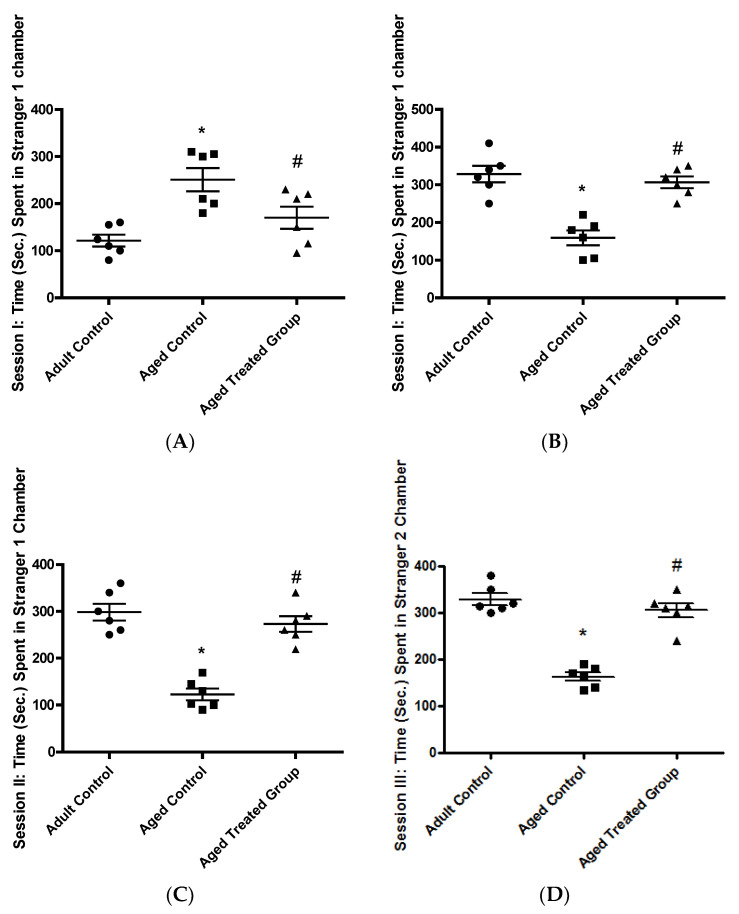
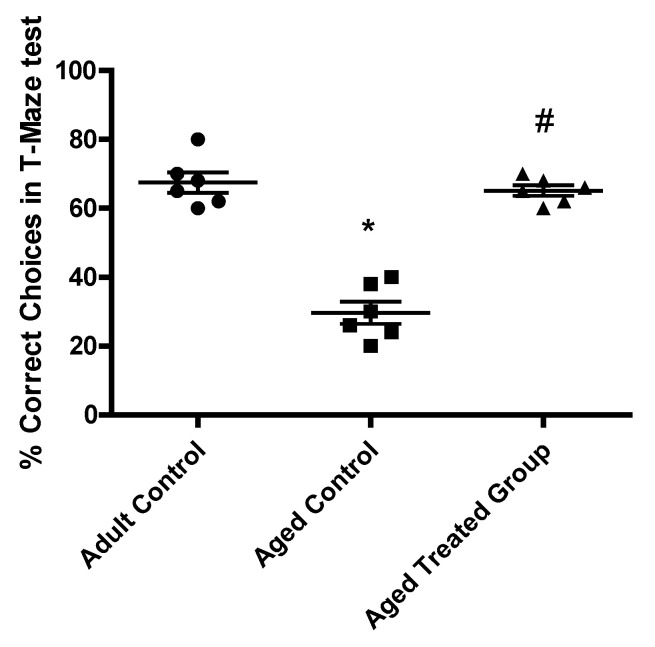
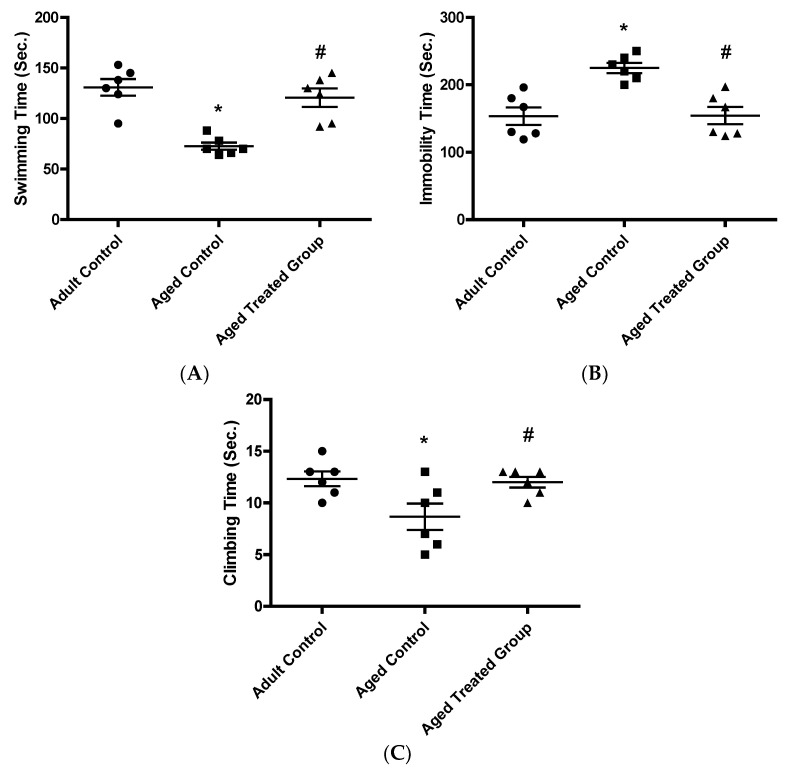
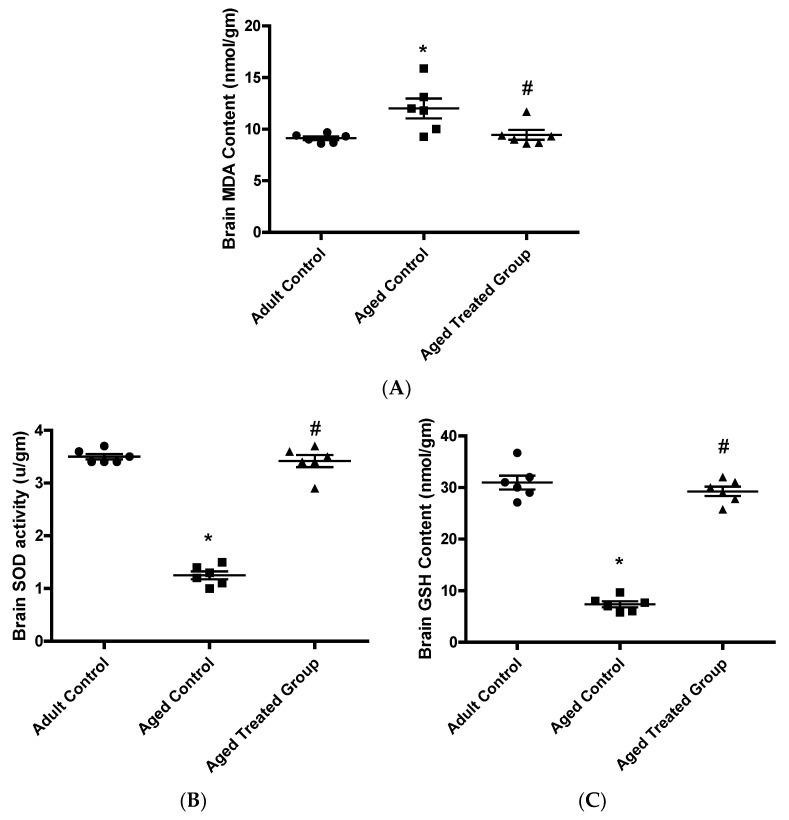
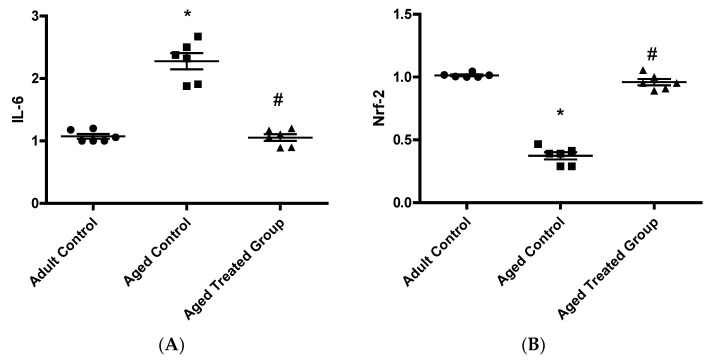
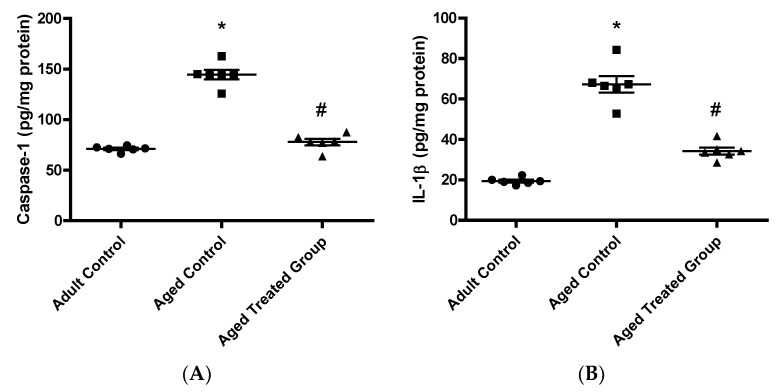
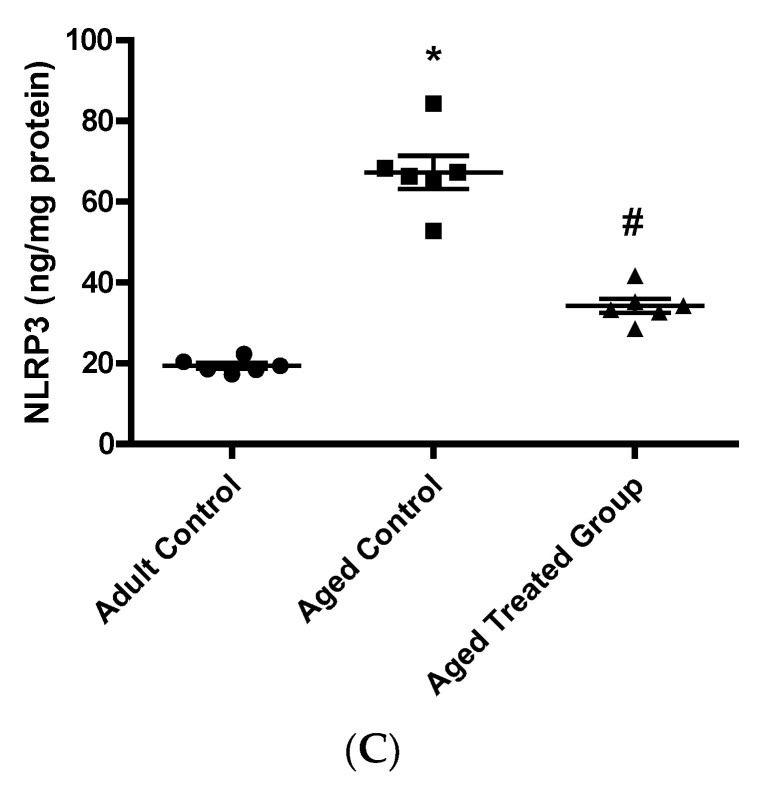
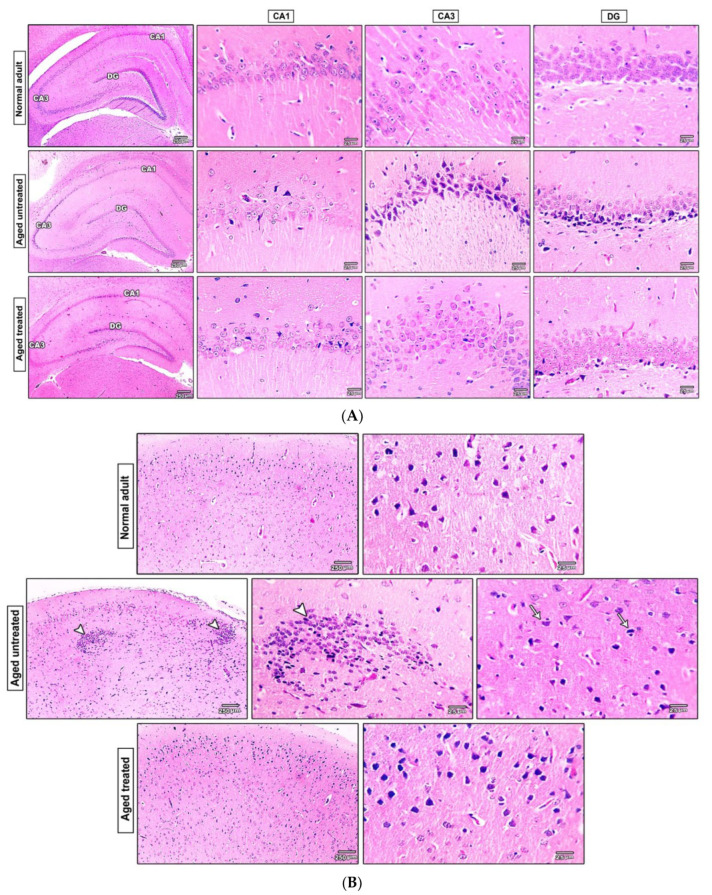
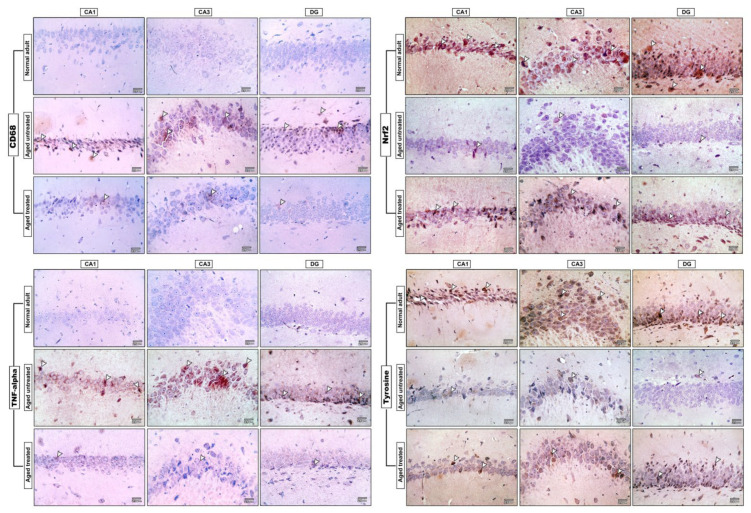
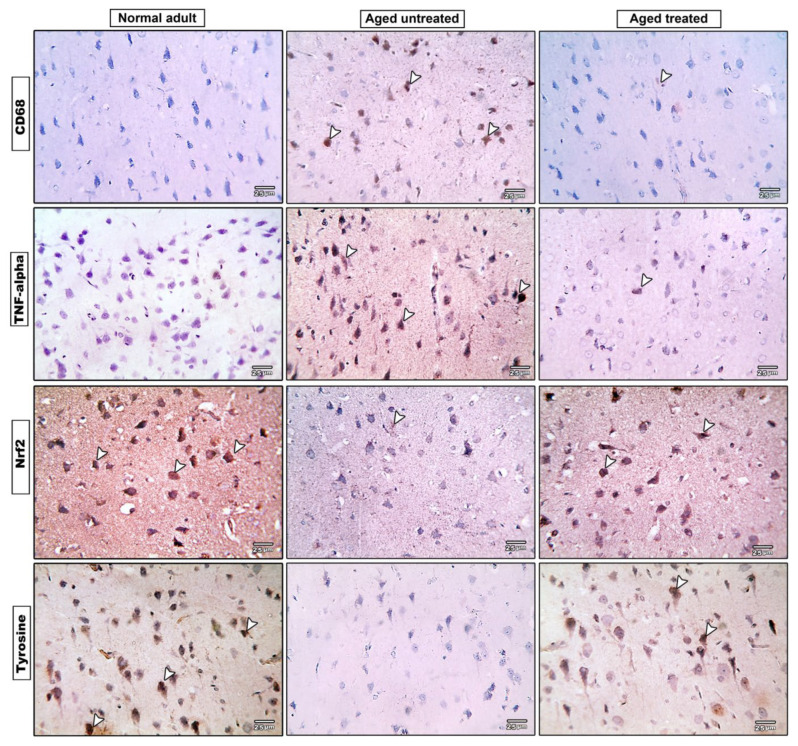
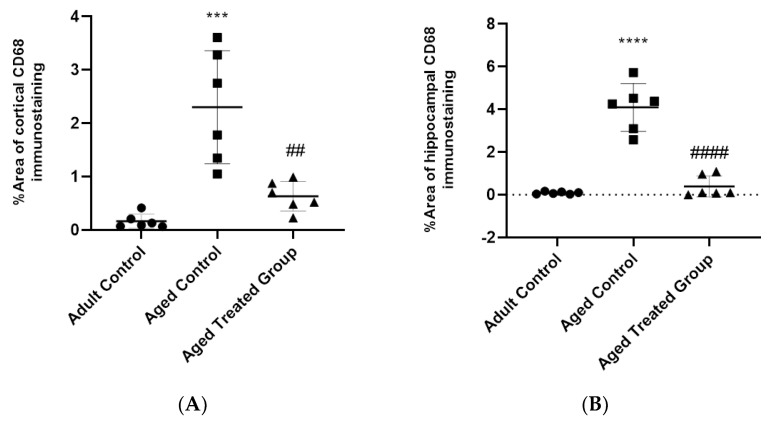
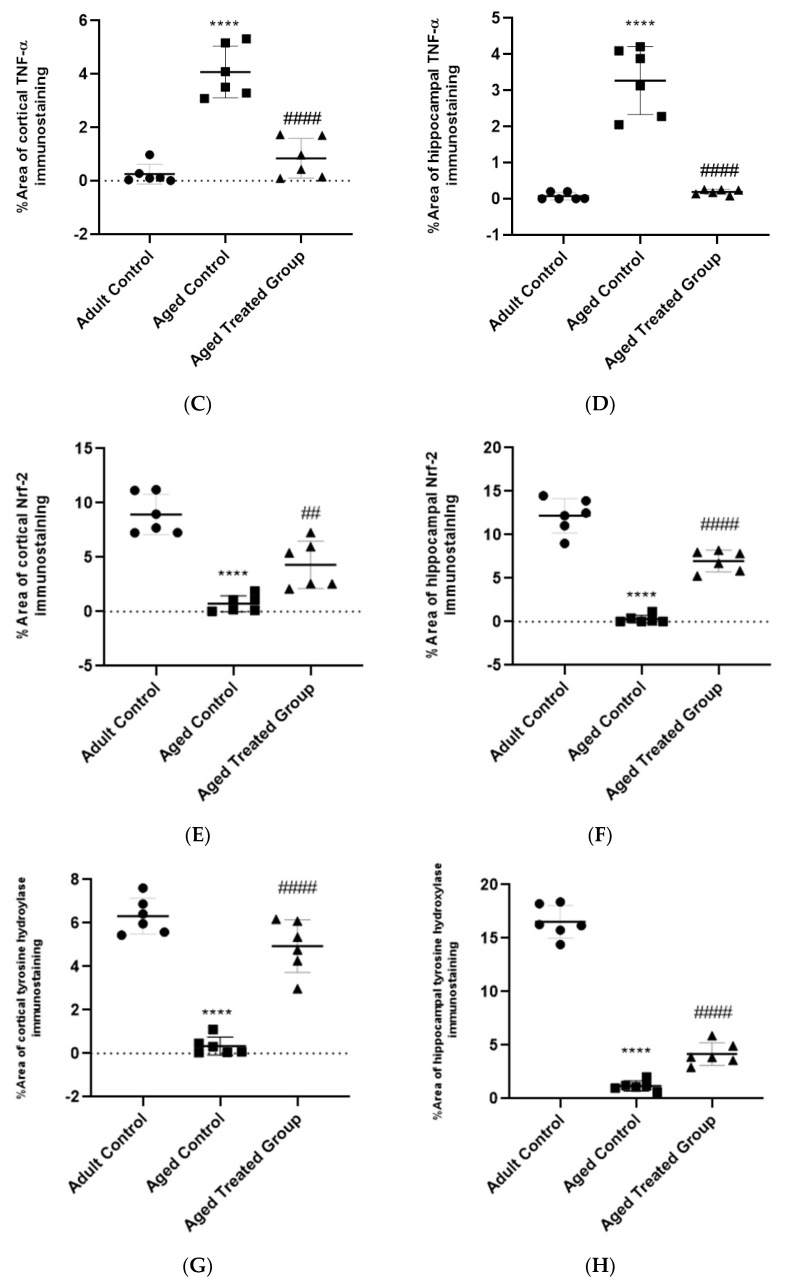
Aging is a naturally occurring process inevitably affecting each living human. The brain is adversely affected by aging with increased risks of developing various neurological disorders. Thus, it is essential to investigate practical approaches that can counteract the impact of aging on the brain. Vitamin K2 (Vit. K2) is a naturally occurring vitamin with reported valuable therapeutic effects. The current study highlights the role of Vit. K2 administration in counteracting age-related changes in the brain using naturally aging rats. Three-month-old rats were assigned to two groups: an ageing control group receiving a drug vehicle and an ageing group orally gavaged with Vit. K2 (30 mg/kg, once daily 5 days per week). Treatment was continued for 17 months. Ten three-month-old rats were used as the adult control. Vit. K2 improved functional performance, reduced social anxiety, depressive-like behavior, and enhanced memory performance with concomitant preservation of hippocampal and cerebral cortex tyrosine hydroxylase expression. Biochemically, Vit. K2 administration restored oxidative-anti-oxidative homeostasis in the brain. Vit. K2 modulated inflammatory signaling, as evidenced by suppression in the brain of NLRP3, caspase-1, Il-1β, TNFα, IL-6, and CD68 expression. Concomitantly, histopathological examination revealed consistent hippocampal and cerebral cortex improvement. Thus, it can be inferred that Vit K2 can slow down age-related changes in the brain associated with modulation of NLRP3/caspase-1/Nrf-2 signaling.

Keywords: NLRP3; Vit. K2; aging; cerebral; hippocampus; tyrosine.


Conflict of interest statement

The authors declare no conflict of interest.

Figures

Figure 1
Figure 1
Effect of Vit. K2 administration on social anxiety behavioral test. (A) Session I: Time (sec.) spent in the empty chamber, (B) Session I: Time (sec.) spent in stranger chamber 1, (C) Session II: Time (sec.) spent in stranger chamber 1, and (D) Session II: Time (sec.) spent in stranger II chamber. The rats were orally gavaged with viz. K2 (30 mg/kg) once daily 5 days per week for 17 months. Data are expressed as mean ± SE. Statistical analysis was conducted using (ANOVA) followed by Tukey–Kramer’s post hoc test, (n = 6, p ≤ 0.05). * Significance versus adult control; # significance versus aged control.
Figure 2
Figure 2
Effect of Vit. K2 administration on memory performance—% correct choices in T-maze test. The rats were orally gavaged with Vit. K2 (30 mg/kg) once daily 5 days per week for 17 months. Data are expressed as mean ± SE. Statistical analysis was conducted using (ANOVA) followed by Tukey–Kramer’s post hoc test (n = 6, p ≤ 0.05). * Significance versus adult control; # significance versus aged control.
Figure 3
Figure 3
Effect of Vit. K2 administration on depressive-like behavior: forced swimming test (FST). (A) Swimming time (sec.), (B) Immobility time (sec.), and (C) Climbing time (sec.). The rats were orally gavaged with Vit. K2 (30 mg/kg) once daily 5 days per week for 17 months. Data are expressed as mean ± SE. Statistical analysis was conducted using (ANOVA) followed by Tukey–Kramer’s post hoc test, (n = 6, p ≤ 0.05). * Significance versus adult control; # significance versus aged control.
Figure 4
Figure 4
Effect of Vit. K2 administration on frontal cortex and hippocampus oxidative/anti-oxidative biomarkers. (A) MDA content, (B) SOD activity, and (C) GSH concentration. The rats were orally gavaged with Vit. K2 (30 mg/kg) once daily 5 days per week for 17 months. Data are expressed as mean ± SE. Statistical analysis was conducted using (ANOVA) followed by Tukey–Kramer’s post hoc test, (n = 6, p ≤ 0.05). * Significance versus adult control, # significance versus aged control.
Figure 5
Figure 5
Effect of Vit. K2 administration on frontal cortex and hippocampal relative gene expression of (A) IL-6 and (B) Nrf-2. The rats were orally gavaged with Vit. K2 (30 mg/kg) once daily 5 days per week for 17 months. Data are expressed as mean ± SE. Statistical analysis was conducted using (ANOVA) followed by Tukey–Kramer’s post hoc test (n = 6, p ≤ 0.05). * Significance versus adult control; # significance versus aged control.
Figure 6
Figure 6
Effect of Vit. K2 administration on frontal cortex and hippocampus content of: (A) caspase-1, (B) IL-1β1 and (C) NLRP3. The rats were orally gavaged with Vit. K2 (30 mg/kg) once daily 5 days per week for 17 months. Data are expressed as mean ± SE. Statistical analysis was conducted using (ANOVA) followed by Tukey–Kramer’s post hoc test, (n = 6, p ≤ 0.05). * Significance versus adult control; # significance versus aged control.
Figure 6
Figure 6
Effect of Vit. K2 administration on frontal cortex and hippocampus content of: (A) caspase-1, (B) IL-1β1 and (C) NLRP3. The rats were orally gavaged with Vit. K2 (30 mg/kg) once daily 5 days per week for 17 months. Data are expressed as mean ± SE. Statistical analysis was conducted using (ANOVA) followed by Tukey–Kramer’s post hoc test, (n = 6, p ≤ 0.05). * Significance versus adult control; # significance versus aged control.
Figure 7
Figure 7
(A) Microscopic pictures of HE-stained hippocampal sections showing normal neurons in 3 examined regions, CA1, CA3, and DG, in adult control. Hippocampal sections from the untreated aged group showed degenerated neurons exhibiting acidophilic cytoplasm and dark nuclei (arrows) in 3 examined regions but most prominent in CA3 and DG. Hippocampal sections from Vit. K2-treated rats for 17 months showing few degenerated neurons (arrows) in CA1 and DG with improved histological picture of CA3. Magnifications ×40 bar 200 and ×400 bar 25. (B) Microscopic pictures of HE-stained cerebral cortical sections showing normal pyramidal cells and glial cells in the adult group. Cerebral cortical sections from the adult control group showing multifocal areas of gliosis around degenerated neurons (arrowheads) with satellitosis (arrows). Cerebral cortical sections from the treated aged group showed normal histology of pyramidal cells and glial cells, ×400 bar 25.
Figure 8
Figure 8
Microscopic pictures of immuno-stained hippocampal, CA1, CA3 and DG sections against CD68, TNF-alpha, Nrf2 and tyrosine hydroxylase. IHC counterstained with Mayer’s hematoxylin. Arrow heads point to positively stained neurons (×400 bar 25).
Figure 9
Figure 9
Microscopic pictures of immuno-stained cerebral cortical (CC) sections against CD68, TNF-alpha, Nrf2 and tyrosine hydroxylase. IHC counterstained with Mayer’s hematoxylin. Arrow heads point to positively stained neurons (×400 bar 25).
Figure 10
Figure 10
% area of immuno-staining cortical and hippocampal CD68 (A,B), TNF-alpha (C,D), Nrf2 (E,F) and tyrosine hydroxylase (G,H). Data are expressed as mean ± SE. Statistical analysis was conducted using (ANOVA) followed by Tukey–Kramer’s post hoc test, (n = 6, p ≤ 0.05). *** Significance versus adult control at p ˂ 0.001; **** Significance versus adult control at p ˂ 0.0001; ## significance versus aged control at p ˂ 0.01, #### at p ˂ 0.0001.
Figure 10
Figure 10
% area of immuno-staining cortical and hippocampal CD68 (A,B), TNF-alpha (C,D), Nrf2 (E,F) and tyrosine hydroxylase (G,H). Data are expressed as mean ± SE. Statistical analysis was conducted using (ANOVA) followed by Tukey–Kramer’s post hoc test, (n = 6, p ≤ 0.05). *** Significance versus adult control at p ˂ 0.001; **** Significance versus adult control at p ˂ 0.0001; ## significance versus aged control at p ˂ 0.01, #### at p ˂ 0.0001.

Similar articles

Cited by

References

    1. Luo J., Si H., Jia Z., Liu D. Dietary Anti-Aging Polyphenols and Potential Mechanisms. Antioxidants. 2021;10:283. doi: 10.3390/antiox10020283. - DOI - PMC - PubMed
    1. Kandlur A., Satyamoorthy K., Gangadharan G. Oxidative Stress in Cognitive and Epigenetic Aging: A Retrospective Glance. Front. Mol. Neurosci. 2020;13:41. doi: 10.3389/fnmol.2020.00041. - DOI - PMC - PubMed
    1. Elobeid A., Libard S., Leino M., Popova S.N., Alafuzoff I. Altered Proteins in the Aging Brain. J. Neuropathol. Exp. Neurol. 2016;75:316–325. doi: 10.1093/jnen/nlw002. - DOI - PMC - PubMed
    1. Peters R. Ageing and the brain. Postgrad. Med. J. 2006;82:84–88. doi: 10.1136/pgmj.2005.036665. - DOI - PMC - PubMed
    1. Melzer T.M., Manosso L.M., Yau S.-Y., Gil-Mohapel J., Brocardo P.S. In Pursuit of Healthy Aging: Effects of Nutrition on Brain Function. Int. J. Mol. Sci. 2021;22:5026. doi: 10.3390/ijms22095026. - DOI - PMC - PubMed

LinkOut - more resources