. 2022 Mar 16;11(3):560.
doi: 10.3390/antiox11030560.

A Metabolic Network Mediating the Cycling of Succinate, a Product of ROS Detoxification into α-Ketoglutarate, an Antioxidant

Affiliations

A Metabolic Network Mediating the Cycling of Succinate, a Product of ROS Detoxification into α-Ketoglutarate, an Antioxidant

Félix Legendre et al. Antioxidants (Basel). .

Abstract

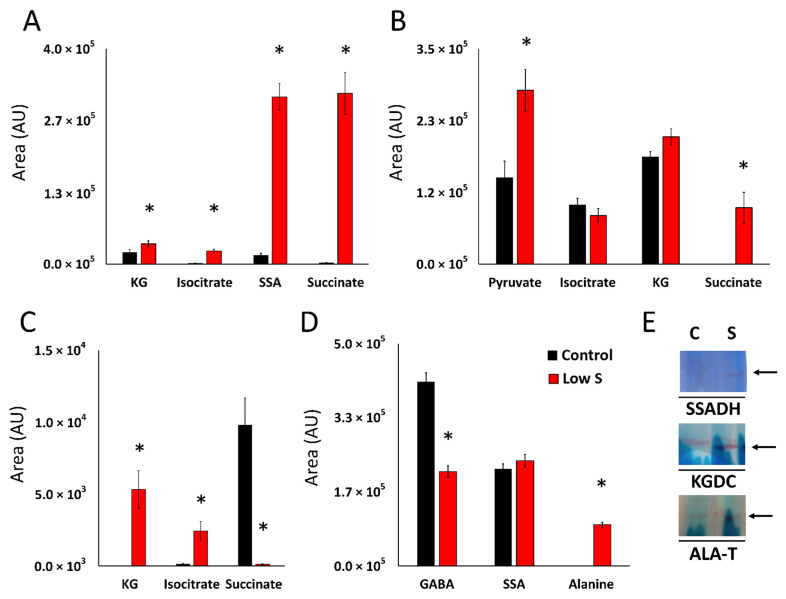
Sulfur is an essential element for life. However, the soil microbe Pseudomonas (P.) fluorescens can survive in a low sulfur environment. When cultured in a sulfur-deficient medium, the bacterium reprograms its metabolic pathways to produce α-ketoglutarate (KG) and regenerate this keto-acid from succinate, a by-product of ROS detoxification. Succinate semialdehyde dehydrogenase (SSADH) and KG decarboxylase (KGDC) work in partnership to synthesize KG. This process is further aided by the increased activity of the enzymes glutamate decarboxylase (GDC) and γ-amino-butyrate transaminase (GABAT). The pool of succinate semialdehyde (SSA) generated is further channeled towards the formation of the antioxidant. Spectrophotometric analyses, HPLC experiments and electrophoretic studies with intact cells and cell-free extracts (CFE) pointed to the metabolites (succinate, SSA, GABA) and enzymes (SSADH, GDC, KGDC) contributing to this KG-forming metabolic machinery. Real-time polymerase chain reaction (RT-qPCR) revealed significant increase in transcripts of such enzymes as SSADH, GDC and KGDC. The findings of this study highlight a novel pathway involving keto-acids in ROS scavenging. The cycling of succinate into KG provides an efficient means of combatting an oxidative environment. Considering the central role of KG in biological processes, this metabolic network may be operative in other living systems.

Keywords: KG; glutamate decarboxylase; metabolic network; oxidative stress; succinate recycling; sulfur stress.


Conflict of interest statement

The authors declare no conflict of interest.

Figures

Figure 1
Figure 1
Oxidative stressed provoked by sulfur starvation leads to succinate accumulation in P. fluorescens. (A). HPLC chromatogram of a spent fluid sample from P. fluorescens grown in control conditions. (B). HPLC chromatogram of a spent fluid sample from P. fluorescens grown in media with no added sulfur. The X axis shows retention time in minutes and the y axis shows absorbance at 210 nm in arbitrary units (AU). (C*). Enzymatic activity analysis of TCA cycle and oxidative phosphorylation enzymes by Blue Native polyacrylamide gel electrophoresis (BN-PAGE). Fumarase, α-ketoglutarate dehydrogenase (KGDH) and (Complex I-IV) activities are decreased in the stressed cells. (D). Enzymatic activity analysis of fumarate reductase (FRD) and isocitrate lyase (ICL). FRD and ICL activities are increased under sulfur starvation. The nature of FRD was confirmed by cutting the band and incubating it in reaction buffer with 2 mM fumarate and 0.2 mM NADH. Detection of succinate was done by running the reaction mixture in the HPLC after 24 h. C = Control, S = Low sulfur. (E). Enzymatic assays of select enzymes with appropriate substrates by measuring the absorbance of NADH at 340 nm. The rate of reaction was calculated using the slope of absorbance change per minute. The control sample was normalized to 1 and the stressed rate was compared to it, data is shown as relative activity. (Q = glutamine, IC = isocitrate, KG = α -ketoglutarate) Data are represented as means ± standard deviation and is representative of three (3) distinct experiments. n = 3, * = p < 0.05.
Figure 2
Figure 2
Metabolite profiling in P. fluorescens cell free extract and intact cells in control and sulfur-deficient conditions. (A). HPLC chromatogram of a cell free extract from P. fluorescens grown in control conditions. (B). HPLC chromatogram of a cell free extract sample from P. fluorescens grown in a media with no added sulfur. Peaks corresponding to glutamate (E), isocitrate (IC), γ-aminobutyric acid (GABA), α-ketoglutarate (KG) and succinate semialdehyde (SSA) are shown. (C). Quantification of select metabolites in cell free extract samples of P. fluorescens grown in control and sulfur-deficient (Low S) conditions. Enrichment in GABA, SSA and KG is seen in sample from sulfur-deficient grown cells. (D,E). HPLC chromatogram of whole cells P. fluorescens control (D) and low sulfur (E) cells incubated with 10 mM glutamate for two hours. (F). Quantification of metabolites in whole P. fluorescens cells grown in control and sulfur-deficient (Low S) conditions fed with 5 mM glutamate and incubated for two hours. (G). Quantification of metabolites in whole P. fluorescens cells grown in control and sulfur-limited (Low S) conditions fed with 10 mM succinate, 10 mM HCO3 and incubated for two hours. Succinate metabolism leads to enrichment in KG. Data are represented as means ± standard deviation. n = 3, * = p < 0.05.
Figure 3
Figure 3
Multiple routes to α-ketoglutarate in P. fluorescens subject to sulfur starvation. (A). Quantification of metabolites in membrane cell free extracts of P. fluorescens grown in control and limited-sulfur (Low S) conditions incubated with 5 mM glutamine for 60 min. Glutamine utilization leads to enrichment of KG, Isocitrate, SSA and succinate. (B). Quantification of metabolites in cell free extracts of P. fluorescens grown in control (black) and sulfur-limited (red) conditions incubated with 5 mM isocitrate for 60 min. Isocitrate metabolism leads to enrichment of KG, succinate and pyruvate. (C). Quantification of metabolites in cell free extracts of P. fluorescens grown in control and sulfur-limited (Low S) conditions incubated with 5 mM succinate, 10 mM HCO3 for 60 min. Succinate metabolism results in the production of isocitrate and KG. (D). Quantification of metabolites in membrane cell free extracts of P. fluorescens grown in control and sulfur-deficient (Low S) conditions incubated with 5 mM GABA, 5 mM pyruvate for 60 min. Production of alanine, a by-product of GABAT is identified. (E). Activity analysis by BN-PAGE of succinate semialdehyde dehydrogenase (SSADH), α-ketoglutarate decarboxylase (KGDC) and alanine transaminase (ALA-T). SSADH, KGDC and ALA-T. C = control, S = low sulfur. Data are represented as means ± standard deviation. n = 3, * = p < 0.05.
Figure 4
Figure 4
Gene expression profiling of genes involved in KG regeneration under sulfur starvation in Pseudomonas fluorescens. The qRT-PCR experiments were performed using primer pairs from Table 1. Relative expression of mRNA transcripts in comparison to control conditions in cells at the late exponential phase was determined using the ΔΔCt method. GDC = glutamate decarboxylase, ICL = isocitrate lyase, KGDC = α-ketoglutarate decarboxylase, SSADH = succinate semialdehyde dehydrogenase, FRD = fumarate reductase = ICDH (NAD+) = NAD+-dependent isocitrate dehydrogenase, SDH = succinate dehydrogenase. n = 4, * = p < 0.05.
Figure 5
Figure 5
Schematic representation of the metabolic pathway used by P. fluorescens to combat sulfur starvation. The dicarboxylic acid is regenerated into KG by SSADH and KGDC. The enzymes ICL and FRD contribute to the succinate pool of succinate while GDC and GABAT maintain SSA homeostasis. ICL = isocitrate lyase, FRD = fumarate reductase, SSADH = succinate semialdehyde dehydrogenase, SDH = succinate dehydrogenase, KGDC = α-ketoglutarate decarboxylase, GABAT = GABA transaminase, GDC = glutamate decarboxylase, GDH = glutamate dehydrogenase, KG = α- ketoglutarate, SSA = succinate semialdehyde. formula image = Cycle producing KG from glutamate, formula image = Regeneration of KG from succinate, the product of ROS detoxification.

Similar articles

Cited by

References

    1. Finkel T., Holbrook N.J. Oxidants, oxidative stress and the biology of ageing. Nature. 2000;408:239–247. doi: 10.1038/35041687. - DOI - PubMed
    1. Green J., Paget M.S. Bacterial redox sensors. Nat. Rev. Microbiol. 2004;2:954–966. doi: 10.1038/nrmicro1022. - DOI - PubMed
    1. Ferguson G.D., Bridge W.J. The glutathione system and the related thiol network in Caenorhabditis elegans. Redox Biol. 2019;24:101171. doi: 10.1016/j.redox.2019.101171. - DOI - PMC - PubMed
    1. Middaugh J., Hamel R., Jean-Baptiste G., Beriault R., Chenier D., Appanna V.D. Aluminum triggers decreased aconitase activity via Fe-S cluster disruption and the overexpression of isocitrate dehydrogenase and isocitrate lyase: A metabolic network mediating cellular survival. J. Biol. Chem. 2005;280:3159–3165. doi: 10.1074/jbc.M411979200. - DOI - PubMed
    1. Mailloux R.J., Bériault R., Lemire J., Singh R., Chénier D.R., Hamel R.D., Appanna V.D. The tricarboxylic acid cycle, an ancient metabolic network with a novel twist. PLoS ONE. 2007;2:e690. doi: 10.1371/journal.pone.0000690. - DOI - PMC - PubMed

LinkOut - more resources