Combination Effects of Metformin and a Mixture of Lemon Balm and Dandelion on High-Fat Diet-Induced Metabolic Alterations in Mice
- PMID: 35326230
- PMCID: PMC8945168
- DOI: 10.3390/antiox11030580
Combination Effects of Metformin and a Mixture of Lemon Balm and Dandelion on High-Fat Diet-Induced Metabolic Alterations in Mice
Abstract
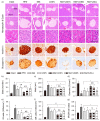
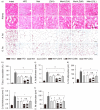
Metformin, the first-line drug for type 2 diabetes mellitus (T2DM), has additional effects on improvements of nonalcoholic fatty liver disease (NAFLD); however, there are no treatments for both T2DM and NAFLD. Previous studies have shown hepatoprotective effects of a mixture of lemon balm and dandelion (LD) through its antioxidant and anti-steatosis properties. Thus, combination effects of metformin and LD were examined in a high-fat diet (HFD)-induced metabolic disease mouse model. The model received an oral administration of distilled water, monotherapies of metformin and LD, or a metformin combination with LD for 12 weeks. The HFD-induced weight gain and body fat deposition were reduced more by the combination than either monotherapy. Blood parameters for NAFLD (i.e., alanine aminotransferase and triglyceride), T2DM (i.e., glucose and insulin), and renal functions (i.e., blood urea nitrogen and creatinine) were reduced in the combination. The combination further enhanced hepatic antioxidant activities, and improved insulin resistance via the AMP-activated protein kinase and lipid metabolism pathways. Histopathological analyses revealed that the metformin combination ameliorated the hepatic hypertrophy/steatosis, pancreatic endocrine/exocrine alteration, fat tissue hypertrophy, and renal steatosis, more than either monotherapy. These results suggest that metformin combined with LD can be promising for preventing and treating metabolic diseases involving insulin resistance.
Keywords: HFD; NAFLD; T2DM; combination; dandelion; dyslipidemia; kidney; lemon balm; metformin; obesity.
Conflict of interest statement
The authors declare no conflict of interest.
Figures


Similar articles
-
Preventive and Therapeutic Effects of Krill Oil on Obesity and Obesity-Induced Metabolic Syndromes in High-Fat Diet-Fed Mice.Mar Drugs. 2022 Jul 27;20(8):483. doi: 10.3390/md20080483. Mar Drugs. 2022. PMID: 36005486 Free PMC article.
-
Lemon Balm and Corn Silk Mixture Alleviates Metabolic Disorders Caused by a High-Fat Diet.Antioxidants (Basel). 2022 Apr 7;11(4):730. doi: 10.3390/antiox11040730. Antioxidants (Basel). 2022. PMID: 35453415 Free PMC article.
-
Lemon balm and dandelion leaf extract synergistically alleviate ethanol-induced hepatotoxicity by enhancing antioxidant and anti-inflammatory activity.J Food Biochem. 2020 Aug;44(8):e13232. doi: 10.1111/jfbc.13232. Epub 2020 Jun 4. J Food Biochem. 2020. PMID: 32497278
-
Combined treatments with metformin and phosphodiesterase inhibitors alleviate nonalcoholic fatty liver disease in high-fat diet fed rats: a comparative study.Can J Physiol Pharmacol. 2020 Aug;98(8):498-505. doi: 10.1139/cjpp-2019-0487. Epub 2020 Feb 21. Can J Physiol Pharmacol. 2020. PMID: 32083947
-
Combination of metformin and chlorogenic acid attenuates hepatic steatosis and inflammation in high-fat diet fed mice.IUBMB Life. 2021 Jan;73(1):252-263. doi: 10.1002/iub.2424. Epub 2020 Dec 16. IUBMB Life. 2021. PMID: 33326684
Cited by
-
Preventive and Therapeutic Effects of Krill Oil on Obesity and Obesity-Induced Metabolic Syndromes in High-Fat Diet-Fed Mice.Mar Drugs. 2022 Jul 27;20(8):483. doi: 10.3390/md20080483. Mar Drugs. 2022. PMID: 36005486 Free PMC article.
-
Association between Atherogenic index of plasma and gallstones in the United States adults: A cross-sectional analysis of NHANES 2017-2020.Prev Med Rep. 2025 Jan 13;50:102972. doi: 10.1016/j.pmedr.2025.102972. eCollection 2025 Feb. Prev Med Rep. 2025. PMID: 39897733 Free PMC article.
References
-
- Hernandez E.A., Kahl S., Seelig A., Begovatz P., Irmler M., Kupriyanova Y., Nowotny B., Nowotny P., Herder C., Barosa C., et al. Acute dietary fat intake initiates alterations in energy metabolism and insulin resistance. J. Clin. Investig. 2017;127:695–708. doi: 10.1172/JCI89444. - DOI - PMC - PubMed
-
- Younossi Z.M., Golabi P., de Avila L., Paik J.M., Srishord M., Fukui N., Qiu Y., Burns L., Afendy A., Nader F. The global epidemiology of NAFLD and NASH in patients with type 2 diabetes: A systematic review and meta-analysis. J. Hepatol. 2019;71:793–801. doi: 10.1016/j.jhep.2019.06.021. - DOI - PubMed
Grants and funding
LinkOut - more resources
Full Text Sources
Research Materials

