Case Reports
. 2022 Mar 15;12(3):389.
doi: 10.3390/brainsci12030389.

New Insight in Hyperinsulinism/Hyperammonemia Syndrome by Magnetic Resonance Imaging and Spectroscopy

Affiliations
Case Reports

New Insight in Hyperinsulinism/Hyperammonemia Syndrome by Magnetic Resonance Imaging and Spectroscopy

Karim Gariani et al. Brain Sci. .

Abstract

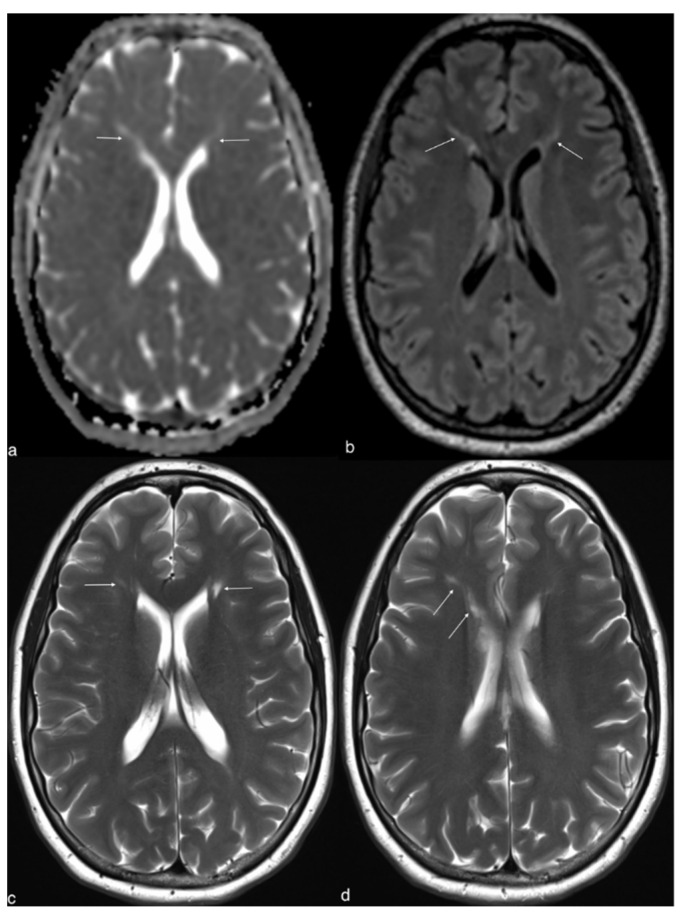
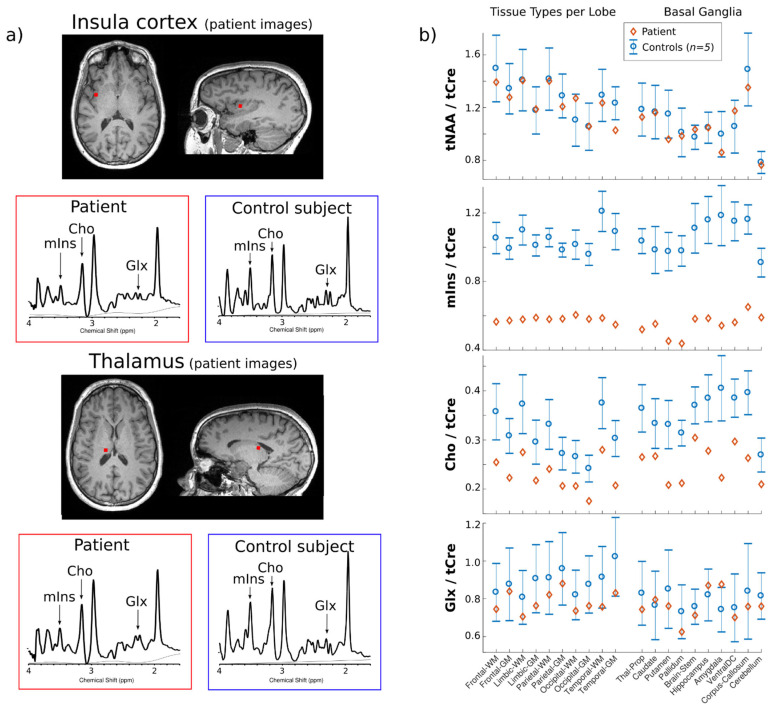
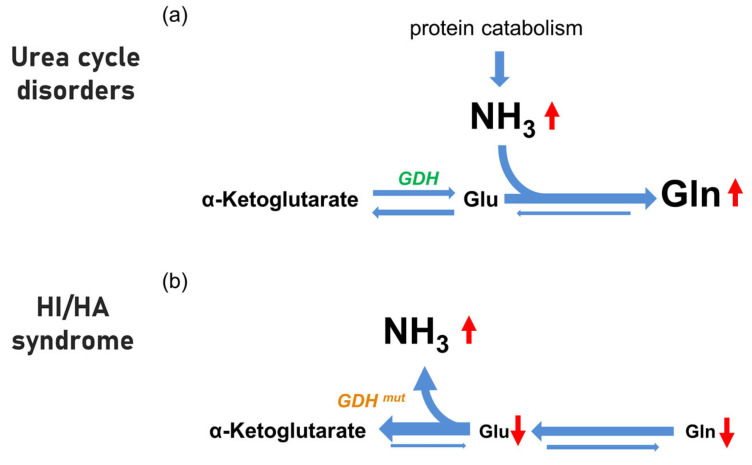
Hyperinsulinism/hyperammonemia syndrome (HI/HA) is an autosomal dominant disorder caused by monoallelic activating mutations in the glutamate dehydrogenase 1 (GLUD1) gene. While hyperinsulinism may be explained by a reduction in the allosteric inhibition of GLUD1, the pathogenesis of HA in HI/HA remains uncertain; interestingly, HA in the HI/HA syndrome is not associated with acute hyperammonemic intoxication events. We obtained a brain magnetic resonance (MR) in a woman with HI/HA syndrome with chronic asymptomatic HA. On MR spectroscopy, choline and myoinositol were decreased as in other HA disorders. In contrast, distinct from other HA disorders, combined glutamate and glutamine levels were normal (not increased). This observation suggests that brain biochemistry in HI/HA may differ from that of other HA disorders. In HI/HA, ammonia overproduction may come to the expense of glutamate levels, and this seems to prevent the condensation of ammonia with glutamate to produce glutamine that is typical of the other HA disorders. The absence of combined glutamate and glutamine elevation might be correlated to the absence of acute cerebral ammonia toxicity.

Keywords: brain spectroscopy; glutamate dehydrogenase; hyperammonemia; hyperinsulinism.


Conflict of interest statement

The authors declared no potential conflict of interest.

Figures

Figure 1
Figure 1
Brain MRI shows an increased ADC (arrows in (a)) associated with linear high signals lesions of the white matter in front of the frontal horns of lateral ventricles on FLAIR and T2 (arrows in (bd)). ADC, apparent diffusion coefficient; MRI, magnetic resonance imaging.
Figure 2
Figure 2
MRSI spectra measured in the insula cortex and the thalamus of the patient (corresponding voxel in red shown on anatomical T1-weighted images) (a). For comparison, spectra from the same structures are shown for a healthy subject. The drop of choline containing compounds (Cho) and inositol (Ins) in peak intensity is particularly visible in the patient spectra whereas the glutamate + glutamine (Glx) peaks show no clear alteration. These observations are confirmed by an analysis of the metabolite concentration over the whole patient brain (b). Regional quantitative values are shown for the patient (red diamonds) and the controls (blue circles represent the mean of the 5 with the standard deviation as error bar). The metabolite concentration ratios Ins/creatine + phosphocreatine (tCre) and Cho/tCre show systematic and distinct lower levels in the patient compared to the control group. N-acetylaspartate + N-acetyl aspartylglutamate (tNAA)/tCre and glutamate + glutamine (Glx)/tCre show no clear difference. MRSI, magnetic resonance spectroscopic imaging.
Figure 3
Figure 3
Schematic of the major pathways by which cerebral glutamate (Glu) and glutamine (Gln) levels are affected in urea cycle disorders (a) and hypothesis for HI/HA syndrome (b) related to increased activity of glutamate dehydrogenase (GDH). Relative changes in pool size of cerebral metabolites (α-ketoglutarate, ammonia, glutamate, and glutamine) between different conditions are indicated by differences in font size. In (a) ammonia (NH3) levels are primarily increased, and they drive the condensation reaction with glutamate to produce glutamine by glutamine synthetase; the α-ketoglutarate -glutamate-glutamine pathway is shifted towards to the right. In (b) we hypothesize that in HI/HA, the activating mutations in the GDH enzyme drive the deamination of glutamate to produce ammonia and α-ketoglutarate; thus, the αketoglutarate-glutamate-glutamine pathway is driven towards the left, and there is no accumulation of glutamine. (a) adapted from [42]). HA, hyperammonemia; HI, hyperinsulinism.

Similar articles

Cited by

References

    1. Cochrane W.A., Payne W.W., Simpkiss M.J., Woolf L.I. Familial hypoglycemia precipitated by amino acids. J. Clin. Investig. 1956;35:411–422. doi: 10.1172/JCI103292. - DOI - PMC - PubMed
    1. Stanley C.A., Lieu Y.K., Hsu B.Y., Burlina A.B., Greenberg C.R., Hopwood N.J., Perlman K., Rich B.H., Zammarchi E., Poncz M. Hyperinsulinism and hyperammonemia in infants with regulatory mutations of the glutamate dehydrogenase gene. N. Engl. J. Med. 1998;338:1352–1357. doi: 10.1056/NEJM199805073381904. - DOI - PubMed
    1. Stanley C.A. Regulation of glutamate metabolism and insulin secretion by glutamate dehydrogenase in hypoglycemic children. Am. J. Clin. Nutr. 2009;90:862S–866S. doi: 10.3945/ajcn.2009.27462AA. - DOI - PMC - PubMed
    1. Bahi-Buisson N., Roze E., Dionisi C., Escande F., Valayannopoulos V., Feillet F., Heinrichs C., Chadefaux-Vekemans B., Dan B., de Lonlay P. Neurological aspects of hyperinsulinism-hyperammonaemia syndrome. Dev. Med. Child Neurol. 2008;50:945–949. doi: 10.1111/j.1469-8749.2008.03114.x. - DOI - PubMed
    1. Treberg J.R., Brosnan M.E., Watford M., Brosnan J.T. On the reversibility of glutamate dehydrogenase and the source of hyperammonemia in the hyperinsulinism/hyperammonemia syndrome. Adv. Enzyme Regul. 2010;50:34–43. doi: 10.1016/j.advenzreg.2009.10.029. - DOI - PubMed

Publication types

LinkOut - more resources