

Influence of Motor and Cognitive Tasks on Time Estimation
- PMID: 35326362
- PMCID: PMC8946194
- DOI: 10.3390/brainsci12030404
Influence of Motor and Cognitive Tasks on Time Estimation
Abstract
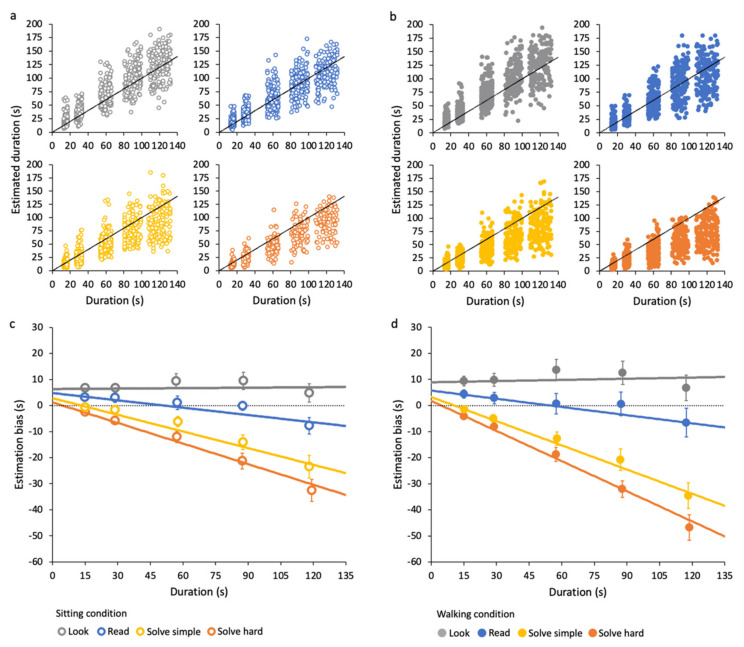
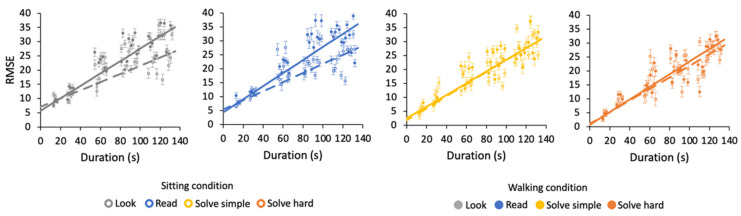
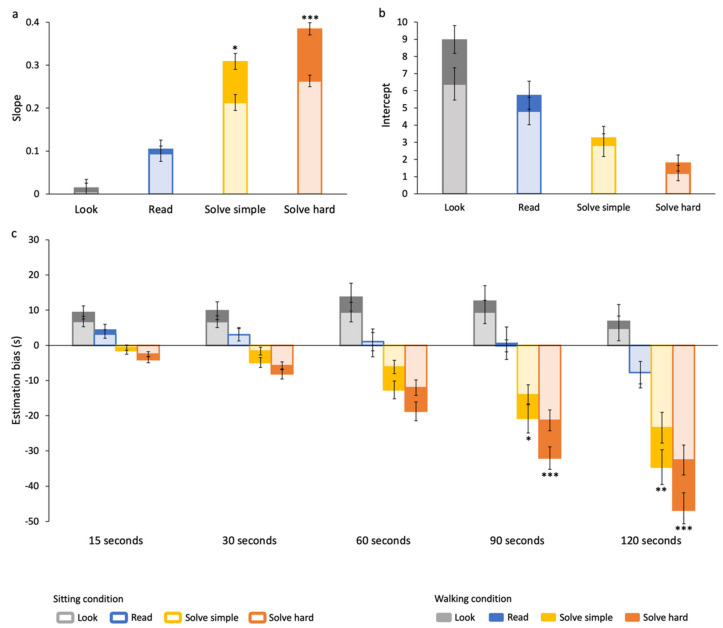
The passing of time can be precisely measured by using clocks, whereas humans' estimation of temporal durations is influenced by many physical, cognitive and contextual factors, which distort our internal clock. Although it has been shown that temporal estimation accuracy is impaired by non-temporal tasks performed at the same time, no studies have investigated how concurrent cognitive and motor tasks interfere with time estimation. Moreover, most experiments only tested time intervals of a few seconds. In the present study, participants were asked to perform cognitive tasks of different difficulties (look, read, solve simple and hard mathematical operations) and estimate durations of up to two minutes, while walking or sitting. The results show that if observers pay attention only to time without performing any other mental task, they tend to overestimate the durations. Meanwhile, the more difficult the concurrent task, the more they tend to underestimate the time. These distortions are even more pronounced when observers are walking. Estimation biases and uncertainties change differently with durations depending on the task, consistent with a fixed relative uncertainty. Our findings show that cognitive and motor systems interact non-linearly and interfere with time perception processes, suggesting that they all compete for the same resources.
Keywords: clock speed; cognitive load; cognitive–motor interaction; duration estimation; time perception; walking.
Conflict of interest statement
The authors declare no conflict of interest.
Figures


Similar articles
-
Time estimation during motor activity.Front Hum Neurosci. 2023 Apr 21;17:1134027. doi: 10.3389/fnhum.2023.1134027. eCollection 2023. Front Hum Neurosci. 2023. PMID: 37151903 Free PMC article.
-
Cognitive-motor interference during fine and gross motor tasks in children with Developmental Coordination Disorder (DCD).Res Dev Disabil. 2016 Oct;57:136-48. doi: 10.1016/j.ridd.2016.07.003. Epub 2016 Jul 16. Res Dev Disabil. 2016. PMID: 27428781
-
The Applicability of Rhythm-Motor Tasks to a New Dual Task Paradigm for Older Adults.Front Neurol. 2017 Dec 22;8:671. doi: 10.3389/fneur.2017.00671. eCollection 2017. Front Neurol. 2017. PMID: 29375462 Free PMC article.
-
A concurrent attention-demanding task did not interfere with balance recovery function in standing and walking among young adults - An explorative laboratory study.Hum Mov Sci. 2020 Oct;73:102675. doi: 10.1016/j.humov.2020.102675. Epub 2020 Sep 11. Hum Mov Sci. 2020. PMID: 32927228
-
Meta-analysis of time perception and temporal processing in schizophrenia: Differential effects on precision and accuracy.Clin Psychol Rev. 2017 Jun;54:44-64. doi: 10.1016/j.cpr.2017.03.007. Epub 2017 Mar 29. Clin Psychol Rev. 2017. PMID: 28391027 Review.
Cited by
-
Time Estimation Following an Exhaustive Exercise.J Funct Morphol Kinesiol. 2025 Jan 16;10(1):35. doi: 10.3390/jfmk10010035. J Funct Morphol Kinesiol. 2025. PMID: 39846676 Free PMC article.
-
The role of physical and cognitive effort on time perception.Sci Rep. 2025 Jul 15;15(1):25595. doi: 10.1038/s41598-025-07814-9. Sci Rep. 2025. PMID: 40664733 Free PMC article.
-
Space-time mapping relationships in sensorimotor communication during asymmetric joint action.PeerJ. 2024 Jan 12;12:e16764. doi: 10.7717/peerj.16764. eCollection 2024. PeerJ. 2024. PMID: 38225929 Free PMC article.
-
Super special relativity.Front Comput Neurosci. 2025 Aug 13;19:1597914. doi: 10.3389/fncom.2025.1597914. eCollection 2025. Front Comput Neurosci. 2025. PMID: 40880621 Free PMC article.
-
The Role of the Sensorimotor System in Cognitive Functions.Brain Sci. 2022 May 5;12(5):604. doi: 10.3390/brainsci12050604. Brain Sci. 2022. PMID: 35624991 Free PMC article.
References
-
- Sucala M., Scheckner B., David D. Psychological Time: Interval Length Judgments and Subjective Passage of Time Judgments. Curr. Psychol. Lett. 2011;26:2010. doi: 10.4000/cpl.4998. - DOI
-
- Gibbon J. Scalar expectancy theory and Weber’s law in animal timing. Psychol. Rev. 1977;84:279–325. doi: 10.1037/0033-295X.84.3.279. - DOI
Grants and funding
LinkOut - more resources
Full Text Sources
