

Fetal Tissue-Derived Mast Cells (MC) as Experimental Surrogate for In Vivo Connective Tissue MC
- PMID: 35326379
- PMCID: PMC8946182
- DOI: 10.3390/cells11060928
Fetal Tissue-Derived Mast Cells (MC) as Experimental Surrogate for In Vivo Connective Tissue MC
Abstract
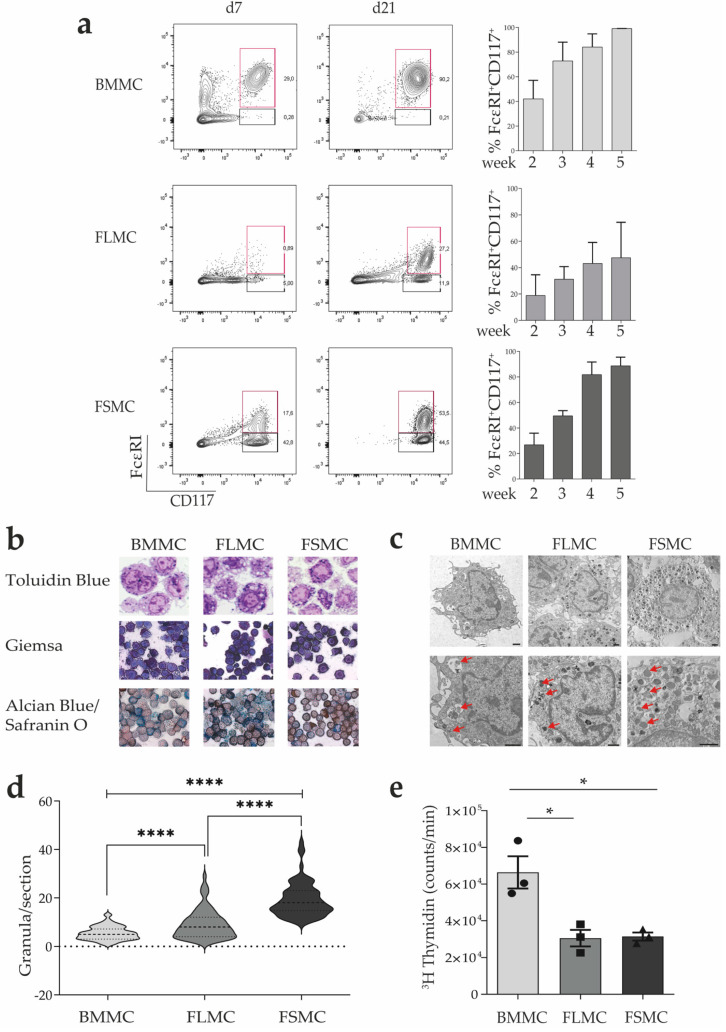
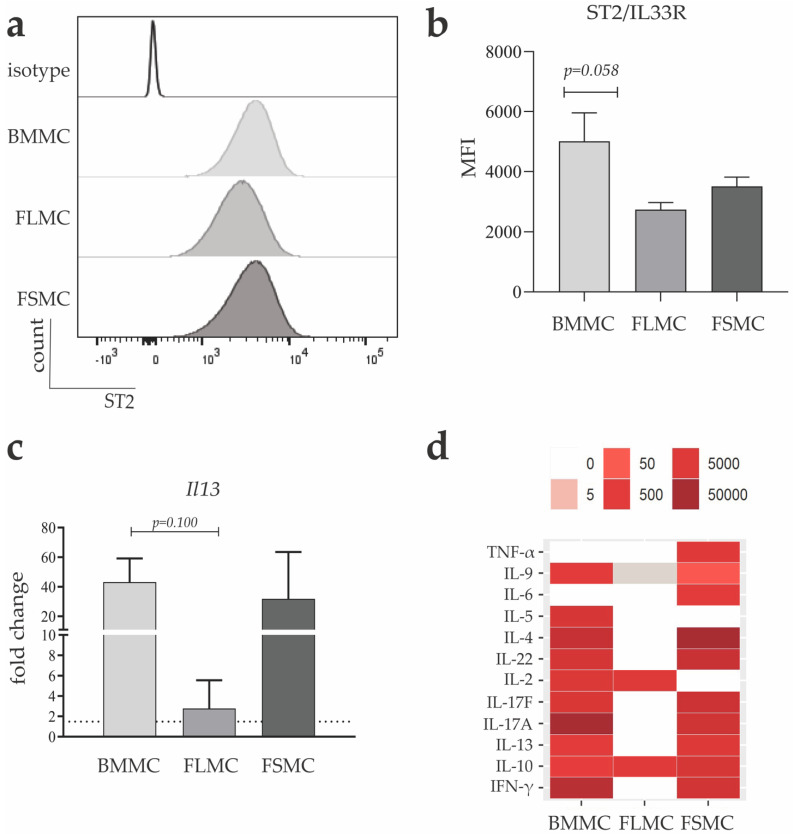
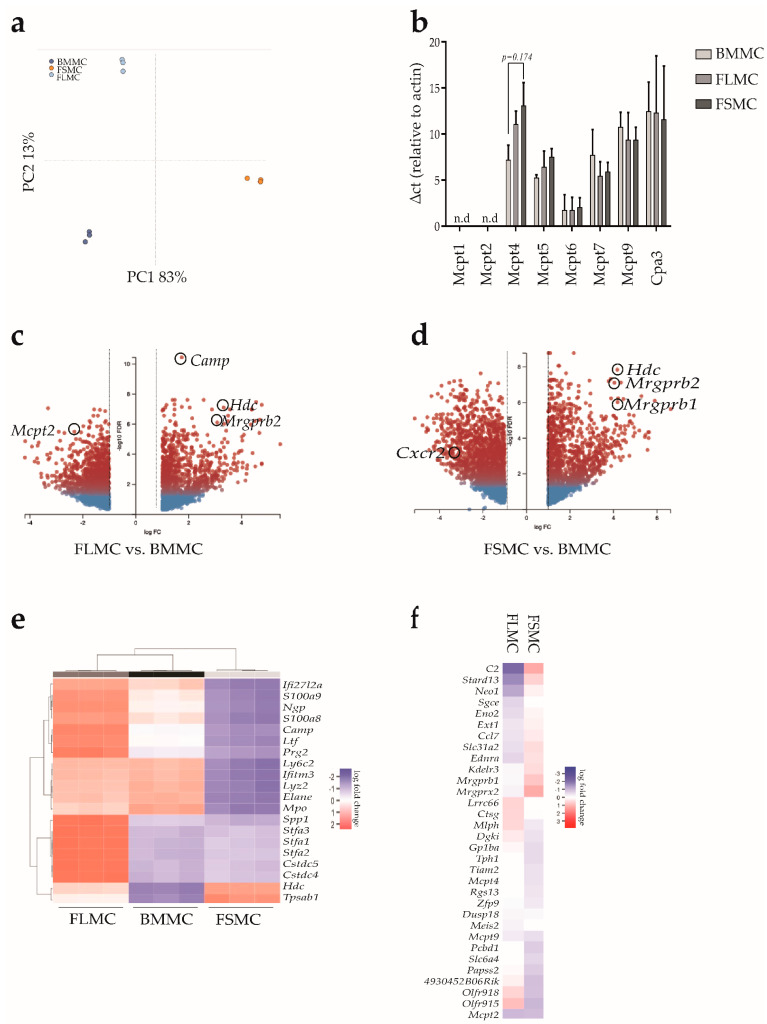
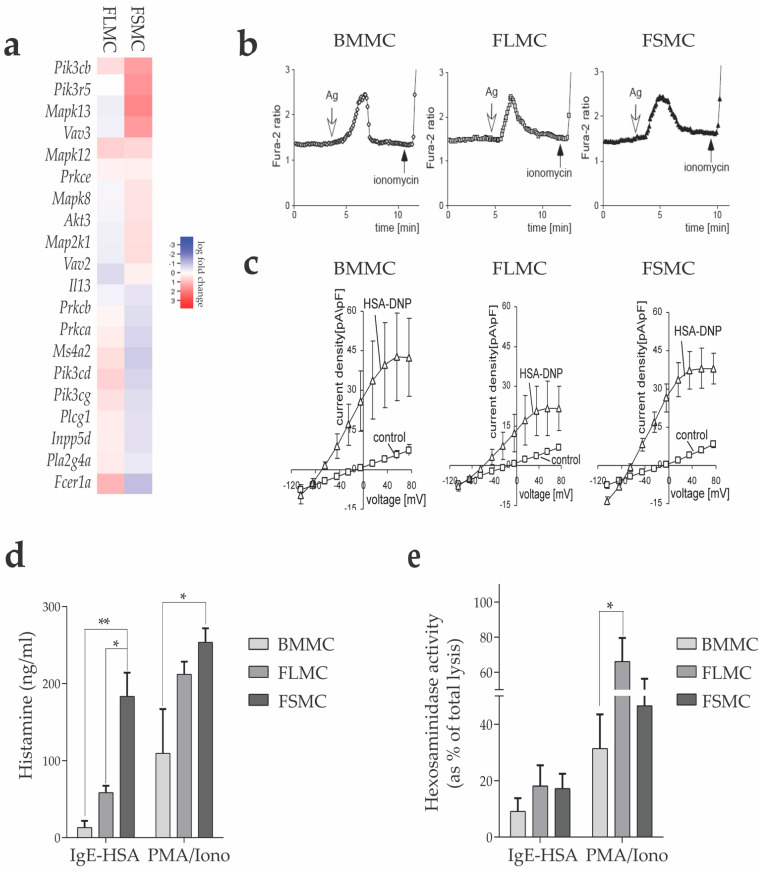
Bone-marrow-derived mast cells are matured from bone marrow cells in medium containing 20% fetal calf serum (FCS), interleukin (IL)-3 and stem-cell factor (SCF) and are used as in vitro models to study mast cells (MC) and their role in health and disease. In vivo, however, BM-derived hematopoietic stem cells account for only a fraction of MC; the majority of MC in vivo are and remain tissue resident. In this study we established a side-by-side culture with BMMC, fetal skin MC (FSMC) or fetal liver MC (FLMC) for comparative studies to identify the best surrogates for mature connective tissue MC (CTMC). All three MC types showed comparable morphology by histology and MC phenotype by flow cytometry. Heterogeneity was detected in the transcriptome with the most differentially expressed genes in FSMC compared to BMMC being Hdc and Tpsb2. Expression of ST2 was highly expressed in BMMC and FSMC and reduced in FLMC, diminishing their secretion of type 2 cytokines. Higher granule content, stronger response to FcεRI activation and significantly higher release of histamine from FSMC compared to FLMC and BMMC indicated differences in MC development in vitro dependent on the tissue of origin. Thus, tissues of origin imprint MC precursor cells to acquire distinct phenotypes and signatures despite identical culture conditions. Fetal-derived MC resemble mature CTMC, with FSMC being the most developed.
Keywords: IgE; RNA sequencing; in vitro model; mast cell; proteases; transcriptome.
Conflict of interest statement
The authors declare no conflict of interest.
Figures

Similar articles
-
Stem cell factor and interleukin-4 increase responsiveness of mast cells to substance P.Exp Hematol. 2000 Jun;28(6):626-34. doi: 10.1016/s0301-472x(00)00161-2. Exp Hematol. 2000. PMID: 10880748
-
TLR3-, TLR7-, and TLR9-mediated production of proinflammatory cytokines and chemokines from murine connective tissue type skin-derived mast cells but not from bone marrow-derived mast cells.J Immunol. 2004 Jul 1;173(1):531-41. doi: 10.4049/jimmunol.173.1.531. J Immunol. 2004. PMID: 15210814
-
Rat mucosal mast cells: the cultured bone marrow-derived mast cell is biochemically and functionally analogous to its counterpart in vivo.Immunology. 1998 Apr;93(4):533-9. doi: 10.1046/j.1365-2567.1998.00465.x. Immunology. 1998. PMID: 9659226 Free PMC article.
-
Ontogeny of in vitro-differentiated mouse mast cells.Fed Proc. 1987 Apr;46(5):1915-9. Fed Proc. 1987. PMID: 3549363 Review.
-
Cytokines regulate development of human mast cells from hematopoietic progenitors.Int J Hematol. 2002 May;75(4):350-6. doi: 10.1007/BF02982123. Int J Hematol. 2002. PMID: 12041663 Review.
Cited by
-
Mast cell-mediated microRNA functioning in immune regulation and disease pathophysiology.Clin Exp Med. 2025 Jan 15;25(1):38. doi: 10.1007/s10238-024-01554-2. Clin Exp Med. 2025. PMID: 39812911 Free PMC article. Review.
-
Cultures of Human Skin Mast Cells, an Attractive In Vitro Model for Studies of Human Mast Cell Biology.Cells. 2024 Jan 2;13(1):98. doi: 10.3390/cells13010098. Cells. 2024. PMID: 38201301 Free PMC article.
-
The mast cell reaction in premalignant and malignant lesions of the head and neck.Rom J Morphol Embryol. 2022 Apr-Jun;63(2):407-411. doi: 10.47162/RJME.63.2.11. Rom J Morphol Embryol. 2022. PMID: 36374145 Free PMC article.
-
New Insight into Intestinal Mast Cells Revealed by Single-Cell RNA Sequencing.Int J Mol Sci. 2024 May 21;25(11):5594. doi: 10.3390/ijms25115594. Int J Mol Sci. 2024. PMID: 38891782 Free PMC article. Review.
References
-
- Dahlin J.S., Hamey F.K., Pijuan-Sala B., Shepherd M., Lau W.W.Y., Nestorowa S., Weinreb C., Wolock S., Hannah R., Diamanti E., et al. A single-cell hematopoietic landscape resolves 8 lineage trajectories and defects in Kit mutant mice. Blood. 2018;131:e1–e11. doi: 10.1182/blood-2017-12-821413. - DOI - PMC - PubMed
Publication types
MeSH terms
Grants and funding
LinkOut - more resources
Full Text Sources
