. 2022 Mar 10;11(6):946.
doi: 10.3390/cells11060946.

Batch Effects during Human Bone Marrow Stromal Cell Propagation Prevail Donor Variation and Culture Duration: Impact on Genotype, Phenotype and Function

Affiliations

Batch Effects during Human Bone Marrow Stromal Cell Propagation Prevail Donor Variation and Culture Duration: Impact on Genotype, Phenotype and Function

Gabriele Brachtl et al. Cells. .

Abstract

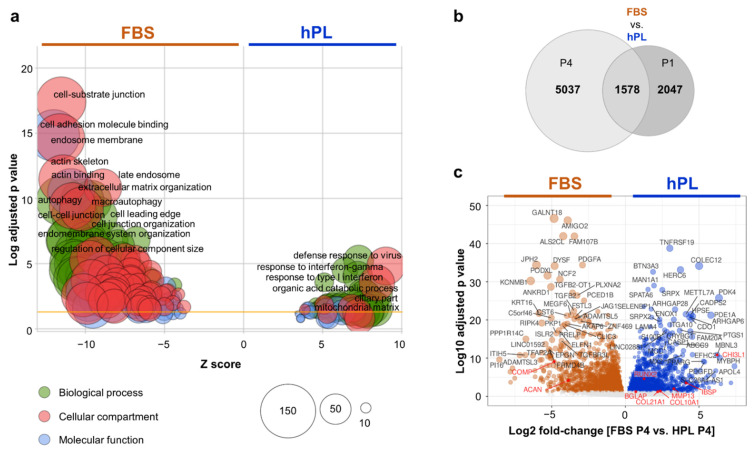
Donor variation is a prominent critical issue limiting the applicability of cell-based therapies. We hypothesized that batch effects during propagation of bone marrow stromal cells (BMSCs) in human platelet lysate (hPL), replacing fetal bovine serum (FBS), can affect phenotypic and functional variability. We therefore investigated the impact of donor variation, hPL- vs. FBS-driven propagation and exhaustive proliferation, on BMSC epigenome, transcriptome, phenotype, coagulation risk and osteochondral regenerative function. Notably, propagation in hPL significantly increased BMSC proliferation, created significantly different gene expression trajectories and distinct surface marker signatures, already after just one passage. We confirmed significantly declining proliferative potential in FBS-expanded BMSC after proliferative challenge. Flow cytometry verified the canonical fibroblastic phenotype in culture-expanded BMSCs. We observed limited effects on DNA methylation, preferentially in FBS-driven cultures, irrespective of culture duration. The clotting risk increased over culture time. Moreover, expansion in xenogenic serum resulted in significant loss of function during 3D cartilage disk formation and significantly increased clotting risk. Superior chondrogenic function under hPL-conditions was maintained over culture. The platelet blood group and isoagglutinins had minor impact on BMSC function. These data demonstrate pronounced batch effects on BMSC transcriptome, phenotype and function due to serum factors, partly outcompeting donor variation after just one culture passage.

Keywords: batch effect; bone marrow; cell therapy; chondrogenesis; donor variation; human platelet lysate (hPL); regenerative medicine; stem cells.


Conflict of interest statement

The authors declare no conflict of interest.

Figures

Figure A1
Figure A1
Gating strategy for cell surface marker profiling using LEGENDSCREEN™ Human PE Kit. Cells were prestained with a backbone panel (anti-human Lineage [Lin], anti-human CD29, CD44, CD73, CD90, CD105) and then analyzed with the LEGENDSCREEN™ human PE kit as follows: exclusion of nonsingle events (forward scatter area [FSC-A] versus forward scatter height [FSC-H]); gating of live cells (L/D versus sideward scatter area [SSC-A]); gating of all CD44+ and exclusion of all linage negative (versus anti-CD44); gating of all Lin-CD44+ and CD29+ (anti-CD29 versus anti-CD44); gating of all Lin-CD44+CD29+, CD90+ and CD73+ cells (anti-CD90 versus anti-CD73+); gating of all Lin-CD44+CD29+CD90+CD73+ and CD105+ (anti-CD90 versus anti-CD105)–the gated CD44+CD29+CD90+CD73+CD105+ BMSCs were used to further analyze individual target cell surface marker (anti-CD73 versus anti-target marker).
Figure A2
Figure A2
Large-scale propagation of BMSCs. (a) Representative cell morphology of BMSCs from four donors grown in 4-layered cell factories (CF4) with either FBS or hPL O/AB. Bright field, scale bar 100 µm (b) Representative pictures of calcein-stained BMSCs (green) and corresponding cell segmentation (red pseudocolor) from two donors as indicated, cultured with either FBS or hPL O/AB for 24 h at passage 1. Scale bar 100 µm (c) Mean length and (d) area of BMSCs cultured as shown in (b); cells analyzed for donor 1—FBS, n = 1428, hPL O/AB n = 1208; donor 2—FBS n = 1343, hPL O/AB n = 1253). Kruskal–Wallis nonparametric test (**** p < 0.0001).
Figure A3
Figure A3
Large-scale extended propagation of BMSCs (a) Absolute number of BMSCs (donor 1–4, as indicated) cultured for one passage (P1) either with FBS or hPL O/AB. Paired t-test, ** p < 0.01. (b) Calculated population doublings per day of P1–P4 of BMSCs propagated in media containing FBS, hPL O/AB or hPL mBG. Repeated measures, one-way ANOVA with multiple comparisons (Tukey) p < 0.0001, p-values of multiple comparisons and t-test as depicted * p < 0.5, *** p < 0.001, **** p < 0.0001. (c) Cumulative cell numbers and (d) cumulative population doublings of BMSCs cultured in different media over time. Grey ribbon indicates 95% confidence intervals. Linear regression analysis showed significant differences between FBS and hPL medium with p < 10−7 for both cumulative cell counts and cumulative PD. No significant differences were found between hPL O/AB and hPL mBG; n = 4. Abbreviations: P—passage; FBS—fetal bovine serum; hPL—human platelet lysate; O/AB—blood group O platelets lysed in AB plasma; mBG—mixed blood group of platelets lysed in their original plasma.
Figure A4
Figure A4
Hierarchical clustering heatmap with expression values of the top 100 most variable genes. Gene expression values were row Z-score normalized where lower expression is denoted by blue and higher expression by red color as shown in the legend above. FBS samples cluster together and HPL samples cluster together, passages have less influence.
Figure A5
Figure A5
Overlap between RNA-seq and MethylCap-seq. (a) Genes found significantly upregulated and hypomethylated in hPL vs. FBS (red labels) or downregulated and hypermethylated in hPL vs. FBS (blue labels). X axis shows the log2-fold changes for RNA-seq. Y axis shows log 2-fold methylation changes. (b) Gene ontology (GO) enrichment analysis showing significant biological processes enriched for genes found downregulated and hypermethylated in hPL vs. FBS (blue labelled genes, in a) (adjusted p-value < 0.05, Benjamini–Hochberg multiple testing correction). Similar GO categories are clustered together and labelled based on semantic similarity. The size of boxes is related to the number of genes in the respective category.
Figure A6
Figure A6
BMSC phenotype, identity and purity. (a) Representative (donor 2 P1, hPL O/AB) flow cytometry histograms showing target antibody reactivity as indicated (in grey), compared to isotype control reactivity (open histograms) measured on 10,000 viable cells. (b) Coagulation factor III, thrombomodulin and endothelial protein C receptor (EPCR) reactivity of donor 2, P1 in hPL O/AB. (c) Multicolor flow cytometry analysis summary of three donors at P1 and P4 after culture as indicated in hPL (O/AB vs. mBG) or FBS.
Figure A7
Figure A7
Correlation of cartilage weight with Bern score and proteoglycan content. Weight of 3D cartilage disks generated in triplicate from BMSCs of four donors (donor 1–4, depicted with symbols as indicated), cultured in different conditions and differentiated after different passages (see legend for color code) correlated to Bern score values of the same samples. Linear regression analysis, p < 0.0001, n = 20.
Figure A8
Figure A8
Correlation analysis between RNA-seq gene expression and cartilage disk weight. For each gene, a dual plot shows, on the left side, the correlation analysis between RNA-seq expression on the Y-axis and cartilage disk weights on the X-axis, and on the right side, box plots depicting the RNA-seq signal in the different culture condition. Different donors are depicted by different symbols and culture conditions by different colors, as indicated. A blue linear-regression line is shown together with the regression equation and R2 value. (a) Selected genes linked to chondrogenesis. (b) Top 12 genes with the highest absolute regression coefficient. Linear regression analysis of differentially transcribed genes was conducted and genes showing significant p < 0.05 and R2 > 0.40 were selected.
Figure 1
Figure 1
Study outline showing bone marrow stromal cell (BMSC) propagation from human bone marrow samples. Bone marrow (BM) from four healthy donors was divided 50/50 (e.g., 2 × 2.5 mL) and resuspended directly in 500 mL culture medium supplemented with either fetal bovine serum (FBS) or pooled human platelet lysate (hPL) to initiate primary culture (P°) [23]. P° and passage 1 (P1) cultures were performed with a selected lot of FBS or with hPL from blood group O donor platelets, lysed in blood group AB plasma, lacking isoagglutinins anti-A and anti-B (hPL O/AB), in four-layered cell factories (CF4), to establish a working cell bank. In subsequent cultures, hPL derived from expired platelet concentrates irrespective of the blood group (mixed blood group, mBG) was used for comparison as indicated. The batch effect of these different culture conditions on BMSC genotype, phenotype and function was studied as indicated. ROTEM, rotational thromboelastometry.
Figure 2
Figure 2
Batch effects on culture-expanded BMSC transcriptomics ((a) + (b)) and methylomics ((c) + (d)): (a) Principal component analysis (PCA) showing the spatial clustering of the different samples (FBS, ocher shades; hPL, blue shades; P1, darker color; P4, lighter colors; hPL mBG open symbols) and different donors (symbols as indicated; color code and symbol legend for ac). The culture conditions (hPL-vs. FBS-supplemented) explained most of the variance in the dataset (PC1, 41%). Horizontal red dotted lines highlight the distance of samples from the same donor cultured with FBS (left) vs. hPL (right). PC2 separated samples due to culture duration and donor variation. Vertical dotted lines highlight distance between P1 and P4, regardless of donor variation. (b) Heatmap with expression values of top 100 most variable genes (see Figure A4). Samples in rows as indicated and genes in columns; different batch-defining serum supplements and passages in the general color code. Gene expression values were column Z-score normalized; lower expression blue and higher expression red color as shown in the legend. (c) PCA of differentially methylated regions with PC1 covering 23.9% and PC2 22.3% of differences. Color and symbol code as indicated. (d) Differentially methylated regions were depicted as dots on the Manhattan plot for all autosomal chromosomes. The dot height corresponds to the level of significance with higher dots indicating higher significance, i.e., lower p-value (-Log10 adjusted p-values).
Figure 3
Figure 3
Predominantly regulated pathways. (a) Gene Ontology (GO) enrichment analysis comparing hPL-(right side) or FBS-driven cultures (left side). We labelled only the top 12 FBS- and, with significantly lower adjusted p-value, top 6 hPL-enriched GO terms. A higher absolute Z-score indicates a stronger level of enrichment. The yellow line indicates the adjusted p-value of 0.05. Biological process, cellular component and molecular function GO categories are highlighted in green, red and blue, respectively. Circle size represents number of genes found in the respective GO term category. Only genes commonly differentially regulated and showing the same direction (both passages UP or DOWN in hPL) irrespective of culture duration (1540 out of 1578 in the central component, in (b), were analyzed. (b) Venn diagram showing the number of differentially expressed genes in cells obtained by hPL- vs. FBS-driven culture for P4 and hPL vs. FBS for P1 (adjusted p-value < 0.05). (c) Volcano plot showing most significantly expressed genes in FBS- (left) and hPL-driven cultures (right). Red dots marking genes significantly differentially expressed (adjusted p-value < 0.05); black dots, not significant. Most significantly differentially expressed genes indicated by gene ID.
Figure 4
Figure 4
Cell surface marker profiling of BMSCs. (a) Hierarchical clustering heatmap showing relative cell surface marker expression of all samples and culture conditions as indicated, based on isotype control staining of the corresponding target antibody. Individual marker expressions were row Z-score normalized. Lower expression in blue and higher expression in red as indicated by color. Gating strategy depicted in Figure A1. (b) Hierarchical clustering heatmap of cell surface markers that exhibited significant median differences of at least 10% between BMSCs in hPL O/AB and FBS.
Figure 5
Figure 5
Organoid-like 3D cartilage disk formation. (a) Weight of 3D cartilage disks generated in triplicates from BMSCs of four donors (1–4, depicted with symbols as indicated), pre-expanded in different media, and differentiated after P1 or P4 as indicated. One to three representative disks per sample were fixated and weighed and the remaining two discs were snap frozen for further analysis. Proper disk formation resulted in disks > 10 mg (grey area). Repeated measures, one-way ANOVA with multiple comparisons (Tukey), p-values of multiple comparisons as depicted (* p < 0.5, ** p < 0.01, **** p < 0.0001). (b) Representative pictures of corresponding fixated 3D cartilage disks created from BMSCs of donors 1–4 after hPL- or FBS-expanded early (P1) and late passage (P4) cultures as indicated. Scale bar 1 mm; n = 4. (c) Bern scoring of stained cartilage disk sections by three individual experts in blinded fashion; mean ± SD results, statistics as in (a), n = 4. (d) Representative corresponding Safranin O/Fast Green staining results depicted as indicated. Entire disk sections shown except for donor 2 hPL O/AB where curved structure disabled perfect sectioning and disk margin was illustrated by a white hatched line. Scale bar 1 mm.
Figure 6
Figure 6
Coagulation activity of early (P1) and late passage (P4) BMSCs. (a) Significantly shortened clotting time values after 4 passages in FBS, more than hPL O/AB and hPL mBG, compared to passage 1, respectively. Repeated measures, one-way ANOVA with multiple comparisons (Tukey). (b) The clot formation time and (c) maximum clot firmness showing limited donor dependent differences. Clot formation time: Friedman test with multiple comparisons (Dunn); maximum clot firmness ANOVA as in (a). (d) Significantly increased α-angles resulting from higher procoagulant activity of all late (P4) BMSCs, compared to early (P1) BMSCs; statistics as in (b). Results of 4 donors analyzed in triplicate, symbols as indicated; p-values of multiple comparisons as depicted—* p < 0.5, ** p < 0.01, *** p < 0.001, **** p < 0.0001, ns, not significant.

References

    1. Huey D.J., Hu J.C., Athanasiou K.A. Unlike bone, cartilage regeneration remains elusive. Science. 2012;338:917–921. doi: 10.1126/science.1222454. - DOI - PMC - PubMed
    1. Murphy M.P., Koepke L.S., Lopez M.T., Tong X., Ambrosi T.H., Gulati G.S., Marecic O., Wang Y., Ransom R.C., Hoover M.Y., et al. Articular cartilage regeneration by activated skeletal stem cells. Nat. Med. 2020;26:1583–1592. doi: 10.1038/s41591-020-1013-2. - DOI - PMC - PubMed
    1. Matsushita Y., Nagata M., Kozloff K.M., Welch J.D., Mizuhashi K., Tokavanich N., Hallett S.A., Link D.C., Nagasawa T., Ono W., et al. A Wnt-mediated transformation of the bone marrow stromal cell identity orchestrates skeletal regeneration. Nat. Commun. 2020;11:332. doi: 10.1038/s41467-019-14029-w. - DOI - PMC - PubMed
    1. Monaco G., Ladner Y.D., El Haj A.J., Forsyth N.R., Alini M., Stoddart M.J. Mesenchymal Stromal Cell Differentiation for Generating Cartilage and Bone-Like Tissues In Vitro. Cells. 2021;10:2165. doi: 10.3390/cells10082165. - DOI - PMC - PubMed
    1. Murdoch A.D., Grady L.M., Ablett M.P., Katopodi T., Meadows R.S., Hardingham T.E. Chondrogenic differentiation of human bone marrow stem cells in transwell cultures: Generation of scaffold-free cartilage. Stem Cells. 2007;25:2786–2796. doi: 10.1634/stemcells.2007-0374. - DOI - PubMed

Publication types