. 2022 Mar 11;11(6):962.
doi: 10.3390/cells11060962.

Early Endosomal Vps34-Derived Phosphatidylinositol-3-Phosphate Is Indispensable for the Biogenesis of the Endosomal Recycling Compartment

Affiliations

Early Endosomal Vps34-Derived Phosphatidylinositol-3-Phosphate Is Indispensable for the Biogenesis of the Endosomal Recycling Compartment

Marina Marcelić et al. Cells. .

Abstract

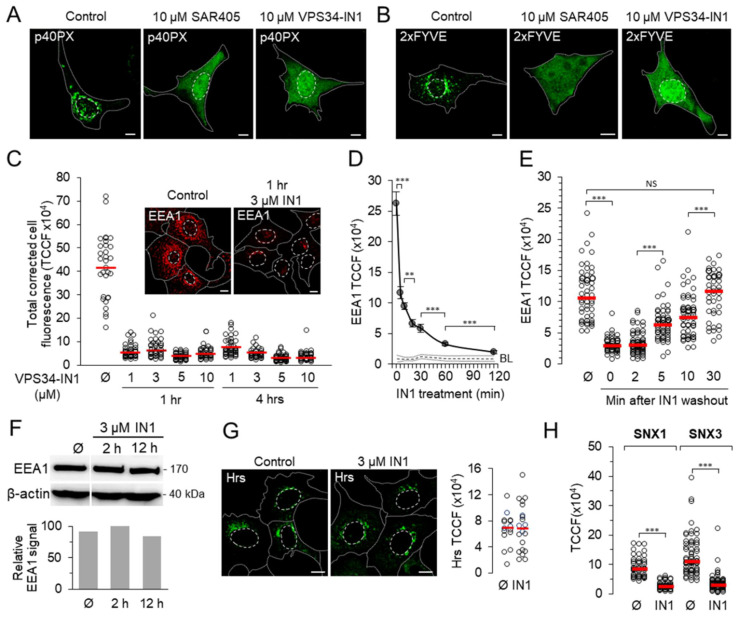
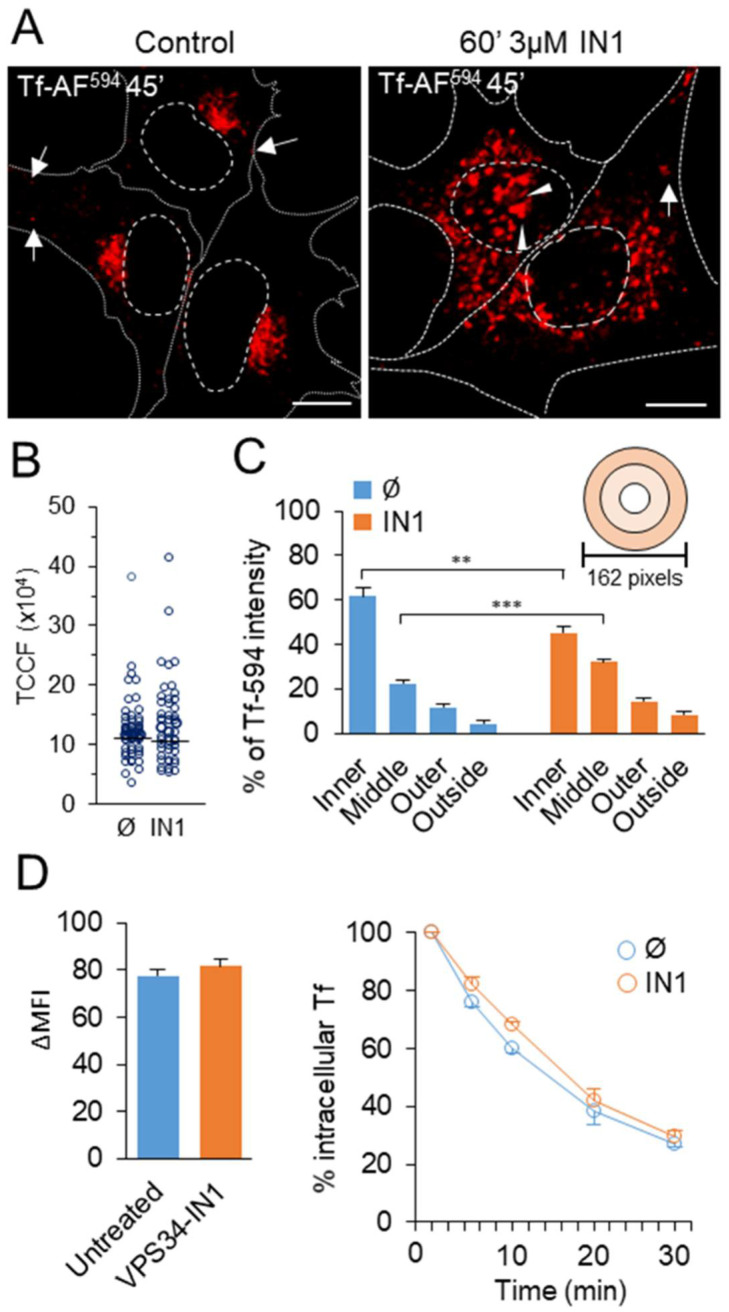
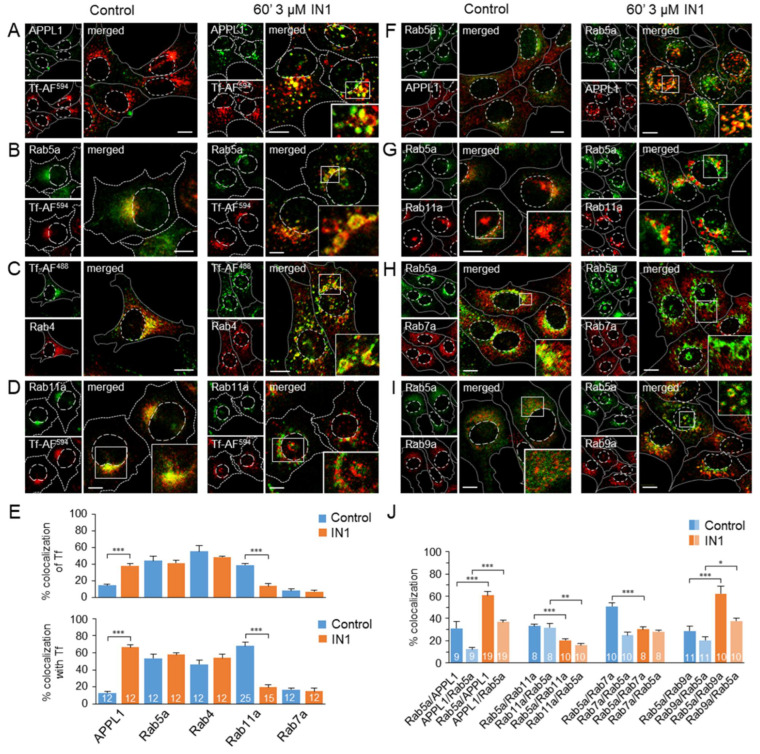
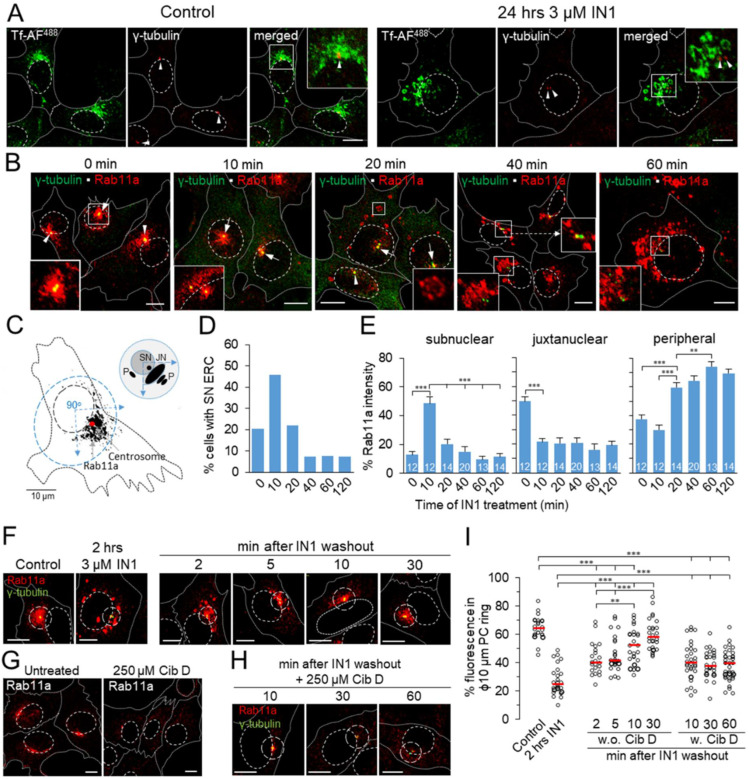
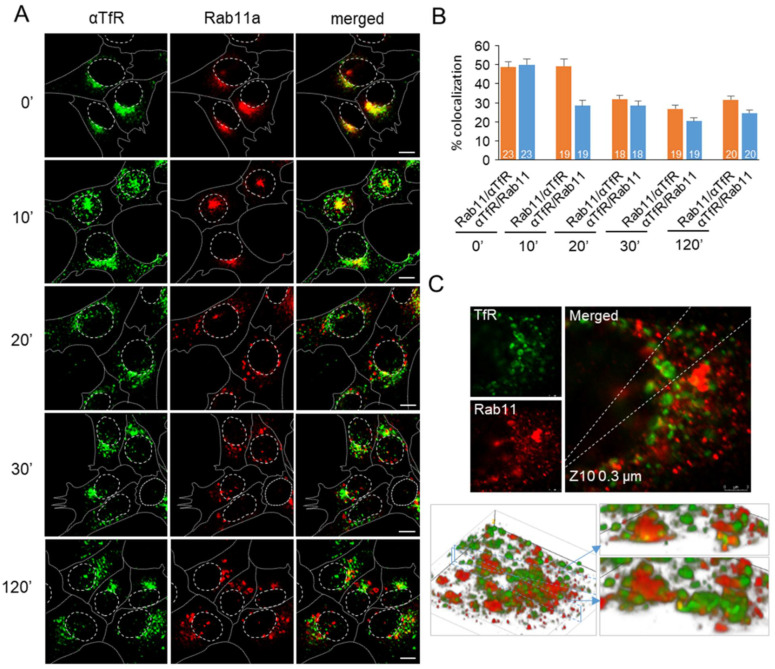
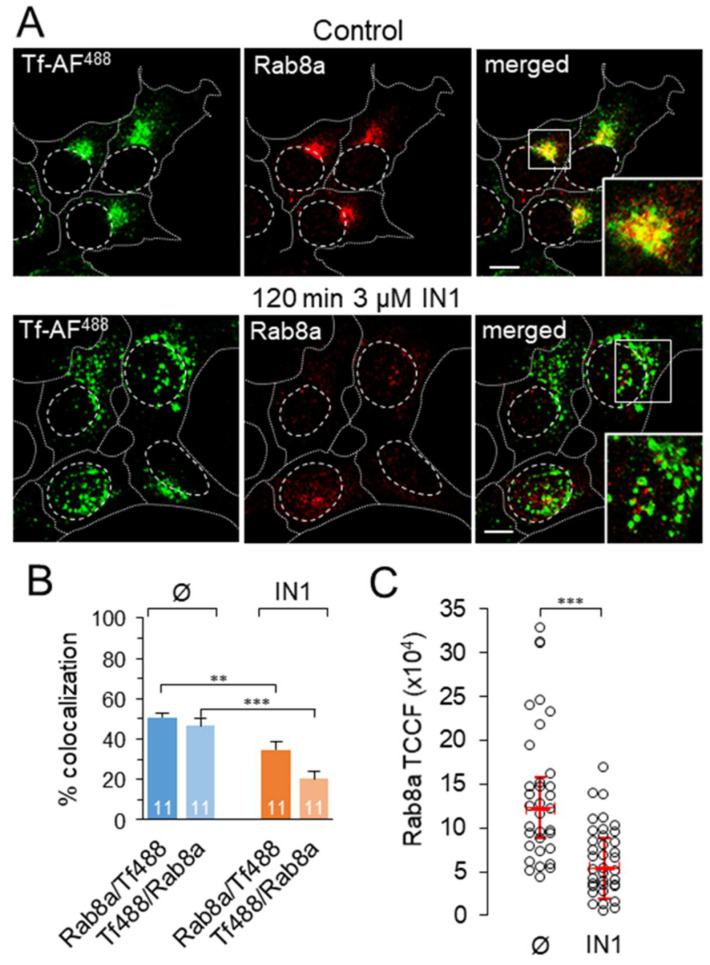
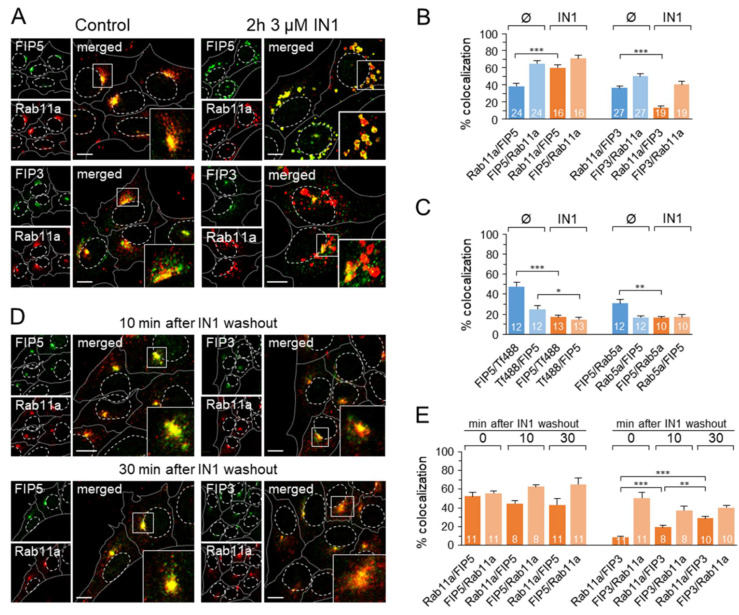
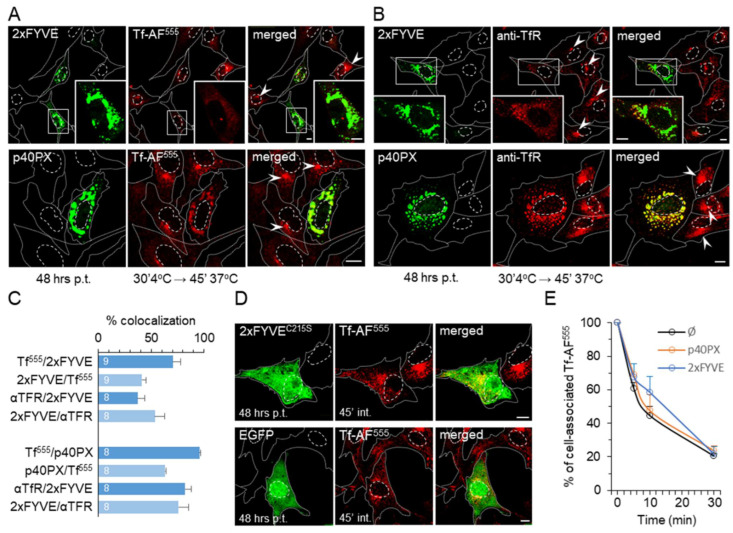
Phosphatidylinositol-3-phosphate (PI3P), a major identity tag of early endosomes (EEs), provides a platform for the recruitment of numerous cellular proteins containing an FYVE or PX domain that is required for PI3P-dependent maturation of EEs. Most of the PI3P in EEs is generated by the activity of Vps34, a catalytic component of class III phosphatidylinositol-3-phosphate kinase (PI3Ks) complex. In this study, we analyzed the role of Vps34-derived PI3P in the EE recycling circuit of unperturbed cells using VPS34-IN1 (IN1), a highly specific inhibitor of Vps34. IN1-mediated PI3P depletion resulted in the rapid dissociation of recombinant FYVE- and PX-containing PI3P-binding modules and endogenous PI3P-binding proteins, including EEA1 and EE sorting nexins. IN1 treatment triggered the rapid restructuring of EEs into a PI3P-independent functional configuration, and after IN1 washout, EEs were rapidly restored to a PI3P-dependent functional configuration. Analysis of the PI3P-independent configuration showed that the Vps34-derived PI3P is not essential for the pre-EE-associated functions and the fast recycling loop of the EE recycling circuit but contributes to EE maturation toward the degradation circuit, as previously shown in Vps34 knockout and knockdown studies. However, our study shows that Vps34-derived PI3P is also essential for the establishment of the Rab11a-dependent pathway, including recycling cargo sorting in this pathway and membrane flux from EEs to the pericentriolar endosomal recycling compartment (ERC). Rab11a endosomes of PI3P-depleted cells expanded and vacuolized outside the pericentriolar area without the acquisition of internalized transferrin (Tf). These endosomes had high levels of FIP5 and low levels of FIP3, suggesting that their maturation was arrested before the acquisition of FIP3. Consequently, Tf-loaded-, Rab11a/FIP5-, and Rab8a-positive endosomes disappeared from the pericentriolar area, implying that PI3P-associated functions are essential for ERC biogenesis. ERC loss was rapidly reversed after IN1 washout, which coincided with the restoration of FIP3 recruitment to Rab11a-positive endosomes and their dynein-dependent migration to the cell center. Thus, our study shows that Vps34-derived PI3P is indispensable in the recycling circuit to maintain the slow recycling pathway and biogenesis of the ERC.

Keywords: Rab11a endosomes; VPS34-IN1; Vps34; endosomal recycling compartment; phosphatidylinositol-3-phosphate.


Conflict of interest statement

The authors declare no conflict of interest.

Figures

Figure 1
Figure 1
Pharmacological inhibition of Vps34 leads to the rapid dissociation of PI3P-binding proteins from EE membranes. (A,B) Dissociation of fluorescent PI3P-binding domains. Images of Balb 3T3 cells transfected with YFP-PXP40phox MSCV (p40PX) or EGFP-2xFYVEHrs MSCV (2xFYVE) and 48 h after transfecton treated with either 10 μM VPS34-IN1 (IN1) or SAR405 for 4 h. Representative images of all samples (n = 12) are provided in the Supplementary Materials (Figure S1A). (C) Dissociation of EEA1 in cells treated with different concentrations of IN1 for 1 and 4 h. Fixed and permeabilized cells were stained against EEA1 and analyzed by confocal microscopy. Total corrected cell fluorescence (TCCF) of each cell was quantified using Fiji on the Otsu-thresholded confocal images. The data represent individual cells, and the horizontal bars represent the median value. The insets show a representative image of control and IN1-treated cells. Representative images of all samples are provided in Figure S1C,D. Cell borders are indicated by fine dotted lines and cell nuclei by fine dashed lines. Bars, 10 μm. (D) Time course of EEA1 dissociation after addition of 3 µM IN1 to cells. The TCCF of EEA1 was determined as described in C. Data represent individual cells, and horizontal bars represent the median value; *** p ˂ 0.001, ** p ˂ 0.01 (one-way ANOVA). BL, background level. (E) Recovery of EEA1 staining on endosomes after IN1 washout. Cells were treated with IN1 for 120 min. The TCCF of EEA1 was determined as described in C. Data represent individual cells, and horizontal bars represent the median value; *** p ˂ 0.001(one-way ANOVA). Representative images of all samples are provided in the Supplementary Materials (Figure S2). (F) Western blot analysis of EEA1 in control (Ø) and IN1-treated cells. Cropped blot images from the same membrane and densitometric quantification are shown. The original membrane is presented in Figure S3. (G) Images and TCCF intensity of Hrs in control (Ø) and 120 min IN1-treated (3 μM) cells. (H) Fluorescence signal intensity (TCCF) of SNX1 and SNX3 in untreated (Ø) and IN1-treated (120 min with 3 µM IN1) cells. Data represent individual cells, and horizontal bars represent median values. *** p ˂ 0.001 (two-tailed t-test). Representative images of all samples are provided in the Supplementary Materialy (Figure S4).
Figure 2
Figure 2
PI3P depletion reorganizes the early endosomal recycling circuit. Balb 3T3 cells were treated with either 3 μM VPS34-IN1 (IN1) or tissue culture medium containing DMSO (control) for 60 min and incubated with either Tf-AF488 or Tf-AF594 for 45 min in the presence of the inhibitor. (A) Representative confocal images (n = 8) of internalized Tf-AF594. Cell borders are indicated by fine dotted lines and cell nuclei by fine dashed lines. Bars, 10 μm. (B) Quantification of intracellular Tf-AF594 by Fiji analysis of images. The dots represent the TCCF of individual cells in the representative experiment (n = 4). (C) Quantification of Tf-AF594 distribution using Fiji. Concentric circles (0–54, 55–108, and 109–162 pixel distance) were centered on the area with the highest fluorescence signal. The intensity of Tf-AF594 within the circles was quantified relative to the total intensity in the whole cells. Data represent mean ± SEM; *** p ˂ 0.001, ** p ˂ 0.01 (one-way ANOVA). (D) Pulse-chase analysis of TfR recycling. Cells were pulsed with Tf-AF488, chased in a medium containing unlabeled Tf, and intracellular fluorescence quantified by flow cytometry. Fluorescence intensities (ΔMFI) after a 45 min pulse are shown on the left, and the kinetics of loss of intracellular fluorescence by TfR recycling is shown on the right. Data represent mean ± SEM from three independent experiments.
Figure 3
Figure 3
Co-localization analysis of internalized Tf (AE) and Rab5a (FJ) in PI3P-depleted cells. (AD) Colocalization of internalized Tf with APPL1, Rab5a, Rab4, and Rab11a in control and IN1-treated cells. Balb 3T3 cells were treated with either 3 μM VPS34-IN1 (IN1) or tissue culture medium containing DMSO (control) for 60 min and incubated with either Tf-AF488 or Tf-AF594 for 45 min in the presence of the inhibitor. Steady-state organelles were visualized on fixed and permeabilized cells using Ab reagents against cellular proteins that characterize the maturation steps of the membranous organelles. The antibody reagents used are listed in Table S1, and each marker is described in Table S2. Shown are the representative confocal images. The insets show a zoomed area box. Cell borders are indicated by fine dotted lines and cell nuclei by fine dashed lines. Bars, 10 μm. (E) 3D colocalization of Tf with organelle markers (upper panel) and organelle markers with Tf (lower panel) is based on the M1/M2 coefficients of pixel overlap measured over the Costes-algorithm thresholded z-stacks of confocal images. Data are mean ± SEM per cell (number of cells indicated in bars). Statistical significance was determined using Student’s t-test (*** p ˂ 0.001). (FI) Representative images (n = 8–12) of Rab5a and membranous organelle markers in control and IN1-treated Balb 3T3 cells. Insets show zoomed area box. Cell borders are indicated by fine dotted lines and cell nuclei by fine dashed lines. Bars, 10 μm. (J) The 3D colocalization of Rab5a with organelle markers and organelle markers with Rab5a based on the M1/M2 coefficients of pixel overlap measured across the Costes-algorithm thresholded z-stacks of confocal images. Data are mean ± SEM per cell (number of cells indicated within bars). Statistical significance was determined using Student’s t-test (*** p ˂ 0.001; ** p ˂ 0.01; * p ˂ 0.05).
Figure 4
Figure 4
Reorganization of the pericentriolar recycling system in PI3P-depleted cells. (A) Representative images (n = 8–12) of 45 min internalized Tf-AF488 and γ-tubulin in control and 24 h IN1-treated Balb 3T3 cells. (B) Representative overlaid images of γ-tubulin and Rab11a in cells treated with IN1 for 0–60 min. Insets show zoomed area box. Arrowheads indicate juxtanuclear accumulation, and arrows indicate subnuclear Rab11a staining. (C) Subcellular Rab11a distribution zones relative to centrosomes on control cell images and schematic representation of subnuclear (SN), juxtanuclear (JN), and peripheral (p) areas used for ImageJ quantification of Rab11a distribution signal. (D) Percentage of cells with subnuclear ERC distribution after 0–120 min treatment with 3 µM IN1. (E) Quantification of Rab11a distribution across three zones in cells after 0–120 min treatment with 3 µM IN1. The intensity of Rab11a in the SN, JN, and p zones was quantified on the images using ImageJ relative to the total intensity in the whole cells. Data are mean ± SEM (number of cells indicated in bars); *** p ˂ 0.001, ** p ˂ 0.01 (one-way ANOVA). (F) Representative overlaid images of Rab11a distribution (red fluorescence) relative to centrosomes stained with γ-tubulin (green fluorescence) after 120 min of IN1-treatment, followed by IN1 washout and incubation in IN1-free medium for 2–30 min. Representative images of all samples are shown in Supplemenatyr Materials (Figure S10). The intensity of the Rab11a signal (TCCF) throughout the cell area and within the ϕ10 µm ring around the centrosomes (dashed circle) was analyzed using ImageJ on sections in the focal plane. (G) Representative images of endogenous Rab11a staining in control cells and cells treated with 250 µM ciliobrevin D (Cib D) for 60 min. (H) Representative overlaid images of Rab11a distribution relative to centrosomes (γ-tubulin) after 120 min of IN1-treatment, followed by IN1 washout and incubation in IN1-free medium with 250 µM ciliobrevin D for 0–30 min. Representative images of all samples are provided in the Supplemenatry Materials (Figure S11). The intensity of the Rab11a signal throughout the cell area and within the ϕ10 µm ring around the centrosomes (dashed circle) was analyzed using ImageJ in sections on the focal plane. (I) The percentage of Rab11a signal within the pericentrosomal (PC) ϕ10-µm ring in 23–26 cells as described in (F) and 29–35 cells as described in (H). Data represent individual cells and horizontal bars represent median; *** p ˂0.001, ** p ˂ 0.01 (one-way ANOVA). Cell borders are indicated by fine dotted lines and cell nuclei by fine dashed lines. Bars, 10 μm.
Figure 5
Figure 5
IN1 treatment splits recycling cargo from Rab11a-positive membrane domains. Cell surface TfRs of Balb 3T3 cells were labeled with anti-TfR mAb (R17) at 4 °C, labeled TfRs were internalized at 37 °C for 60 min to achieve the steady-state cycling, and cells were treated with 3 µM IN1. (A) Representative images (n = 15–20) of mAb-labeled TfRs and Rab11a before (0′) and 10′–120′ after treatment with IN1. Cell borders are indicated by fine dotted lines and cell nuclei by fine dashed lines. Bars, 10 μm. (B) The 3D colocalization of Rab11a and mAb-labeled TfRs based on the M1/M2 coefficients of pixel overlap measured across the Costes-algorithm thresholded z-stacks of confocal images. Data represent mean ± SEM per cell (number of cells indicated in bars). (C) Example of 3D reconstruction of Rab11a- and mAb/TfR-labeled endosomes after 120 min treatment with 3 µM IN1. The top panel shows confocal images (z10 of 0.3 µm sections), and the bottom panel shows 3D reconstruction of the entire z-stack (21 slices) using the Volume Viewer plugin. The image shown on the left presents the 3D view of the entire stack, and the images on the right show the view across the vertical slice through the stack as indicated by dashed lines.
Figure 6
Figure 6
IN1 treatment depletes pericentriolar Rab8a-positive endosomes. (A) Representative images (n = 10–12) of internalized Tf-AF488 (45 min) and Rab8a in control and 120 min IN1-treated cells. (B) The 3D colocalization of TF-AF488 and Rab8a is based on the M1/M2 coefficients of pixel overlap measured across the Costes-algorithm thresholded z-stacks of confocal images. Data represent means ± SEM (number of cells indicated in bars); *** p ˂ 0.001; ** p ˂ 0.01 (two-tailed t-test). (C) Total corrected cell fluorescence (TCCF) of Rab8a in each cell was quantified using ImageJ on Otsu-thresholded confocal images. Data represent individual cells, and horizontal bars represent median value; *** p ˂ 0.001 (two-tailed t-test).
Figure 7
Figure 7
Rab11a endosomes of PI3P-depleted cells are positive for Rab11-FIP5 but not Rab11-FIP3. Representative images (A) and 3D colocalization analysis (B) of Rab11a and Rab11-FIP5 (FIP5) and Rab11-FIP3 (FIP3), in control (Ø) and 2 h IN1-treated cells (3 µM). Data represent mean ± SEM (number of cells indicated within bars) of M1/M2 coefficients of pixel overlap per cell, measured across the Costes-algorithm thresholded z-stacks of confocal images; *** p ˂ 0.001 (two-tailed t-test). (C) The 3D colocalization (M1/M2 coefficients of pixel overlap) of FIP5 with internalized Tf-AF488 (45 min internalization) and endogenous Rab5a in control (Ø) and 2 h IN1-treated cells (3 µM). Data represent mean ± SEM per cell (number of cells indicated in bars); *** p ˂ 0.001, ** p ˂ 0.01, * p ˂ 0.05 (two-tailed t-test). Representative images are presented in Figure S13. Representative images (D) and 3D colocalization analysis (E) of Rab11a and FIP5 or FIP3 in 2 h IN1-treated cells (3 µM) after 10 and 30 min of IN1 washout. Data represent mean ± SEM of M1/M2 coefficients of pixel overlap per cell (n = 8–11); *** p ˂ 0.001, ** p ˂ 0.01 (two-tailed t-test). The insets present zoomed area box. Cell borders are indicated by fine dotted lines and cell nuclei by fine dashed lines. Bars, 10 μm.
Figure 8
Figure 8
Prolonged expression of PI3P-binding domains alters TfR trafficking. Balb 3T3 cells were transfected with EGFP-2xFYVE MSCV or YFP-p40PX-MSCV and incubated 48 h post-transfection (p.t.) with Tf-AF555 (A) or anti-TfR mAb (B) for 30 min at 4 °C, followed by 45 min of internalization at 37 °C and confocal imaging. Arrowheads indicate juxtanuclear accumulation of internalized TfRs. (C) The 3D colocalization of 2xFYVE and p40PX in high expressing cells with internalized Tf-AF555 and mAb-TfRs based on the M1/M2 pixel overlap coefficients measured over the Costes-algorithm thresholded z-stacks of confocal images. Data are mean ± SEM per cell (number of cells indicated in bars). (D) Cells transfected with EGFP-2xFYVEC215S-MSCV or EGFP-MSCV were incubated with Tf-AF555 for 45 min and analyzed by confocal imaging. Cell borders are indicated by fine dotted lines and cell nuclei by fine dashed lines. Bars, 10 μm. (E) Kinetics of intracellular fluorescence loss by TfR recycling in untransfected (Ø) and EGFP-2xFYVE and YFP-p40PX transfected cells. The 48 h transfected cells were pulsed with hTf-AF555, chased in medium containing unlabeled hTf, and the intracellular fluorescence of transfected cells gated at the green channel was quantified by flow cytometry. Data represent mean ± SEM of five independent experiments.
Figure 9
Figure 9
Colocalization of EGFP-2xFYVE and YFP-PX with Rab5a and Rab11a. (A,B) Balb 3T3 cells were transfected with either EGFP-MSCV, EGFP-2xFYVEC215S-MSCV (C215S), EGFP-2xFYVE-MSCV, or YFP-p40PX-MSCV for 48 h. Fixed and permeabilized cells were stained with rabbit Abs against Rab5a (A) and Rab11a (B) and secondary anti-rabbit AF594. Arrows point to peripheral Rab11a endosomes in 2xFYVE and p40PX expressing cells, and arrowheads point to the juxtanuclear and subnuclear ERCs. Cell borders are indicated by fine dotted lines and nuclei by fine dashed lines. Bars, 10 μm. (C,D) The 3D colocalization of Rab5a, Rab11a, APPL1, Vps35, and Rab9a with EGFP-2xFYVE (C) and YFP-p40PX (D) based on the M1/M2 coefficients of pixel overlap measured across the Costes-algorithm thresholded z-stacks of confocal images. Data are means ± SEM per cell (number of cells indicated in bars).

Similar articles

Cited by

References

    1. Bitsikas V., Corrêa I.R., Nichols B.J. Clathrin-independent pathways do not contribute significantly to endocytic flux. eLife. 2014;3:e03970. doi: 10.7554/eLife.03970. - DOI - PMC - PubMed
    1. Wandinger-Ness A., Zerial M. Rab Proteins and the Compartmentalization of the Endosomal System. Cold Spring Harb. Perspect. Biol. 2014;6:a022616. doi: 10.1101/cshperspect.a022616. - DOI - PMC - PubMed
    1. Balla T. Phosphoinositides: Tiny Lipids With Giant Impact on Cell Regulation. Physiol. Rev. 2013;93:1019–1137. doi: 10.1152/physrev.00028.2012. - DOI - PMC - PubMed
    1. Schink K.O., Tan K.-W., Stenmark H. Phosphoinositides in Control of Membrane Dynamics. Annu. Rev. Cell Dev. Biol. 2016;32:143–171. doi: 10.1146/annurev-cellbio-111315-125349. - DOI - PubMed
    1. Leonard D., Hayakawa A., Lawe D., Lambright D., Bellve K.D., Standley C., Lifshitz L.M., Fogarty K.E., Corvera S. Sorting of EGF and transferrin at the plasma membrane and by cargo-specific signaling to EEA1-enriched endosomes. J. Cell Sci. 2008;121:3445–3458. doi: 10.1242/jcs.031484. - DOI - PMC - PubMed

Publication types

MeSH terms

LinkOut - more resources