

Anabolic Factors and Myokines Improve Differentiation of Human Embryonic Stem Cell Derived Skeletal Muscle Cells
- PMID: 35326414
- PMCID: PMC8946006
- DOI: 10.3390/cells11060963
Anabolic Factors and Myokines Improve Differentiation of Human Embryonic Stem Cell Derived Skeletal Muscle Cells
Abstract
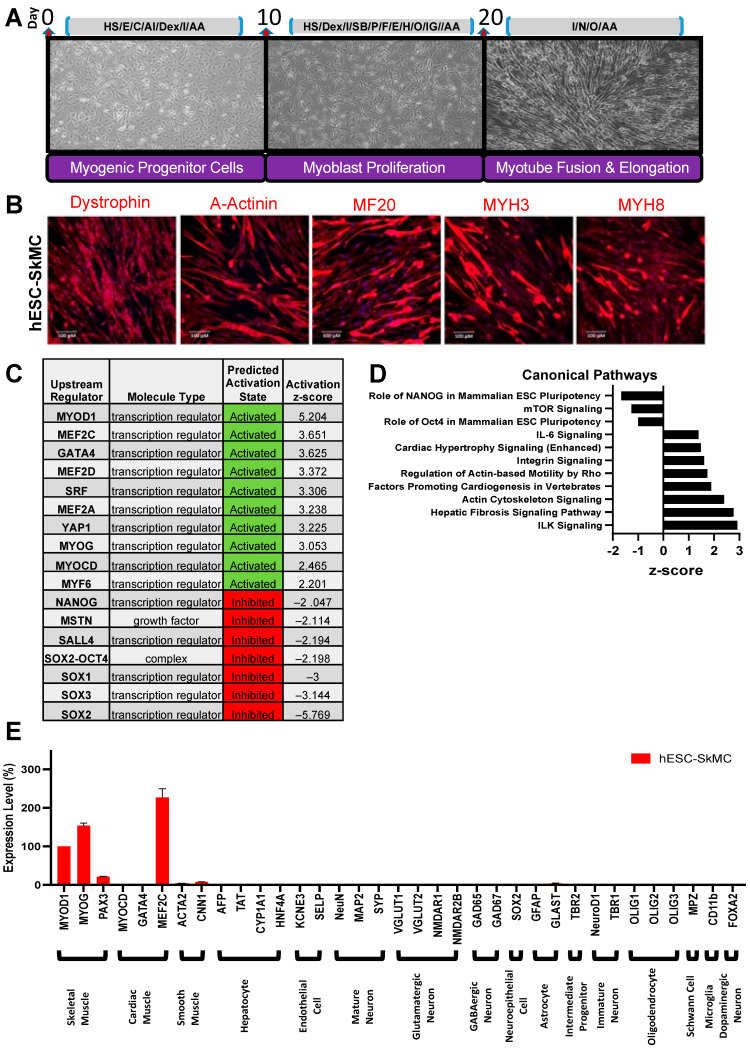
Skeletal muscle weakness is linked to many adverse health outcomes. Current research to identify new drugs has often been inconclusive due to lack of adequate cellular models. We previously developed a scalable monolayer system to differentiate human embryonic stem cells (hESCs) into mature skeletal muscle cells (SkMCs) within 26 days without cell sorting or genetic manipulation. Here, building on our previous work, we show that differentiation and fusion of myotubes can be further enhanced using the anabolic factors testosterone (T) and follistatin (F) in combination with a cocktail of myokines (C). Importantly, combined TFC treatment significantly enhanced both the hESC-SkMC fusion index and the expression levels of various skeletal muscle markers, including the motor protein myosin heavy chain (MyHC). Transcriptomic and proteomic analysis revealed oxidative phosphorylation as the most up-regulated pathway, and a significantly higher level of ATP and increased mitochondrial mass were also observed in TFC-treated hESC-SkMCs, suggesting enhanced energy metabolism is coupled with improved muscle differentiation. This cellular model will be a powerful tool for studying in vitro myogenesis and for drug discovery pertaining to further enhancing muscle development or treating muscle diseases.
Keywords: human embryonic stem cell; myokines; myosin heavy chain; myotubes; skeletal muscle.
Conflict of interest statement
The authors declare no conflict of interest.
Figures


Similar articles
-
A Human Pluripotent Stem Cell Model of Facioscapulohumeral Muscular Dystrophy-Affected Skeletal Muscles.Stem Cells Transl Med. 2016 Sep;5(9):1145-61. doi: 10.5966/sctm.2015-0224. Epub 2016 May 23. Stem Cells Transl Med. 2016. PMID: 27217344 Free PMC article.
-
Gene expression profiling of skeletal myogenesis in human embryonic stem cells reveals a potential cascade of transcription factors regulating stages of myogenesis, including quiescent/activated satellite cell-like gene expression.PLoS One. 2019 Sep 27;14(9):e0222946. doi: 10.1371/journal.pone.0222946. eCollection 2019. PLoS One. 2019. PMID: 31560727 Free PMC article.
-
Biochemical and functional characterization of skeletal muscle cells differentiated from tonsil-derived mesenchymal stem cells.Muscle Nerve. 2023 Aug;68(2):219-229. doi: 10.1002/mus.27847. Epub 2023 May 27. Muscle Nerve. 2023. PMID: 37243484
-
Toxoplasma gondii within skeletal muscle cells: a critical interplay for food-borne parasite transmission.Int J Parasitol. 2014 Feb;44(2):91-8. doi: 10.1016/j.ijpara.2013.10.001. Epub 2013 Oct 30. Int J Parasitol. 2014. PMID: 24184158 Review.
-
Muscle fiber type diversity revealed by anti-myosin heavy chain antibodies.FEBS J. 2018 Oct;285(20):3688-3694. doi: 10.1111/febs.14502. Epub 2018 May 24. FEBS J. 2018. PMID: 29761627 Review.
Cited by
-
The Heart Has Intrinsic Ketogenic Capacity that Mediates NAD+ Therapy in HFpEF.Circ Res. 2025 May 9;136(10):1113-1130. doi: 10.1161/CIRCRESAHA.124.325550. Epub 2025 Apr 11. Circ Res. 2025. PMID: 40211954 Free PMC article.
-
Induced Pluripotent Stem Cells for Modeling Physiological and Pathological Striated Muscle Complexity.J Neuromuscul Dis. 2023;10(5):761-776. doi: 10.3233/JND-230076. J Neuromuscul Dis. 2023. PMID: 37522215 Free PMC article. Review.
-
Exploring the link between the ZJU index and sarcopenia in adults aged 20-59 using NHANES and machine learning.Sci Rep. 2025 Jul 2;15(1):22650. doi: 10.1038/s41598-025-01124-w. Sci Rep. 2025. PMID: 40593830 Free PMC article.
References
Publication types
MeSH terms
Grants and funding
LinkOut - more resources
Full Text Sources
Other Literature Sources
Molecular Biology Databases
