Tissue-Specific Expression of TIGIT, PD-1, TIM-3, and CD39 by γδ T Cells in Ovarian Cancer
- PMID: 35326415
- PMCID: PMC8946192
- DOI: 10.3390/cells11060964
Tissue-Specific Expression of TIGIT, PD-1, TIM-3, and CD39 by γδ T Cells in Ovarian Cancer
Abstract
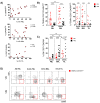
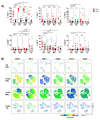
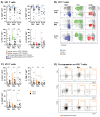
Phenotypic characterization of γδ T cells in the MALs (malignant ascites lymphocytes), TILs (tumor infiltrating lymphocytes), and PBLs (peripheral blood lymphocytes) of ovarian cancer (OvCA) patients is lacking. Therefore, we quantified γδ T cell prevalence in MAL, TIL, and PBL specimens from n = 18 OvCA patients and PBL from age-matched healthy donors (HD, n = 14). Multicolor flow cytometry was performed to evaluate the expression of inhibitory receptors (TIGIT, PD-1 and TIM-3), stimulatory receptors (Ox40), and purinergic ectoenzymes (CD39 and CD73) on γδ T cell subsets. We identified an abundant infiltration of Vδ1 T cells in the MALs and TILs. These cells varied in their differentiation: The majority of Vδ1 TILs displayed an effector memory (EM) phenotype, whereas Vδ1 MALs had a more mature phenotype of terminally differentiated effector memory cells (TEMRA) with high CD45RA expression. TIGIT and TIM-3 were abundantly expressed in both MALs and PBLs, whereas Vδ1 TILs exhibited the highest levels of PD-1, CD39, and Ox40. We also observed specific clusters on mature differentiation stages for the analyzed molecules. Regarding co-expression, Vδ1 TILs showed the highest levels of cells co-expressing TIGIT with PD-1 or CD39 compared to MALs and PBLs. In conclusion, the Vδ1 T cell population showed a high prevalence in the MALs and primary tumors of OvCA patients. Due to their (co-)expression of targetable immune receptors, in particular TIGIT with PD-1 and CD39 in TILs, Vδ1 T cell-based approaches combined with the inhibition of these targets might represent a promising strategy for OvCA.
Keywords: CD39; PD-1; TIGIT; TIL; ascites; co-expression; differentiation; ovarian cancer; γδ T cells.
Conflict of interest statement
F.B.: Travel grant Daiichi Sankyo, Servier, Novartis; advisory board by Jazz. GmbH, Daiichi Sankyo. W.F.: Membership on an entity’s board of directors or advisory: Amgen, ARIAD/Incucyte, Pfizer, Novartis, Jazz Pharmaceuticals, Morphosys, Abbvie, Celgene; patents and royalities: Amgen; other support for meeting attendance: Amgen, Gilead, Jazz Pharmaceuticals, Servier, Daiichi Sankyo; research funding: Amgen, Pfizer. Travel grant, advisory board, and research funding by Amgen Inc.; travel grant and advisory board by TEVA GmbH, the advisory board: Ariad/Incucyte Inc., travel grant by Gilead Inc and Jazz. GmbH, research funding by Pfizer Inc. C.B.: Travel grant: Astra Zeneca, Bayer Healthcare, Berlin Chemie, Bristol Myers Squipp, Jansen Cilag, Merck Serono, Merck Sharp Dohme, Novartis, Roche Pharma, Sanofi Aventis; advisory board: Astra Zeneca, Bayer Healthcare, Berlin Chemie, Bristol Myers Squipp, Jansen Cilag, Merck Serono, Merck Sharp Dohme, Novartis, Roche Pharma, Sanofi Aventis; invited speaker: AOK Germany, med update, Merck Serono; Honoraria: AOK Germany, Astra Zeneca, Bayer Healthcare, Berlin Chemie, GSO Research Organisation, Jansen-Cilag, med update, Merck Serono, Merck Sharp Dohme, Novartis, Roche Pharma, Sanofi Aventis. The sponsors had no role in the design, execution, interpretation, or writing of the study. The remaining authors declare that they have no conflict of interest.
Figures


Similar articles
-
Bone Marrow-Resident Vδ1 T Cells Co-express TIGIT With PD-1, TIM-3 or CD39 in AML and Myeloma.Front Med (Lausanne). 2021 Nov 8;8:763773. doi: 10.3389/fmed.2021.763773. eCollection 2021. Front Med (Lausanne). 2021. PMID: 34820398 Free PMC article.
-
High co-expression of immune checkpoint receptors PD-1, CTLA-4, LAG-3, TIM-3, and TIGIT on tumor-infiltrating lymphocytes in early-stage breast cancer.World J Surg Oncol. 2022 Oct 21;20(1):349. doi: 10.1186/s12957-022-02810-z. World J Surg Oncol. 2022. PMID: 36271406 Free PMC article.
-
Expression of CD39 is associated with T cell exhaustion in ovarian cancer and its blockade reverts T cell dysfunction.Oncoimmunology. 2024 May 9;13(1):2346359. doi: 10.1080/2162402X.2024.2346359. eCollection 2024. Oncoimmunology. 2024. PMID: 38737794 Free PMC article.
-
TIGIT, A Novel Therapeutic Target for Tumor Immunotherapy.Immunol Invest. 2017 Feb;46(2):172-182. doi: 10.1080/08820139.2016.1237524. Epub 2016 Nov 7. Immunol Invest. 2017. PMID: 27819527 Review.
-
Tim-3, Lag-3, and TIGIT.Curr Top Microbiol Immunol. 2017;410:127-156. doi: 10.1007/82_2017_62. Curr Top Microbiol Immunol. 2017. PMID: 28900677 Free PMC article. Review.
Cited by
-
γδ T cell exhaustion: Opportunities for intervention.J Leukoc Biol. 2022 Dec;112(6):1669-1676. doi: 10.1002/JLB.5MR0722-777R. Epub 2022 Aug 24. J Leukoc Biol. 2022. PMID: 36000310 Free PMC article. Review.
-
NKG2A Immune Checkpoint in Vδ2 T Cells: Emerging Application in Cancer Immunotherapy.Cancers (Basel). 2023 Feb 16;15(4):1264. doi: 10.3390/cancers15041264. Cancers (Basel). 2023. PMID: 36831606 Free PMC article. Review.
-
Association of Tissue Expression of LAG-3 and TIM-3 with Clinical Features in Ovarian Cancer.Int J Mol Sci. 2025 Jun 22;26(13):5996. doi: 10.3390/ijms26135996. Int J Mol Sci. 2025. PMID: 40649775 Free PMC article.
-
Function and Spatial Organization of Tumor-Invasive Human γδ T Cells-What Do We Know?Eur J Immunol. 2025 Jan;55(1):e202451075. doi: 10.1002/eji.202451075. Epub 2024 Dec 2. Eur J Immunol. 2025. PMID: 39623788 Free PMC article. Review.
-
Vdelta1 T cells are more resistant than Vdelta2 T cells to the immunosuppressive properties of galectin-3.Front Immunol. 2024 Jan 8;14:1286097. doi: 10.3389/fimmu.2023.1286097. eCollection 2023. Front Immunol. 2024. PMID: 38259448 Free PMC article.
References
Publication types
MeSH terms
Substances
Grants and funding
LinkOut - more resources
Full Text Sources
Medical
Research Materials

