. 2022 Mar 15;11(6):994.
doi: 10.3390/cells11060994.

Ex Vivo Generation of CAR Macrophages from Hematopoietic Stem and Progenitor Cells for Use in Cancer Therapy

Affiliations

Ex Vivo Generation of CAR Macrophages from Hematopoietic Stem and Progenitor Cells for Use in Cancer Therapy

Daniela Paasch et al. Cells. .

Abstract

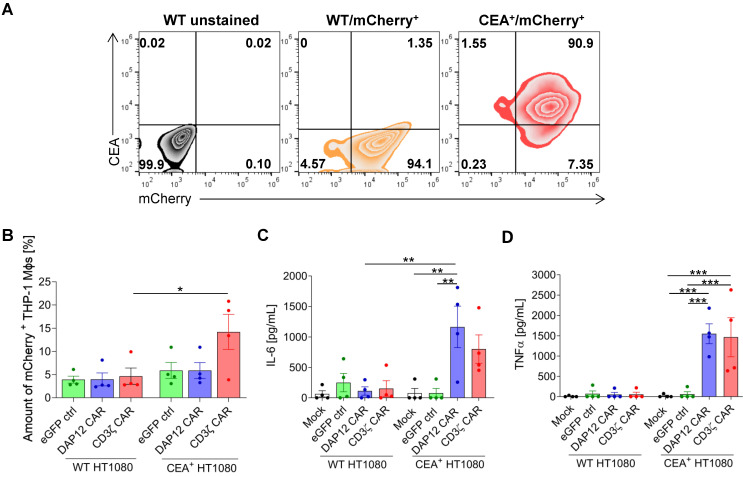
Chimeric antigen receptor (CAR) T-cell therapies have shown impressive results in patients with hematological malignancies; however, little success has been achieved in the treatment of solid tumors. Recently, macrophages (MΦs) were identified as an additional candidate for the CAR approach, and initial proof of concept studies using peripheral blood-derived monocytes showed antigen-redirected activation of CAR MΦs. However, some patients may not be suitable for monocyte-apheresis, and prior cancer treatment regimens may negatively affect immune cell number and functionality. To address this problem, we here introduce primary human hematopoietic stem and progenitor cells (HSPCs) as a cell source to generate functional CAR MΦs ex vivo. Our data showed successful CAR expression in cord blood (CB)-derived HSPCs, with considerable cell expansion during differentiation to CAR MΦs. HSPC-derived MΦs showed typical MΦ morphology, phenotype, and basic anti-bacterial functionality. CAR MΦs targeting the carcinoembryonic antigen (CEA) and containing either a DAP12- or a CD3ζ-derived signaling domain showed antigen redirected activation as they secreted pro-inflammatory cytokines specifically upon contact with CEA+ target cells. In addition, CD3ζ-expressing CAR MΦs exhibited significantly enhanced phagocytosis of CEA+ HT1080 cells. Our data establish human HSPCs as a suitable cell source to generate functional CAR MΦs and further support the use of CAR MΦs in the context of solid tumor therapy.

Keywords: cancer; cancer immunotherapy; chimeric antigen receptors; hematopoietic stem cells; macrophages; phagocytosis; solid tumors.


Conflict of interest statement

The authors declare no conflict of interest.

Figures

Figure A1
Figure A1
Assessment of CAR expression and characterization in MONO-MAC-6 cells. (A) Representative flow cytometric analyses of eGFP and CAR expression in MONO-MAC-6 cells transduced with eGFP alone (eGFP ctrl), the DAP12 CAR construct, or the CD3ζ CAR construct. Mock-transduced cells (mock) were used as additional controls. Mean fluorescence intensity of (B) eGFP and (C) IgG expression in MONO-MAC-6 cells. Data (AC) are represented as the mean ± s.e.m. of n = 2 biological replicates. (D) Flow cytometric analyses of MΦ surface markers (n = 1).
Figure A2
Figure A2
Characterization of THP-1 cells transduced with CAR constructs. (A) Representative flow cytometric analyses of eGFP and CAR expression in THP-1 cells. Mean fluorescence intensity of (B) eGFP and (C) IgG expression in THP-1 cells. Data are represented as the mean ± s.e.m. of n = 3 biological replicates. (D) Flow cytometric analyses of monocytic surface markers on unmodified (mock) and modified THP-1 cells (n = 2). (E) Microscopic analyses of THP-1 cell morphology using May–Grünwald-stained cytospins (40× magnification using the fluorescence microscope Olympus IX71, scale bar: 50 µM). (F) pHrodo-based analysis of phagocytic cells via flow cytometry (n = 1). (G) Microscopic images of undifferentiated and PMA-differentiated THP-1 cells using the fluorescence microscope Olympus IX71 (scale bar: 100 µm and 20 µm). (H) Analysis of THP-1 differentiation efficiency shown by percentage of adherent cells after PMA stimulation. Flow cytometric analysis of (I) viability and (J) apoptosis rate in unmodified and modified THP-1 cells. Data shown in (HJ) are represented as the mean ± s.e.m. of n = 3 biological replicates. ctrl: control.
Figure A3
Figure A3
Validation of efficiency and MΦ characteristics after lentiviral transduction of HPSCs. (A) Transduction efficiencies in CD34+ cells using an MOI 5 (n = 15). Flow cytometric analysis of (B) eGFP and (C) CAR expression was determined in sorted and differentiated MΦs using an antibody to detect the IgG of the CAR constructs. Data are represented as the mean ± s.e.m. of n = 3 biological replicates. (D) Vector copy number analysis via qPCR. Data are represented as the mean ± s.e.m. of n = 4 biological replicates. (E) pHrodo-based analysis of phagocytic cells via fluorescent microscopy (20× magnification, scale bar: 20 µm). Statistical significance was calculated with one-way ANOVA using multiple comparisons (** indicates p < 0.01). Mock: untransduced CD34-derived MΦs; ctrl: control.
Figure 1
Figure 1
Expression of anti-CEA CARs in differentiated CAR THP-1 cells. (A) Scheme depicting the structure of both anti-CEA CARs. (B) Flow cytometric analyses of eGFP and CAR expression in differentiated THP-1 cells. Controls included mock-transduced THP-1 cells (Mock) and THP-1 cells transduced with a lentiviral vector designed to express eGFP alone (eGFP ctrl). Plots are shown for a representative out of 3 experiments. (C) Microscopic analyses of THP-1 cell morphology using May–Grünwald-stained cytospins (40× magnification using the fluorescence microscope Olympus IX71, scale bar: 50 µM). (D) Flow cytometric analyses of surface markers on differentiated THP-1 cells. Data are representative out of 2 experiments. (E) Analysis of phagocytic activity of E. coli particles in THP-1 cells as revealed by flow cytometry. Median phagocytosis percentages with standard deviations are shown (n = 3). scFv: single chain variable fragment; TM: transmembrane domain; Co-SD: costimulatory signaling domain; IgG: human IgG1 CH2CH3; ctrl: control.
Figure 2
Figure 2
CAR-mediated cancer cell phagocytosis and cytokine secretion of THP-1-derived MΦs. (A) Flow cytometric analyses of mCherry and CEA expression in HT1080 target cells. (B) Percentage of mCherry+ MΦs after co-culture with target cells analyzed by flow cytometry (n = 4). ELISA assays showing (C) IL-6 and (D) TNFα secretion by THP-1-derived MΦs after co-culture with WT/mCherry+ or CEA+/mCherry+ HT1080 cells. Data (C,D) are represented as the mean ± s.e.m. of n = 4 biological replicates measured in duplicate. Statistical significance was calculated with one-way ANOVA using multiple comparisons (*** indicates p < 0.001, ** indicates p < 0.01, and * indicates p < 0.03). Mock: untransduced THP-1-derived MΦs, ctrl: control.
Figure 3
Figure 3
Generation and characterization of cord blood-derived anti-CEA CAR MΦs. (A) Overview of the CAR MΦ generation protocol showing the cord blood CD34+ cell isolation, transduction with CAR constructs, and differentiation into MΦs (created with BioRender.com). Numbers of (B) eGFP+ sorted CB-derived CD34+ cells and (C) differentiated MΦs obtained. (D) Expansion factor during differentiation of CB-derived CD34+ cells to MΦs. Cells were counted after sorting and at the end of the differentiation using a Neubauer chamber (n = 5). (E) Flow cytometric analyses of eGFP and CAR expression (as detected by the extracellular IgG CAR domain) in differentiated MΦs. Plots are shown for a representative out of 4 experiments. (F) Microscopic analysis of MΦ morphology in May–Grünwald-stained cytospins (40× magnification using the fluorescence microscope Olympus IX71, scale bar: 50 µm). (G) Flow cytometric analysis of MΦ surface markers. Plots are shown for a representative out of 4 experiments. (H) Flow cytometric analysis of MΦ polarization M1 and M2 surface markers in transduced (eGFP+) MΦs. Plots are shown for a representative out of 3 experiments. (I) pHrodo-based analysis of basic anti-bacterial phagocytic activity in MΦs by flow cytometry. Data are represented as the mean ± s.e.m. of n = 3–4 biological replicates. (EI) Mock: non-transduced controls; ctrl: control; HSPC ctrl: hematopoietic stem and progenitor cell control.
Figure 3
Figure 3
Generation and characterization of cord blood-derived anti-CEA CAR MΦs. (A) Overview of the CAR MΦ generation protocol showing the cord blood CD34+ cell isolation, transduction with CAR constructs, and differentiation into MΦs (created with BioRender.com). Numbers of (B) eGFP+ sorted CB-derived CD34+ cells and (C) differentiated MΦs obtained. (D) Expansion factor during differentiation of CB-derived CD34+ cells to MΦs. Cells were counted after sorting and at the end of the differentiation using a Neubauer chamber (n = 5). (E) Flow cytometric analyses of eGFP and CAR expression (as detected by the extracellular IgG CAR domain) in differentiated MΦs. Plots are shown for a representative out of 4 experiments. (F) Microscopic analysis of MΦ morphology in May–Grünwald-stained cytospins (40× magnification using the fluorescence microscope Olympus IX71, scale bar: 50 µm). (G) Flow cytometric analysis of MΦ surface markers. Plots are shown for a representative out of 4 experiments. (H) Flow cytometric analysis of MΦ polarization M1 and M2 surface markers in transduced (eGFP+) MΦs. Plots are shown for a representative out of 3 experiments. (I) pHrodo-based analysis of basic anti-bacterial phagocytic activity in MΦs by flow cytometry. Data are represented as the mean ± s.e.m. of n = 3–4 biological replicates. (EI) Mock: non-transduced controls; ctrl: control; HSPC ctrl: hematopoietic stem and progenitor cell control.
Figure 4
Figure 4
CAR-mediated cytokine secretion after stimulation of anti-CEA CAR MΦs with an anti-BW431/26 idiotypic antibody. ELISA assays exhibiting (A) IL-6 and (B) TNFα secretion from MΦs after 24 h stimulation with an immobilized anti-idiotypic antibody against the anti-CEA scFv. Data are represented as the mean ± s.e.m. of n = 6 biological replicates. Statistical significance was calculated with one-way ANOVA using multiple comparisons. (C) Two biological replicates (shown as colored boxes or stars) were further assessed for cytokine/chemokine production by a cytokine multiplex assay (*** indicates p < 0.001, ** indicates p < 0.01, and * indicates p < 0.03). Mock: untransduced CD34-derived MΦs; ctrl: control; #: value measured was above detection level.
Figure 5
Figure 5
CAR-mediated cytokine secretion and phagocytosis after co-culture of MΦs with WT/mCherry+ or CEA+/mCherry+ HT1080 target cells. (A) IL-6 and (B) TNFα secretion in MΦs after co-culture with WT/mCherry+ or CEA+/mCherry+ HT1080 cells. Data are represented as the mean ± s.e.m. of n = 3 biological replicates. Statistical significance was calculated with one-way ANOVA using multiple comparisons. (C) Confocal microscopy images showing phagocytosis of WT/mCherry+ or CEA+/mCherry+ HT1080 cells (mCherry) by CAR MΦs (eGFP) (63× oil immersion objective of the Leica DMi8 confocal microscope, scale bar: 20 µm). Images are shown for a representative out of 2 experiments. (D) Analysis of confocal images depicted via the geometric mean of mCherry signal intensity inside the MΦs. Data are represented as the mean ± s.e.m. of n = 2 biological replicates, with 2-3 random fields of view analyzed per replicate. Flow cytometric analysis of (E) % of mCherry+ MΦs and (F) geometric mean of mCherry signal intensity of eGFP+ MΦs after co-culture with target cells. Data are represented as the mean ± s.e.m. of n = 6 biological replicates. Statistical significance was calculated with one-way ANOVA using multiple comparisons. ** indicates p < 0.01, and * indicates p < 0.03. Mock: untransduced CD34-derived MΦs; ctrl: control.

Similar articles

Cited by

References

    1. Arruebo M., Vilaboa N., Sáez-Gutierrez B., Lambea J., Tres A., Valladares M., González-Fernández A. Assessment of the evolution of cancer treatment therapies. Cancers. 2011;3:3279–3330. doi: 10.3390/cancers3033279. - DOI - PMC - PubMed
    1. Perica K., Varela J.C., Oelke M., Schneck J. Adoptive T cell immunotherapy for cancer. Rambam Maimonides Med. J. 2015;6:e0004. doi: 10.5041/RMMJ.10179. - DOI - PMC - PubMed
    1. Maude S.L., Laetsch T.W., Buechner J., Rives S., Boyer M., Bittencourt H., Bader P., Verneris M.R., Stefanski H.E., Myers G.D., et al. Tisagenlecleucel in Children and Young Adults with B-Cell Lymphoblastic Leukemia. N. Engl. J. Med. 2018;378:439–448. doi: 10.1056/NEJMoa1709866. - DOI - PMC - PubMed
    1. Schuster S.J., Svoboda J., Chong E.A., Nasta S.D., Mato A.R., Anak Ö., Brogdon J.L., Pruteanu-Malinici I., Bhoj V., Landsburg D., et al. Chimeric Antigen Receptor T Cells in Refractory B-Cell Lymphomas. N. Engl. J. Med. 2017;377:2545–2554. doi: 10.1056/NEJMoa1708566. - DOI - PMC - PubMed
    1. June C.H., Sadelain M. Chimeric Antigen Receptor Therapy. N. Engl. J. Med. 2018;379:64–73. doi: 10.1056/NEJMra1706169. - DOI - PMC - PubMed

Publication types