. 2022 Mar 15;11(6):1000.
doi: 10.3390/cells11061000.

SWI/SNF Antagonism of PRC2 Mediates Estrogen-Induced Progesterone Receptor Expression

Affiliations

SWI/SNF Antagonism of PRC2 Mediates Estrogen-Induced Progesterone Receptor Expression

Mike R Wilson et al. Cells. .

Abstract

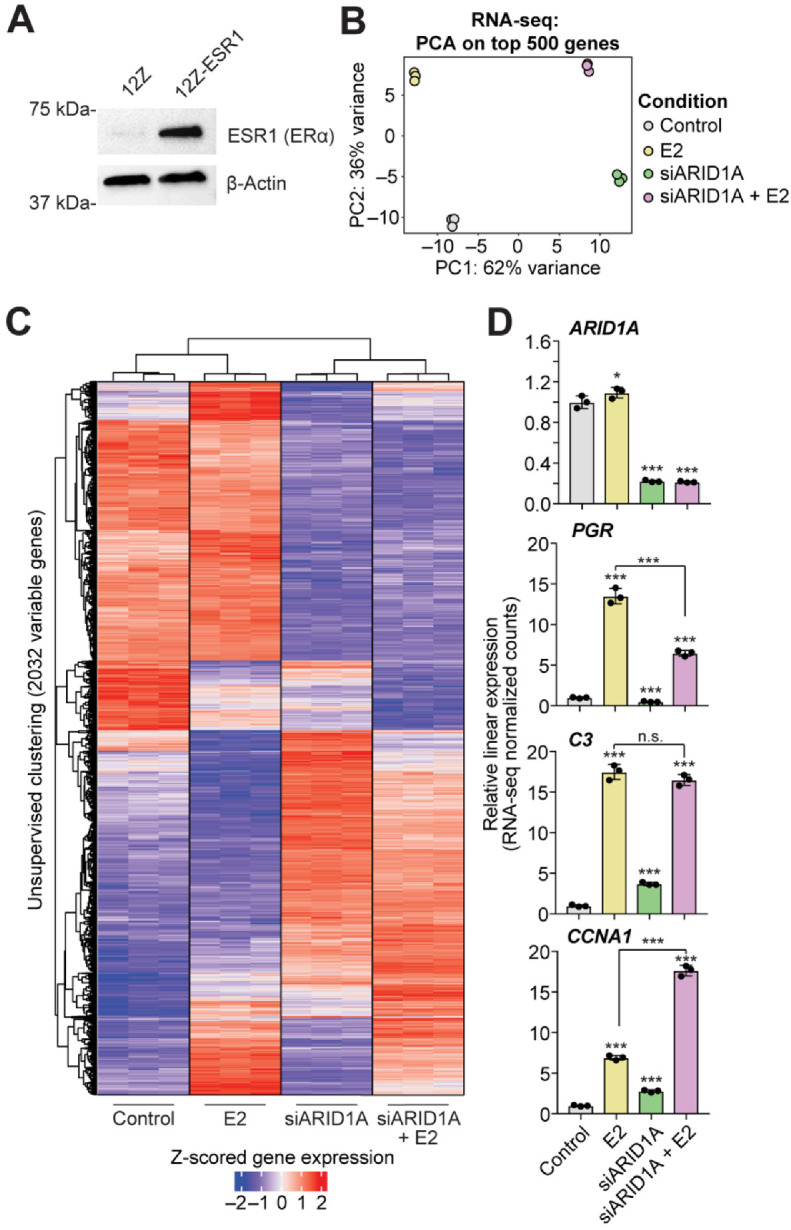
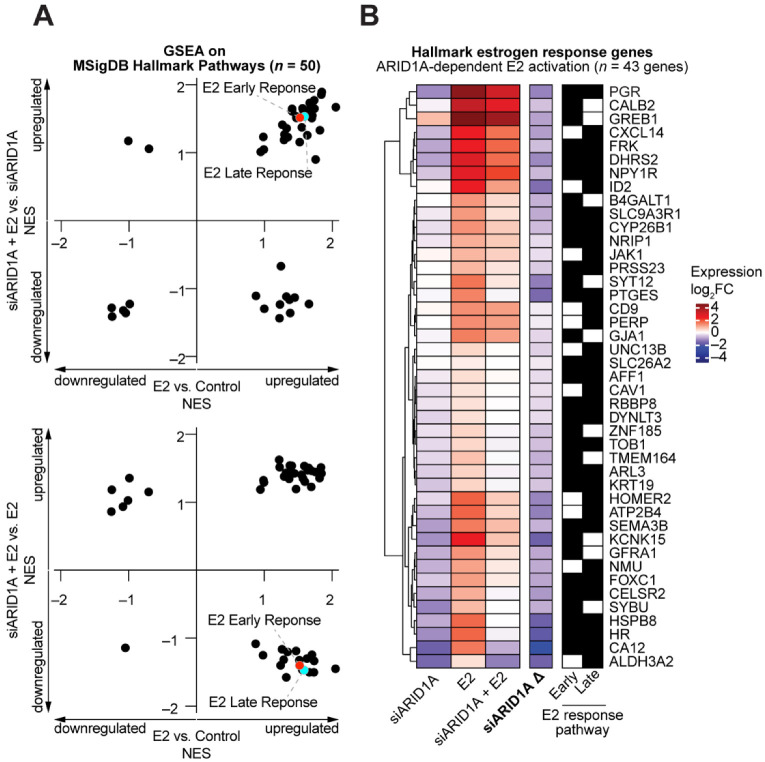
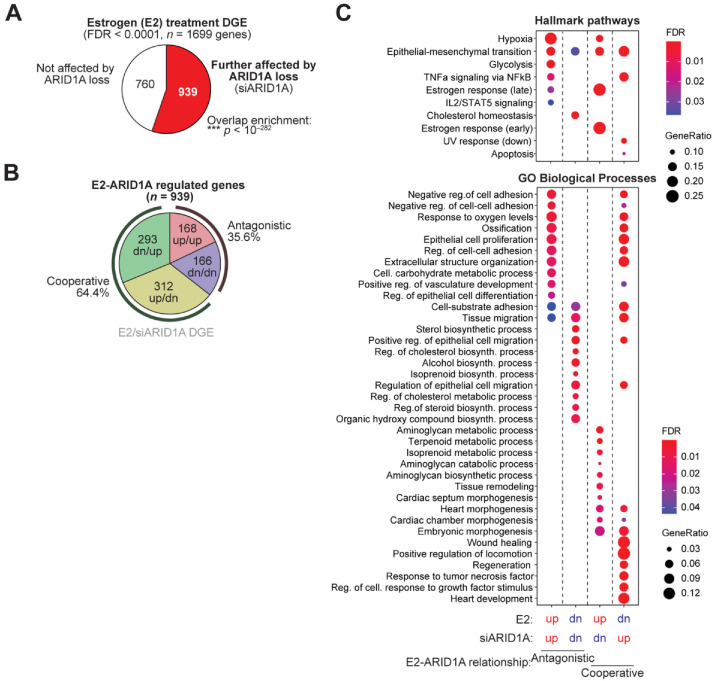
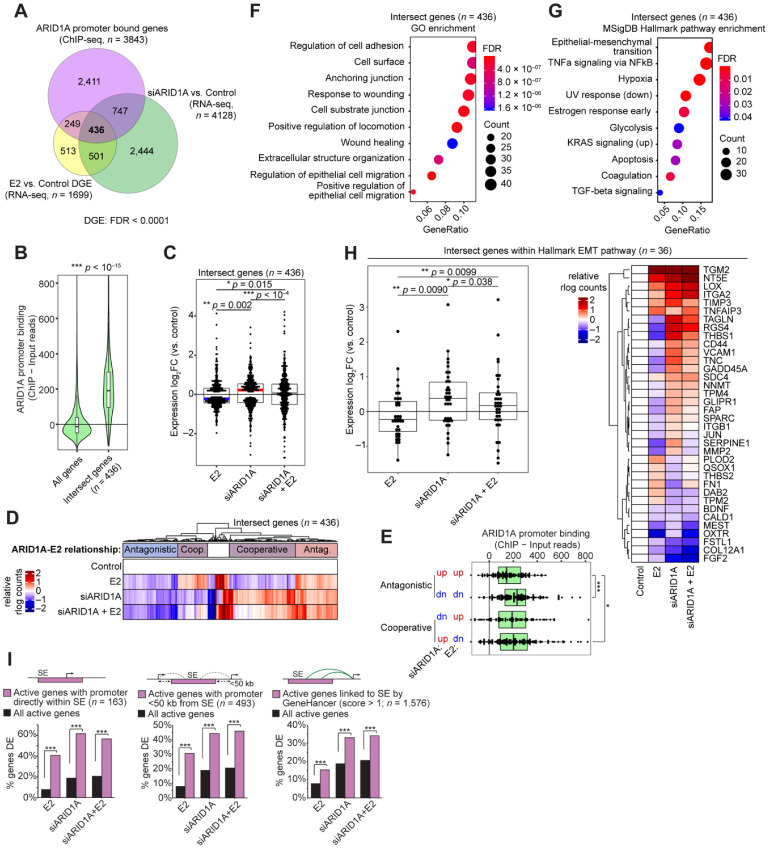
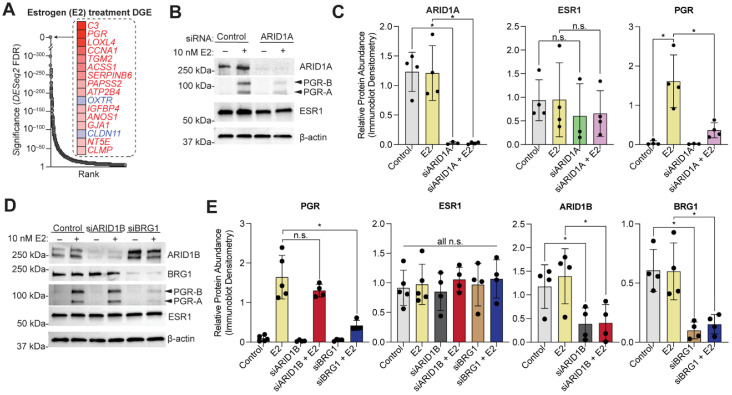
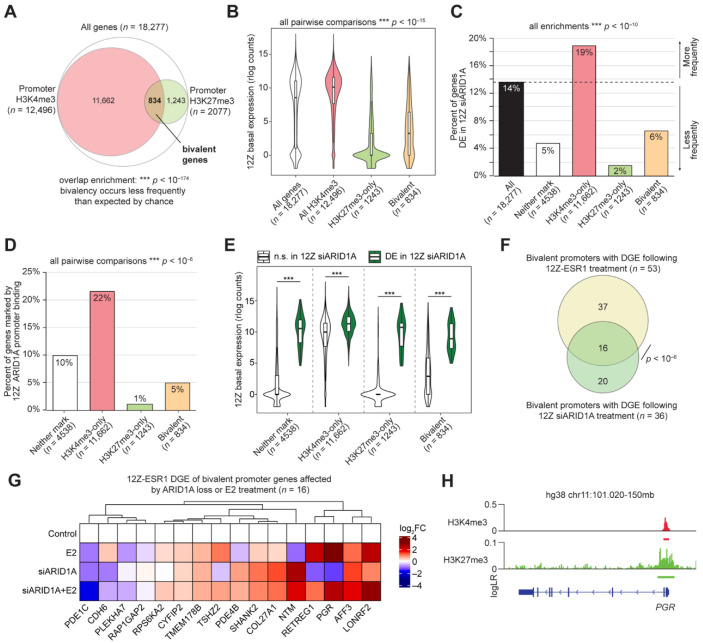
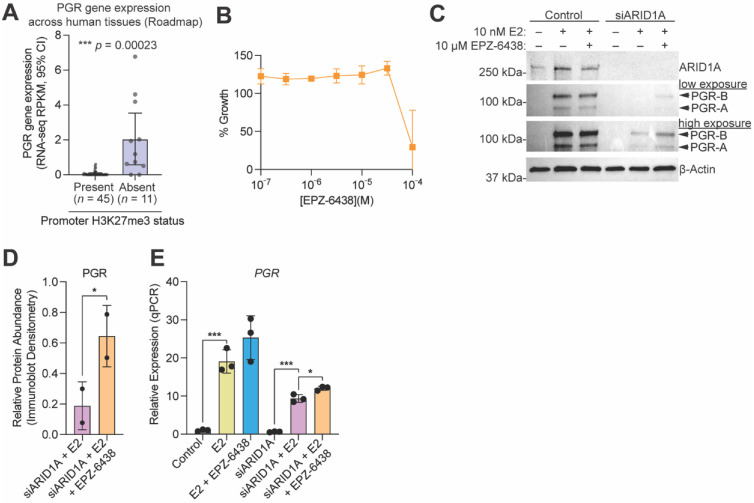
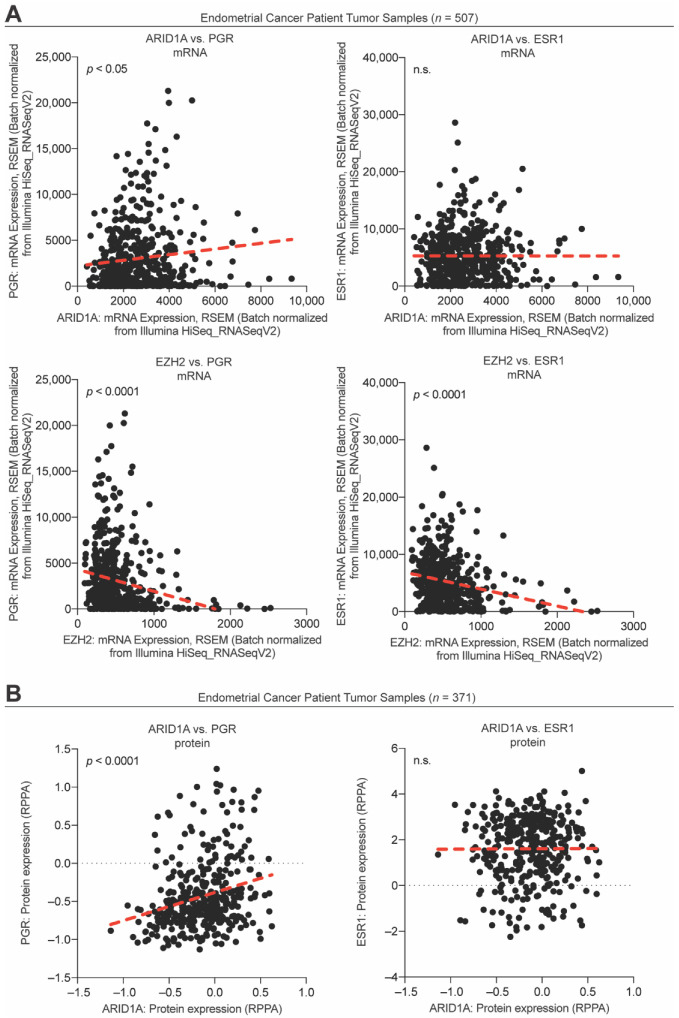
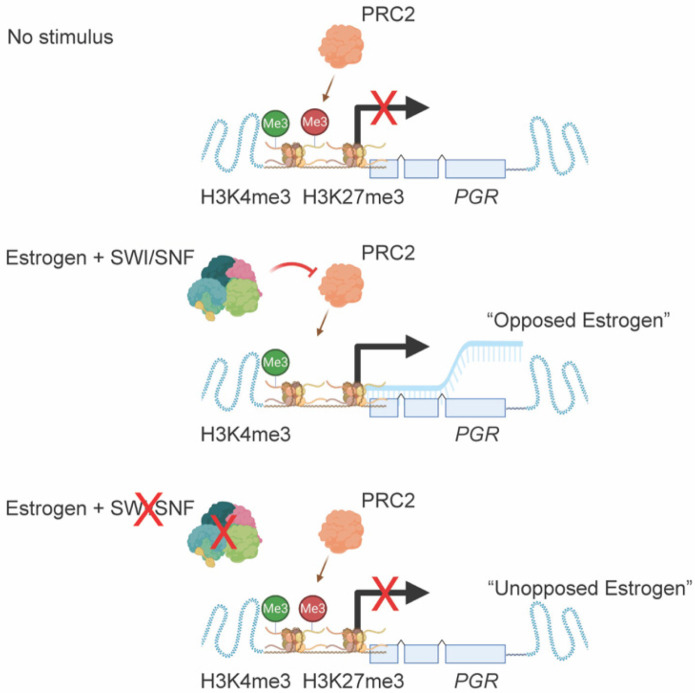
Endometrial cancer (EC) is characterized by high estrogen levels unopposed by progesterone. Treatment with progestins is standard for early EC, but the response to progestins is dependent on progesterone receptor (PGR) expression. Here, we show that the expression of PGR in endometrial epithelial cells is dependent on ARID1A, a DNA-binding subunit of the SWI/SNF chromatin-remodeling complex that is commonly mutated in EC. In endometrial epithelial cells with estrogen receptor overexpression, we find that ARID1A promotes estrogen signaling and regulates common gene expression programs. Normally, endometrial epithelial cells expressing estrogen receptors respond to estrogen by upregulating the PGR. However, when ARID1A expression is lost, upregulation of PGR expression is significantly reduced. This phenomenon can also occur following the loss of the SWI/SNF subunit BRG1, suggesting a role for ARID1A- and BRG1-containing complexes in PGR regulation. We find that PGR is regulated by a bivalent promoter, which harbors both H3K4me3 and H3K27me3 histone tail modifications. H3K27me3 is deposited by EZH2, and inhibition of EZH2 in the context of ARID1A loss results in restoration of estrogen-induced PGR expression. Our results suggest a role for ARID1A deficiency in the loss of PGR in late-stage EC and a therapeutic utility for EZH2 inhibitors in this disease.

Keywords: ARID1A; endometrial cancer; progesterone receptor.


Conflict of interest statement

The authors declare no conflict of interest.

Figures

Figure 1
Figure 1
Differential gene expression response to estrogen signaling following the loss of ARID1A expression. (A) Confirmation of ESR1 expression in 12Z-ERS1 cells by western blot. β-Actin was used as a loading control. (B) Principal component analysis on top 500 variable genes from RNA-seq on 12Z-ESR1 cells following treatment with 10 nM estrogen (E2, yellow), siRNA knockdown of ARID1A (siARID1A, green) or E2 + siARID1A (pink) compared to control (silver). (C) Unsupervised clustering of samples based on the expression of 2032 genes (rows) selected by variance across the experimental design (rlog variance > 0.05). Heatmap displays relative expression as Z-scored rlog counts. Red values indicate high relative gene expression, and blue values indicate low expression. (D) Examples of gene expression alterations following treatment with E2 (yellow), siARID1A (green) or E2 + siARID1A (pink) compared to control (silver). Y-axis represents linear relative gene expression with respect to the control condition. Means ± SDs, n = 3. The statistic is DESeq2 FDR. * FDR < 0.05, *** FDR < 0.001, n.s. is non-significant.
Figure 2
Figure 2
Perturbations in estrogen response following ARID1A loss. (A) Broad Gene Set Enrichment Analysis (GSEA) across RNA-seq conditions. Samples were tested for enrichment of the MsigDB hallmark pathways in the described comparisons, and Normalized Enrichment Scores (NES) are plotted to highlight differences between E2 vs. Control (x-axis) and siARID1A + E2 vs. siARID1A (y-axis, top) or siARID1A + E2 vs. E2 (y-axis, bottom). A full list of individual pathway values are provided in Table 1. E2 Early Response (red) and E2 Late Response (cyan) pathways are indicated. (B) 43 genes within the MsigDB Hallmark early or late estrogen response pathways that are significantly induced by E2 treatment but to a significantly less extent in the context of ARID1A knockdown. Left, clustered heatmap of expression log2FC values in siARID1A, E2, or siARID1A + E2 conditions compared to control cells. siARID1A Δ represents the change in expression between siARID1A + E2 vs. siARID1A conditions. Blue cells indicate downregulation, and red cells indicate upregulation. Right, black cells indicate membership to Hallmark estrogen response early and late pathway gene sets.
Figure 3
Figure 3
Exploring ARID1A-mediated estrogen response. (A) Overlap of 1699 empirical estrogen response genes and siARID1A DGE in 12Z-ESR1 cells. Those further affected by ARID1A loss (red) or not affected by ARID1A loss (white). (B) Directional classification of perturbed genes mutually regulated by E2 and ARID1A. Normal ARID1A regulation is inferred as the opposite effect of siARID1A treatment. Genes upregulated in both conditions (red), downregulated in both conditions (blue), upregulated by E2 and downregulated by siARID1A (yellow) or downregulated by E2 and upregulated by ARID1A (green). (C) Gene set enrichment analysis for MsigDB Hallmark pathways (top) and GO Biological Processes (bottom) among E2-ARID1A regulated gene classes.
Figure 4
Figure 4
ARID1A directly regulates estrogen-induced changes to cell identity. (A) Overlap between differentially expressed genes from E2 vs. Control (n = 1699, yellow) and siARID1A vs. Control (n = 4128, green) in 12Z-ESR1 cells and genes with ARID1A promoter binding by ChIP-seq in 12Z cells (n = 3843, pink) as previously described [24]. (B) Violin plot of ChIP signal for ARID1A binding at 436 intersect genes (as in A) compared to all genes. The unpaired, 2-tailed Wilcoxon was used for analysis. (C) Expression log2 fold-change values of 436 intersect genes following treatment with E2, siARID1A, or both E2 and siARID1A. The paired, 2-tailed Wilcoxon test was used for analysis. Box-and-whiskers plotted in the style of Tukey without outliers. (D) Clustering of 436 genes based on relative gene expression in each condition. Clusters have been labeled as antagonistic (red for upregulted or blue for downregulated) or cooperative (purple) in their regulation by E2 and ARID1A. (E) ARID1A binding among intersect genes segregated into 4 groups based on their direction of gene expression change following E2 or siARID1A treatment. (F) Pathway enrichment analysis of 436 intersect genes for Gene Ontology (GO) Biological Process. (G) Pathway enrichment analysis of 436 intersect genes for MSigDB Hallmark pathways. (H) Left, fold-change values of 36 Hallmark EMT genes found among the 436 intersect genes following treatment with E2, siARID1A, or both E2 and siARID1A. The statistic represented is from the paired, 2-tailed Wilcoxon test. Box-and-whiskers plotted in the style of Tukey without outliers. Right, relative expression of individual 36 EMT intersect genes as a clustered heatmap. (I) Enrichment of DE genes affected by E2 treatment, ARID1A loss, or both for genes with active promoters directly inside of super-enhancer (SE, pink) (n = 163) (left), promoters within 50 kb of a super-enhancer (n = 493) (center), or genes linked to super-enhancer by the GeneHancer database (n = 1576) (right) compared to enrichment for all active genes (black). Hypergeometric enrichment was used for analysis.
Figure 5
Figure 5
SWI/SNF mediates activation of PGR expression following E2 stimulation. (A) Rank visualization of top estrogen-regulated genes in 12Z-ESR1 cells. Red indicates upregulated genes, blue indicates downregulated genes. (B) Western blot analysis in 12Z-ESR1 cells following treatment with E2, siARID1A, or both E2 and siARID1A for ARID1A, PGR, and ESR1. PGR isoforms are indicated by arrowheads. β-Actin was used as a loading control. Blot is representative of 4 independent experiments. (C) Densitometry analysis of protein expression of ARID1A, PGR, and ESR1 following western blot as in panel B for control (silver), E2 (yellow), siARID1A (green) and siARID1A + E2 (pink). Densitometry values were normalized to β-Actin. Means ± SDs, n = 3–4. The paired t-test was used for analysis. (D) Western blot analysis in 12Z-ESR1 cells following treatment with E2, siBRG1, siARID1B, siBRG1+E2, or siARID1B+E2 for ARID1B, BRG1, PGR, and ESR1. PGR isoforms are indicated by arrowheads. β-Actin was used as a loading control. Blot is representative of 4 independent experiments. (E) Densitometry analysis of protein expression of ARID1B, BRG1, PGR, and ESR1 following western blot as in panel D for control (silver), E2 (yellow), siARID1B (charcoal), siARID1B + E2 (red), siBRG1 (brown) and siBRG1 + E2 (purple). Densitometry values were normalized to β-Actin. Means ± SDs, n = 4–5. The statistic is paired t-test. * p < 0.05; n.s. is non-significant.
Figure 6
Figure 6
ARID1A regulation of bivalent gene promoters. (A) Proportional Euler diagram displaying overlap between genes with promoter H3K4me3 (n = 12,496, red) or H3K27me3 (n = 2077, green) among all expressed genes (n = 18,277, white). Hypergeometric enrichment was used for analysis. (B) Violin plot of 12Z basal expression of all genes with H3K4me3 at the promoter (red), genes with both H3K4me3 and H3K27me3 at the promoter (bivalent, yellow), and genes with only H3K27me3 at the promoter (green) relative to all genes (white). The unpaired, 2-tailed Wilcoxon test was used for analysis. 12Z gene expression from GSE121198 [24]. (C) Percent of genes with differential gene expression following siARID1A treatment of 12Z cells among genes with bivalent promoters (yellow), H3K4me3 only (red), H3K27me3 only (green), or neither (white) relative to all genes (black). Hypergeometric enrichment was used for analysis. (D) Percent of genes with ARID1A binding at the promoter among genes with bivalent promoters (yellow), H3K4me3 only (red), H3K27me3 only (green), or neither (white). The 2-tailed Fisher’s exact test was used for analysis. (E) Violin plot of basal expression of all genes with bivalent promoters, H3K4me4 only, H3K27me3 only, or neither, further segregated based on whether the gene exhibited differential gene expression following ARID1A loss (green) or not (white) in 12Z cells. The unpaired, 2-tailed Wilcoxon test was used for analysis. (F) Proportional Euler diagram displaying overlap between bivalent genes with differential gene expression in 12Z-ESR1 cells following E2 treatment (n = 53, yellow) and 12Z cells following ARID1A loss (n = 36, green) Hypergeometric enrichment was used for analysis (G) Differential expression heatmap of 16 genes from an overlapping group of panel F. (H) Genomic snapshot of ChIP signals for H3K4me3 (red) and H3K27me3 (green) at the PGR locus of 12Z cells. For signal tracks, the y-axis represents the assay signal-to-noise presented as the log-likelihood ratio (logLR) as reported by MACS2, and the small bars below the tracks represent replicate overlapping peaks. *** p < 0.001.
Figure 7
Figure 7
SWI/SNF antagonizes PCR2 to promote PGR expression following estrogen stimulation. (A) PGR gene expression (quantified by RPKM (Reads Per Kilobase of transcript, per Million mapped reads) at 95% confidence interval (CI)) in human tissue samples with (purple) vs. without (grey) promoter H3K27me3, taken from the NIH Epigenomics Roadmap. (B) Cell growth assay of 12Z cells treated with EPZ-6438 at concentrations from 100 nM to 100 μM. M is moles.(C) Western blot analysis in 12Z-ESR1 cells following treatment with E2, siARID1A or both, with or without 10 µM EPZ-6438 treatment, for ARID1A, PGR and ESR1. PGR isoforms are indicated by arrowheads. β-Actin was used as a loading control. Blot is representative of 2 independent experiments. (D) Densitometry analysis of protein expression of PGR following western blot as in panel C for siARID1A + E2 (pink) or siARID1A + E2 + EPZ-6428 (orange). Densitometry values were normalized to β-Actin are relative to the E2 only condition. Means ± SDs, n = 2. The statistic is paired t-test. (E) Quantitative PCR (qPCR) analysis of PGR gene expression 12Z-ESR1 cells following treatment with 10 nM E2 (yellow), 10 nM E2 + 10 µM EPZ-6438 (blue), siARID1A (green), siARID1A + E2 (pink), and siARID1A + 10 nM E2 + 10 µM EPZ-6438 (orange) relative to control (grey). Data represents 3 biological replicates, means ± SD. The unpaired t-test was used for analysis. * p < 0.05; *** p < 0.001.
Figure 8
Figure 8
Correlations between PGR, ESR1, ARID1A, and EZH2 among endometrial cancer patient tumor samples. (A) Endometrial cancer tumor sample mRNA expression from 507 samples for ARID1A and PGR (upper left), ARID1A and ESR1 (upper right), EZH2 and PGR (lower left), and EZH2 and ESR1 (lower right). The red dashed line represents a linear regression. The statistical test used is the Pearson’s test. (B) Endometrial cancer tumor sample protein expression from 371 samples for ARID1A and PGR (left) and ARID1A and ESR1 (right). The red dashed line represents a linear regression. The statistical test used is the Pearson’s test. n.s. is non-significant.
Figure 9
Figure 9
Model diagram representation of PGR (progesterone receptor) regulation by SWI/SNF (SWItch/Sucrose Non-Fermentable), PRC2 (polycomb repressive complex 2) and estrogen at sites with H3K27me3 (histone H3 lysine 27 trimethylation) and H3K4me3 (histone H3 lysine 4 trimethylation).

Similar articles

Cited by

References

    1. Siegel R.L., Miller K.D., Fuchs H.E., Jemal A. Cancer Statistics, 2021. CA Cancer J. Clin. 2021;71:7–33. doi: 10.3322/caac.21654. - DOI - PubMed
    1. Kaaks R., Lukanova A., Kurzer M.S. Obesity, endogenous hormones, and endometrial cancer risk: A synthetic review. Cancer Epidemiol. Biomarkers Prev. 2002;11:1531–1543. - PubMed
    1. Bianchini F., Kaaks R., Vainio H. Overweight, obesity, and cancer risk. Lancet Oncol. 2002;3:565–574. doi: 10.1016/S1470-2045(02)00849-5. - DOI - PubMed
    1. Mihm M., Gangooly S., Muttukrishna S. The normal menstrual cycle in women. Anim. Reprod. Sci. 2011;124:229–236. doi: 10.1016/j.anireprosci.2010.08.030. - DOI - PubMed
    1. Morice P., Leary A., Creutzberg C., Abu-Rustum N., Darai E. Endometrial cancer. Lancet. 2016;387:1094–1108. doi: 10.1016/S0140-6736(15)00130-0. - DOI - PubMed

Publication types