. 2022 Mar 8;14(6):1363.
doi: 10.3390/cancers14061363.

Thymoquinone Radiosensitizes Human Colorectal Cancer Cells in 2D and 3D Culture Models

Affiliations

Thymoquinone Radiosensitizes Human Colorectal Cancer Cells in 2D and 3D Culture Models

Samar Al Bitar et al. Cancers (Basel). .

Erratum in

Abstract

Resistance of cancer cells and normal tissue toxicity of ionizing radiation (IR) are known to limit the success of radiotherapy. There is growing interest in using IR with natural compounds to sensitize cancer cells and spare healthy tissues. Thymoquinone (TQ) was shown to radiosensitize several cancers, yet no studies have investigated its radiosensitizing effects on colorectal cancer (CRC). Here, we combined TQ with IR and determined its effects in two-dimensional (2D) and three-dimensional (3D) culture models derived from HCT116 and HT29 CRC cells, and in patient-derived organoids (PDOs). TQ sensitized CRC cells to IR and reduced cell viability and clonogenic survival and was non-toxic to non-tumorigenic intestinal cells. TQ sensitizing effects were associated with G2/M arrest and DNA damage as well as changes in key signaling molecules involved in this process. Combining a low dose of TQ (3 µM) with IR (2 Gy) inhibited sphere formation by 100% at generation 5 and this was associated with inhibition of stemness and DNA repair. These doses also led to ~1.4- to ~3.4-fold decrease in organoid forming ability of PDOs. Our findings show that combining TQ and IR could be a promising therapeutic strategy for eradicating CRC cells.

Keywords: DNA repair; cancer stem cells; colon spheres; colorectal cancer; patient-derived organoids; radiosensitization.


Conflict of interest statement

The authors declare no conflict of interest.

Figures

Figure 1
Figure 1
TQ sensitizes colorectal cancer cells to radiation and reduces their cell viability and colony forming ability. (a,b) HCT116 and HT29 cells were either left untreated or were incubated with TQ alone, IR alone (2 Gy) or combinations for 48 or 72 h. At the specific time point, cell viability was determined using trypan blue exclusion assay. (cf) Clonogenic survival assay was used to determine effect of TQ and IR on the long-term survival of HCT116 (c) and HT29 (d) cells. Cells were treated with TQ, IR, or combinations, after which they were collected and seeded in treatment-free media at low density. After 7–10 days, the resulting colonies were fixed, stained with crystal violet and counted. Representative images of HCT116 (e) and HT29 (f) colonies are shown. Results are expressed as percentage of the studied group as compared to its control. Data represent an average of three in-dependent experiments. The data are reported as mean ± SEM (* p < 0.05; ** p < 0.01; *** p < 0.001).
Figure 2
Figure 2
TQ radiosensitization of colorectal cancer cells is associated with DNA repair inhibition. HCT116 and HT29 cells were either left untreated or incubated with TQ for 24 h followed by irradiation at 2 Gy. Cells were then fixed at 0 min, 10 min and 24 h post irradiation, followed by permeabilization and staining for p-ATR, p-ATM (a,b), and Gamma H2AX (γH2AX) (c,d). Quantification and representative images are shown. Quantification of p-ATM and p-ATR intensity was performed using Carl Zeiss Zen 2012 image software. γH2AX foci were counted using the confocal microscope. Data represent an average of three independent experiments and are reported as mean ± SEM (* p < 0.05; ** p < 0.01 significantly different from control for p-ATM and p-ATR, and from IR for γH2AX). Scale bar for immunofluorescent images is 20 µm.
Figure 3
Figure 3
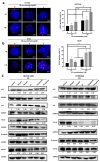
TQ sensitizes colorectal cancer cells to radiation through targeting major pathways implicated in radiation therapy. Western blot analysis of p53, p21, NF-κB (p65), β catenin, and CD133 48 h post treatment with TQ, IR, or TQ+IR in HCT116 (a) and HT29 cells (b). Fold expression changes normalized to GAPDH. Data represent an average of at least three independent experiments.
Figure 4
Figure 4
TQ radiosensitizes colorectal cancer stem/progenitor cells and reduces their sphere-forming and self-renewal ability. Sphere forming unit (SFU) obtained from serially passaged colonospheres over five generations is shown for HCT116 (a) and HT29 (b) spheres treated with TQ (1, 3 and 5 µM), radiation (2 Gy), or combinations. SFU is calculated according to the following formula: SFU = (number of spheres counted ÷ number of input cells) × 100. HCT116 and HT29 cells were suspended in Growth Factor reduced Matrigel/serum-free media (ratio 50:50) and allowed to grow in media with 5%FBS (with or without treatment) to enrich for colorectal CSCs. Generated spheres are referred to as G1 (Generation 1) spheres. After each propagation, cells that were initially treated with TQ, IR, TQ+IR, or media (control) were seeded into separate wells. Spheres were propagated for five generations in duplicates for each condition. Data represent an average of three independent experiments and are reported as mean ± SEM (* p < 0.05; ** p < 0.01; *** p < 0.001). Representative bright-field images showing the effect of TQ, IR, and combinations on SFU of HCT116 and HT29 spheres are shown next to the respective graphs. Images were visualized by Axiovert inverted microscope at 10× magnification and analyzed by Carl Zeiss Zen 2012 image software. Scale bar 100 µm.
Figure 5
Figure 5
TQ radiosensitization of CRC stem/progenitor cells leads to inhibition of DNA repair and stemness. Representative images of TQ, IR, and combinations treated HCT116 (a) and HT29 (b) G1 spheres after γH2AX staining. γH2AX positive cells were counted and normalized to size. Data represent an average of three independent experiments and are reported as mean ± SEM (* p < 0.05; ** p < 0.01; *** p < 0.001). Scale bar 50 µm. (c) Analysis of p53, p21, NF-κB (p65), β catenin, and CD133 protein expression in HCT116 and HT29 G1 spheres following treatment with TQ, IR, and combinations. Fold expression changes normalized to GAPDH.
Figure 6
Figure 6
TQ radiosensitizes patient 1-derived rectal cancer organoids and reduces their organoid-forming ability and size. (a) Representative images of H&E stain of unaffected rectum and rectal cancer tissue from patient 1. (b) Representative bright-field images of organoids derived from unaffected rectum and rectal cancer samples (patient 1). (c) Immunofluorescent images of rectal tumor issues and organoids stained for CD44 and CK19. Images were obtained using confocal microscopy. (d) Representative bright-field images of organoids derived from rectal cancer patient 1 sample and treated with TQ (3 and 5 µM), radiation (2 Gy), or combinations. Fresh unaffected and tumor tissues were digested, and single cells were resuspended in 90% Growth Factor reduced Matrigel and 10% serum-free colon media and allowed to grow in serum-free colon media (without treatment). Generated organoids are referred to as G1 organoids. Organoids were propagated to G2 and treated with TQ, IR, or combinations. OFC and size were calculated, and average values were reported as mean ± SEM (* p < 0.05, ** p < 0.01, *** p < 0.001). Images were visualized by Axiovert inverted microscope at 10× magnification. Scale bar for bright-field images is 100 µm and for immunofluorescent images is 50 µm.
Figure 7
Figure 7
TQ and radiation reduce organoid-forming ability and size of patient 2-derived colon cancer organoids. (a) Representative images of H&E stain of unaffected and tumor colon tissue from patient 2. (b) Representative bright-field images of organoids derived from unaffected and tumor colon patient samples (patient 2). (c) Immunofluorescent images of tumor colon issues and organoids stained for CD44 and CK19. Images were obtained using confocal microscopy. (d) Representative bright-field images of organoids derived from tumor colon patient 2 sample and treated with TQ (3 and 5 µM), radiation (2 Gy), or combinations. Fresh unaffected and tumor tissues were digested, and single cells were resuspended in 90% Growth Factor reduced Matrigel and 10% serum-free colon media and allowed to grow in serum-free colon media (without treatment). Generated organoids are referred to as G1 organoids. Organoids were propagated to G4 and treated with TQ, IR, or combination. OFC and size were calculated, and average values were reported as mean ± SEM (* p < 0.05, ** p < 0.01. Images were visualized by Axiovert inverted microscope at 10× magnification. Scale bar for bright-field images is 100 µm and for immunofluorescent images is 50 µm.
Figure 8
Figure 8
TQ and radiation reduce organoid-forming ability and size of patient 3-derived colon cancer organoids. (a) Representative images of H&E stain of unaffected and tumor colon tissue from patient 3. (b) Representative bright-field images of organoids derived from unaffected and tumor colon patient samples (patient 3). (c) Immunofluorescent images of tumor colon tissues and organoids stained for CD44 and CK19. Images were obtained using confocal microscopy. (d) Representative bright-field images of organoids derived from tumor colon patient 3 sample and treated with TQ (3 and 5 µM), radiation (2 Gy), or combinations. Fresh unaffected and tumor tissues were digested, and single cells were resuspended in 90% Growth Factor reduced Matrigel and 10% serum-free colon media and allowed to grow in serum-free colon media (without treatment). Generated organoids are referred to as G1 organoids. Organoids were propagated to G2 and treated with TQ, IR, or combination. OFC and size were calculated, and average values were reported as mean ± SEM (* p < 0.05, ** p < 0.01, *** p < 0.001). Images were visualized by Axiovert inverted microscope at 10× magnification. Scale bar for bright-field images is 100 µm and for immunofluorescent images is 50 µm.

Similar articles

Cited by

References

    1. Feeney G., Sehgal R., Sheehan M., Hogan A., Regan M., Joyce M., Kerin M. Neoadjuvant radiotherapy for rectal cancer management. World J. Gastroenterol. 2019;25:4850–4869. doi: 10.3748/wjg.v25.i33.4850. - DOI - PMC - PubMed
    1. Phi L.T.H., Sari I.N., Yang Y.G., Lee S.H., Jun N., Kim K.S., Lee Y.K., Kwon H.Y. Cancer Stem Cells (CSCs) in Drug Resistance and their Therapeutic Implications in Cancer Treatment. Stem Cells Int. 2018;2018:5416923. doi: 10.1155/2018/5416923. - DOI - PMC - PubMed
    1. Zhou Y., Xia L., Wang H., Oyang L., Su M., Liu Q., Lin J., Tan S., Tian Y., Liao Q., et al. Cancer stem cells in progression of colorectal cancer. Oncotarget. 2018;9:33403–33415. doi: 10.18632/oncotarget.23607. - DOI - PMC - PubMed
    1. Ricci-Vitiani L., Fabrizi E., Palio E., De Maria R. Colon cancer stem cells. J. Mol. Med. 2009;87:1097–1104. doi: 10.1007/s00109-009-0518-4. - DOI - PubMed
    1. Baskar R., Dai J., Wenlong N., Yeo R., Yeoh K.W. Biological response of cancer cells to radiation treatment. Front. Mol. Biosci. 2014;1:24. doi: 10.3389/fmolb.2014.00024. - DOI - PMC - PubMed

LinkOut - more resources