. 2022 Mar 8;14(6):1382.
doi: 10.3390/cancers14061382.

Occurrence of Total and Proteinase K-Resistant Alpha-Synuclein in Glioblastoma Cells Depends on mTOR Activity

Affiliations

Occurrence of Total and Proteinase K-Resistant Alpha-Synuclein in Glioblastoma Cells Depends on mTOR Activity

Larisa Ryskalin et al. Cancers (Basel). .

Abstract

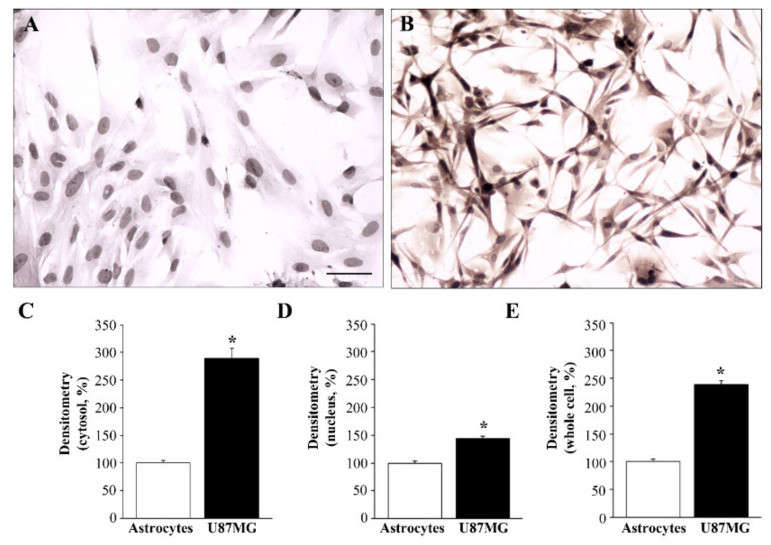
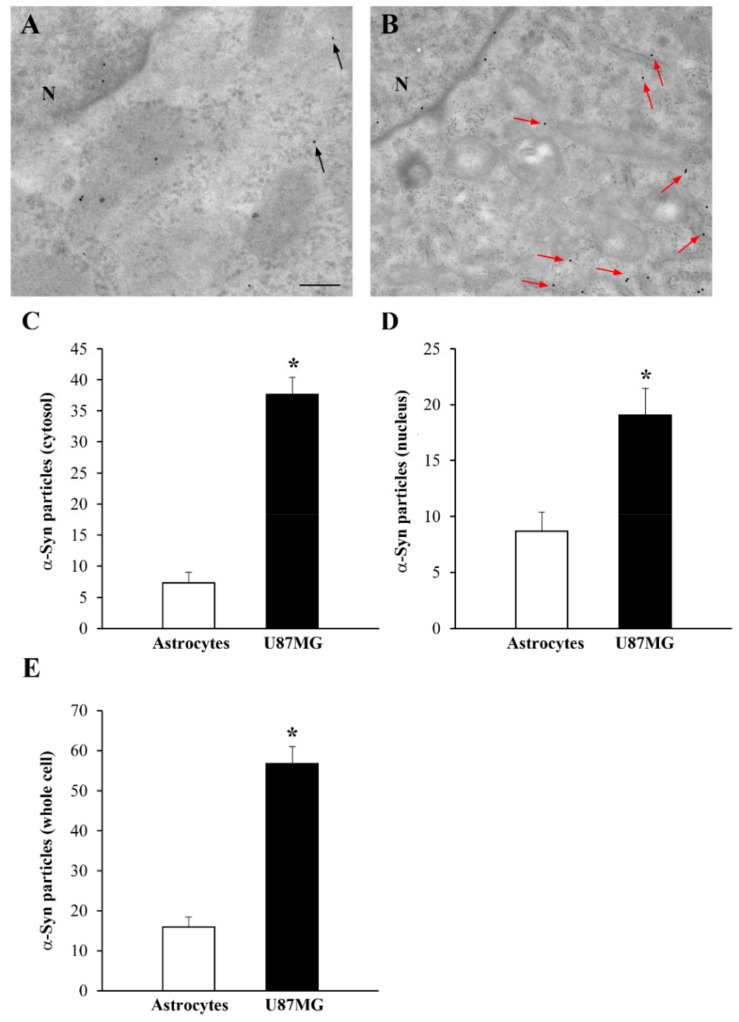
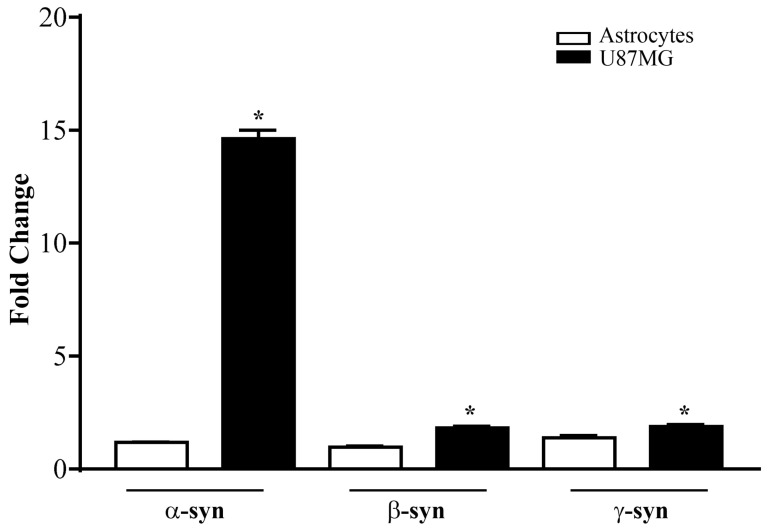
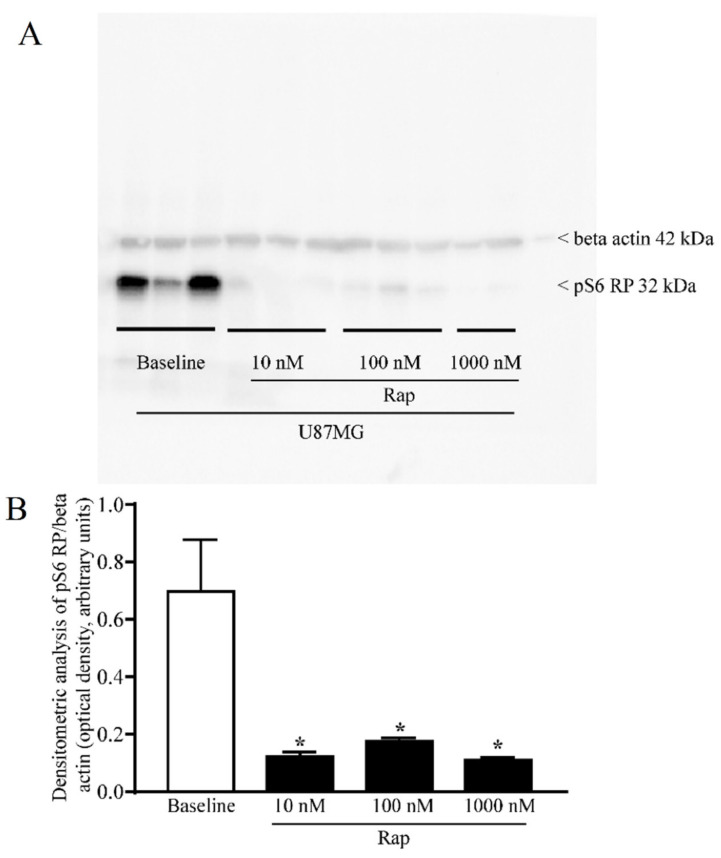
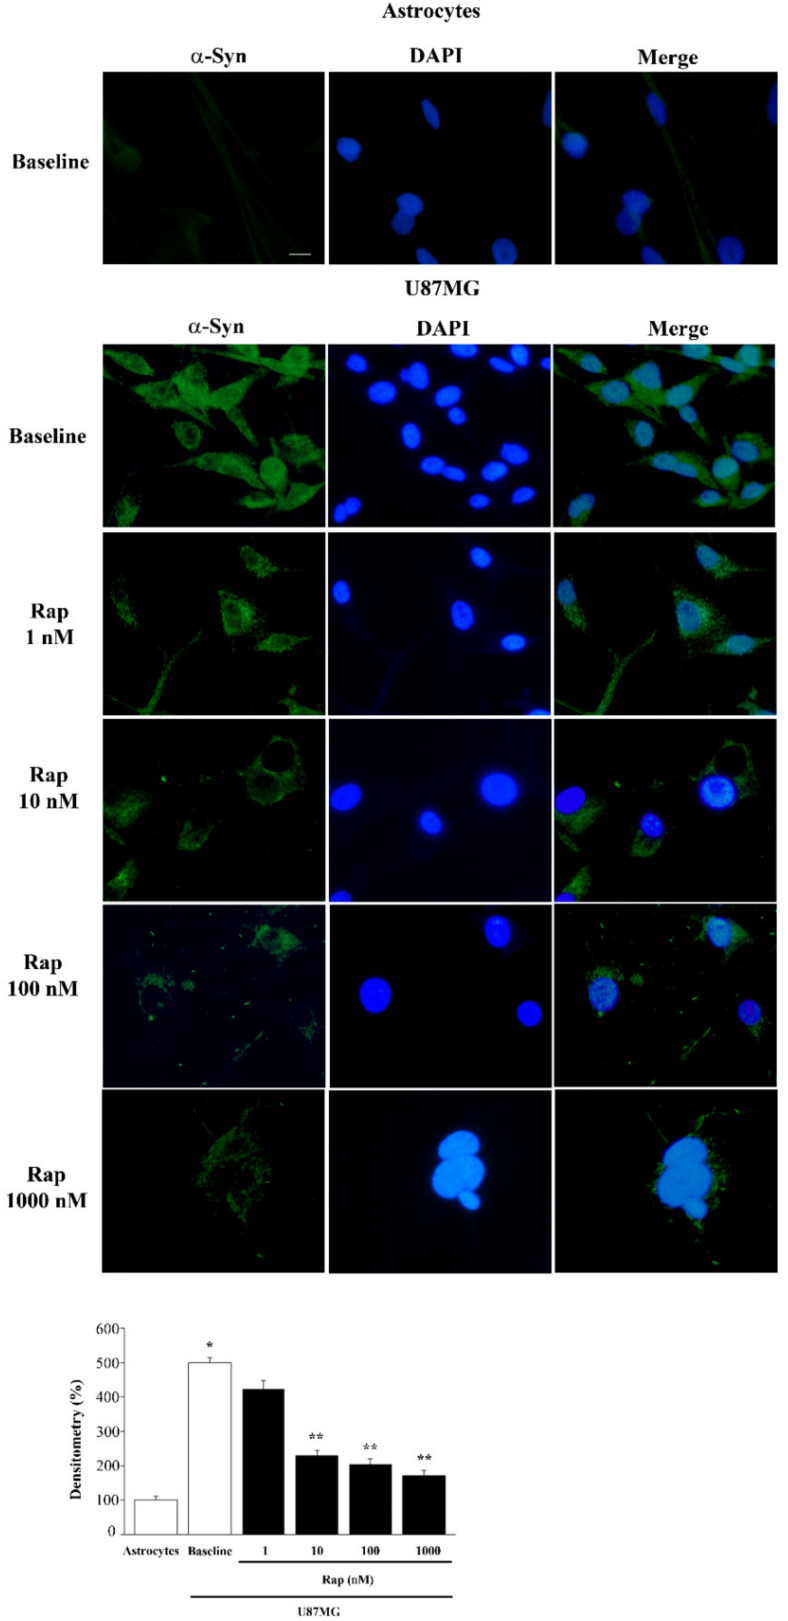
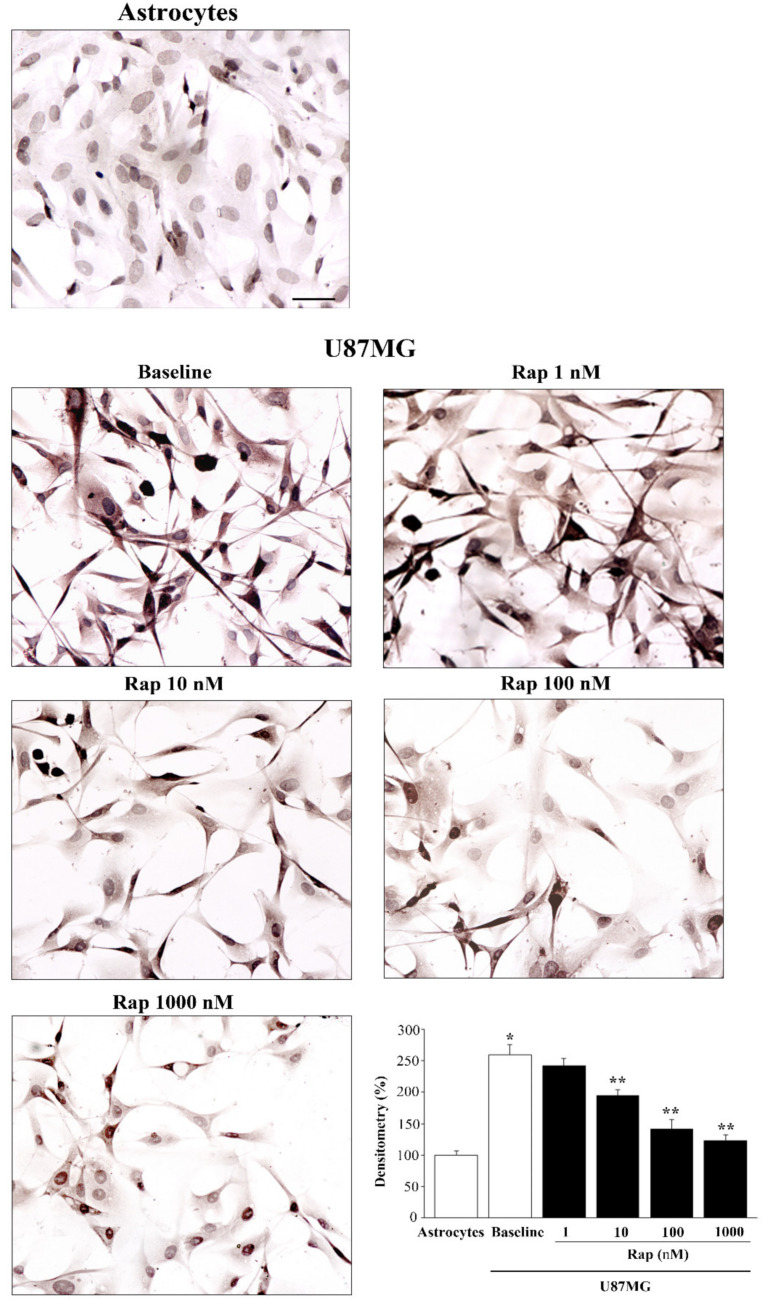
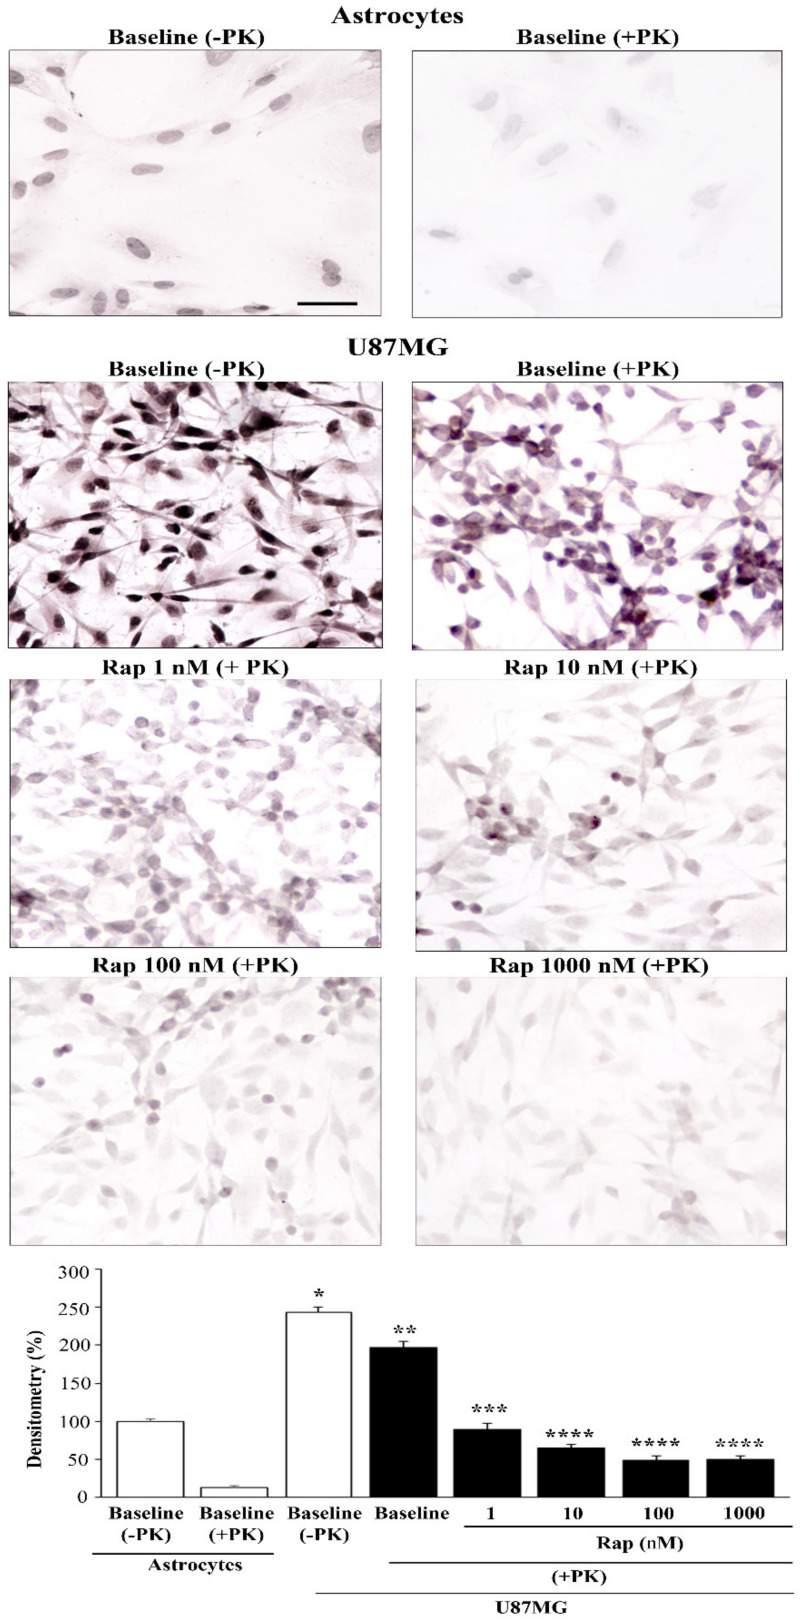
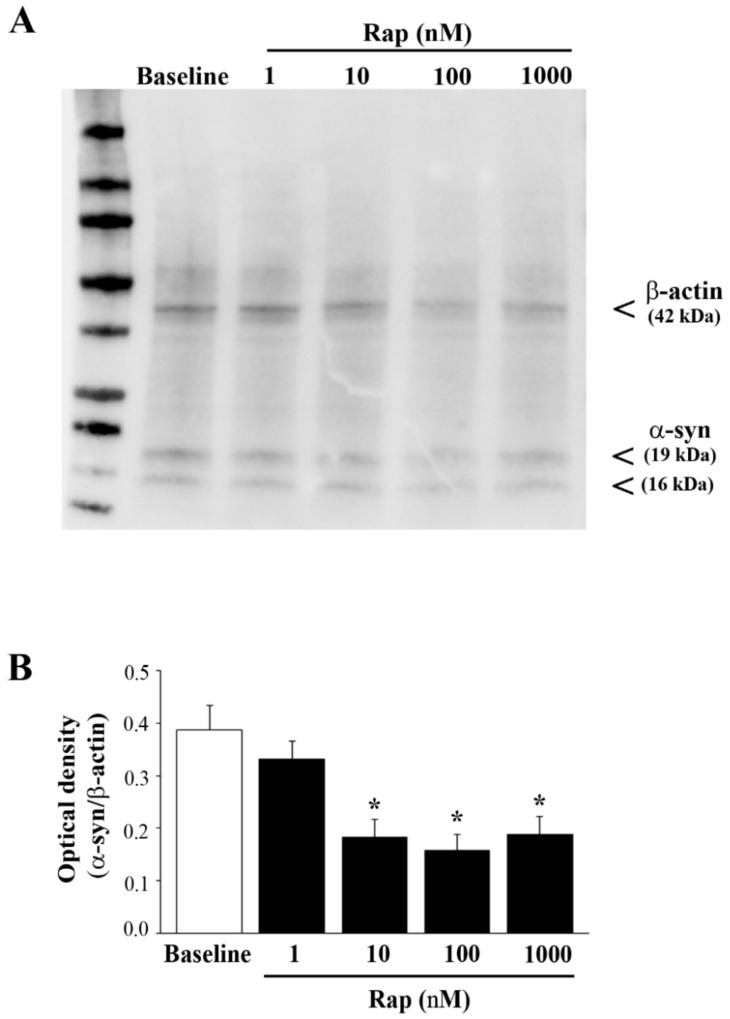
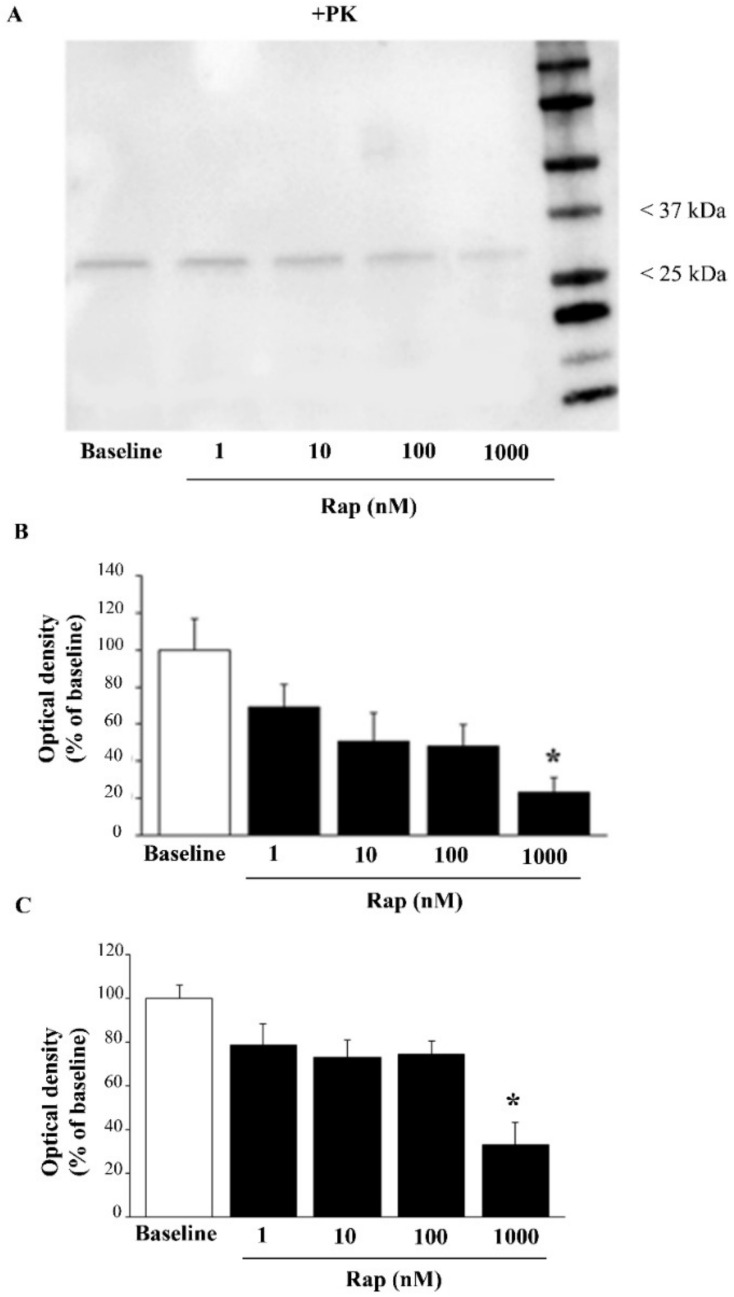
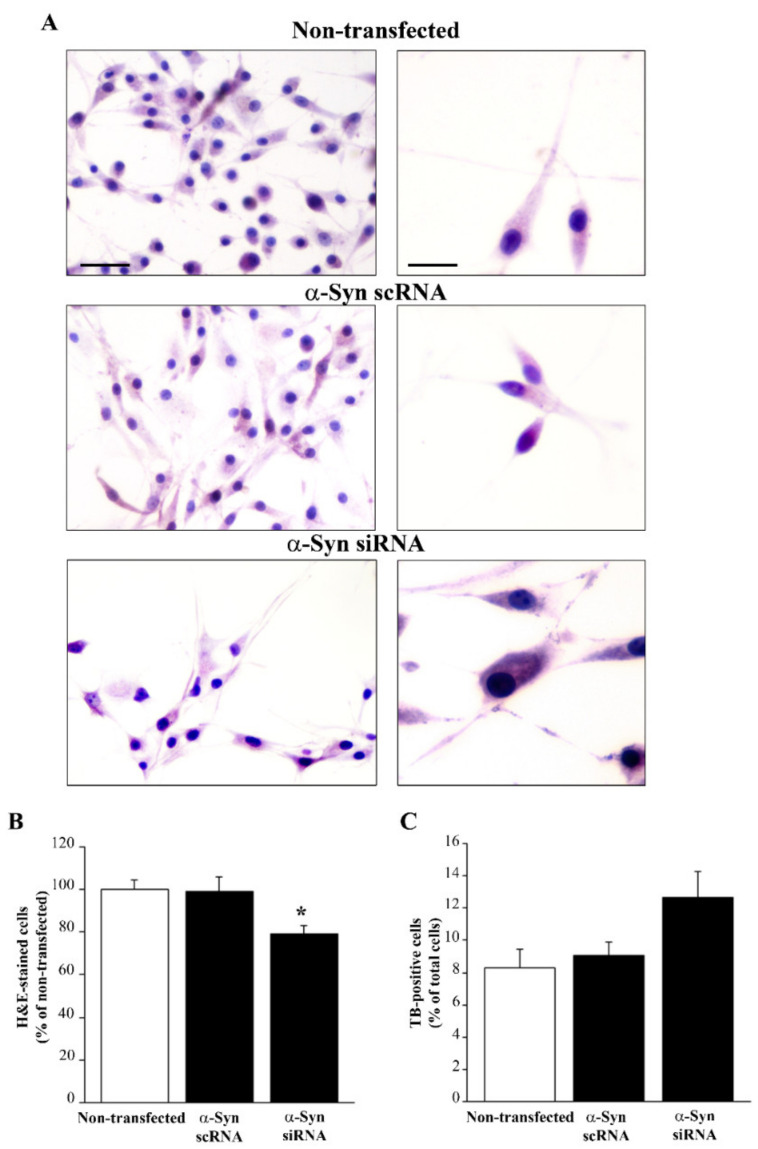
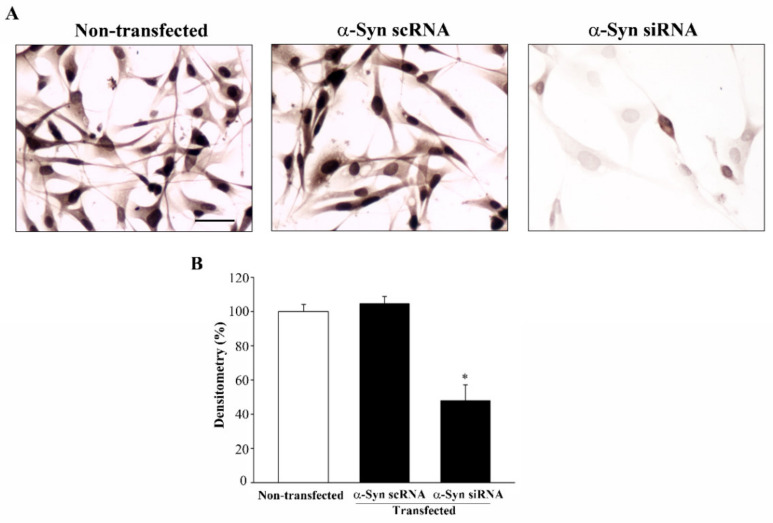
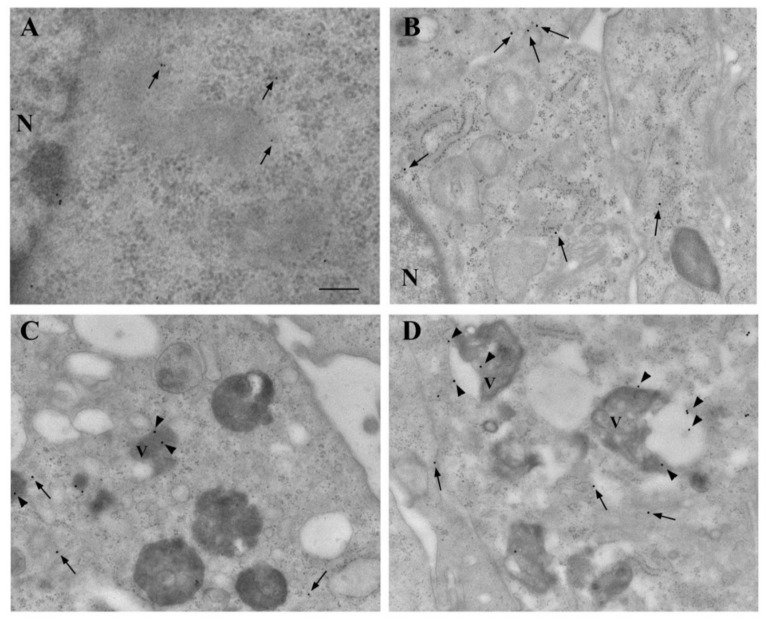
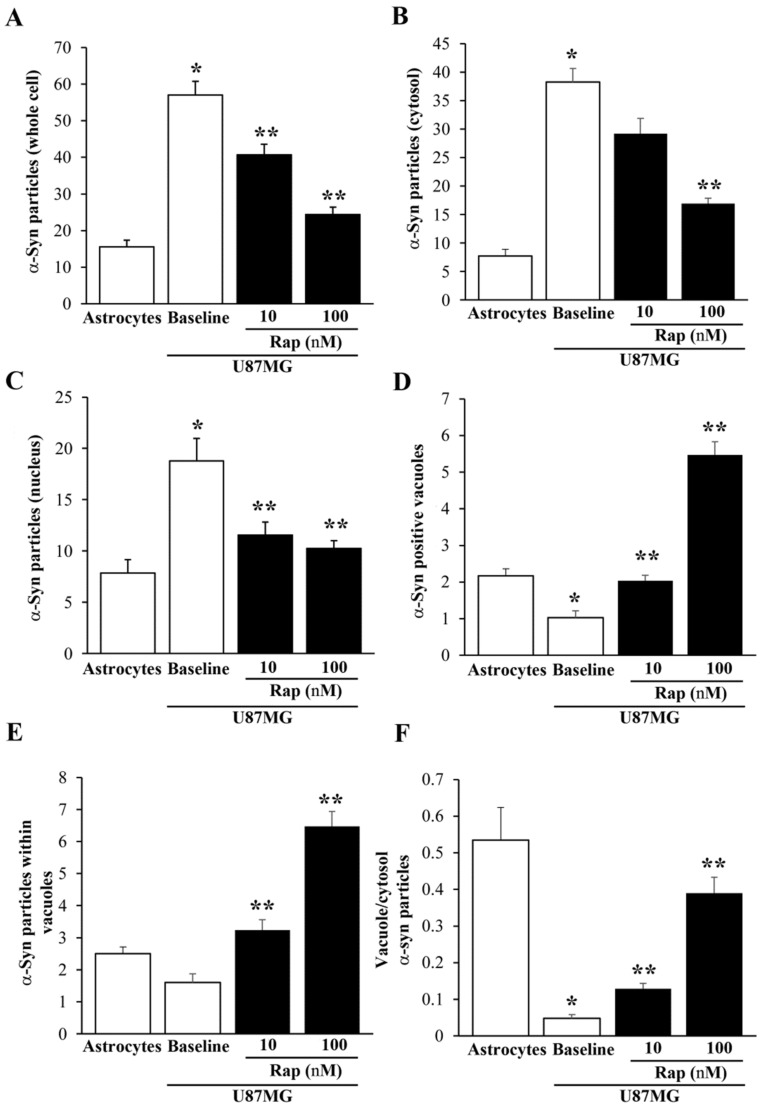
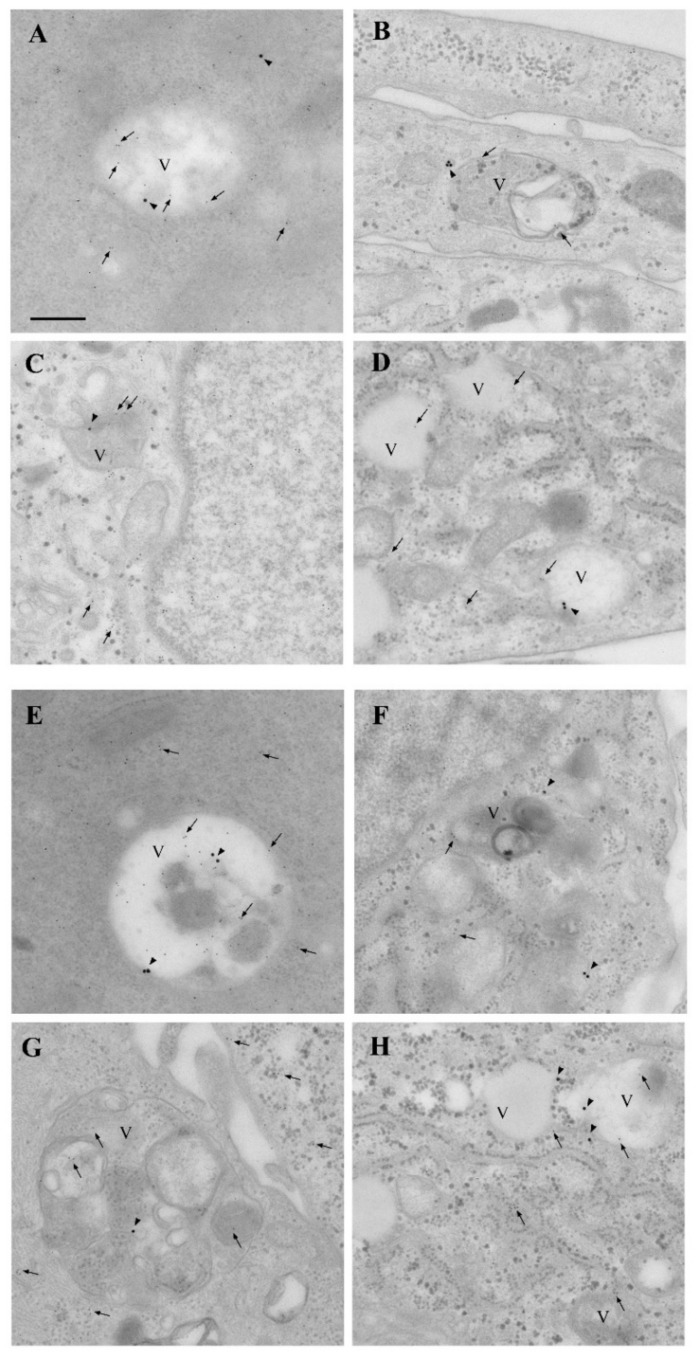
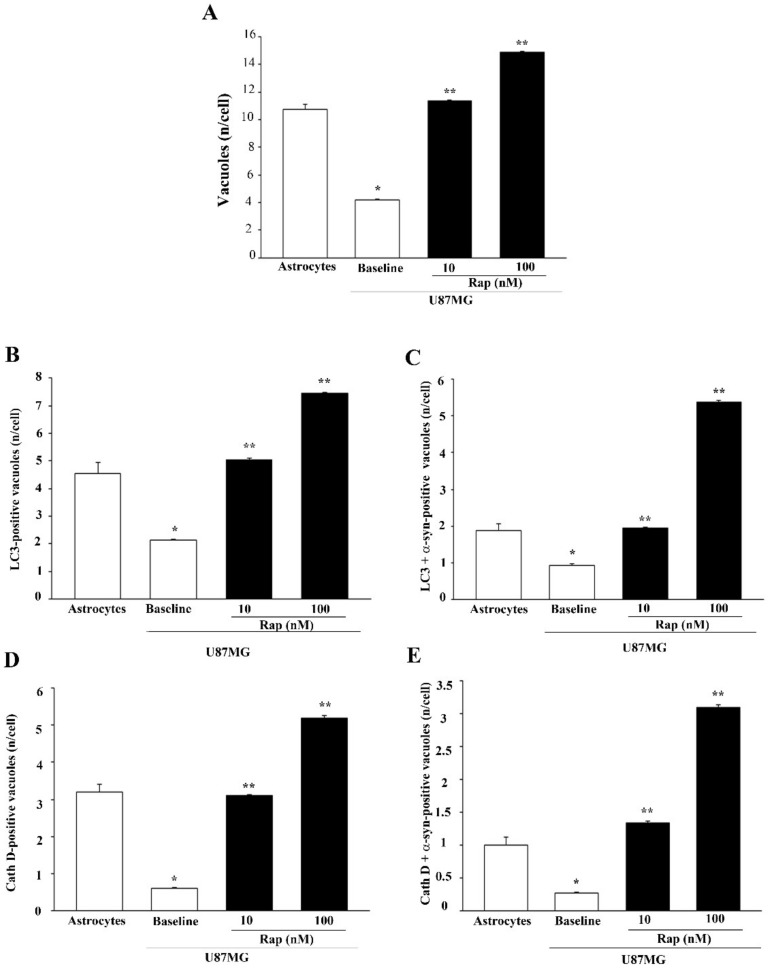
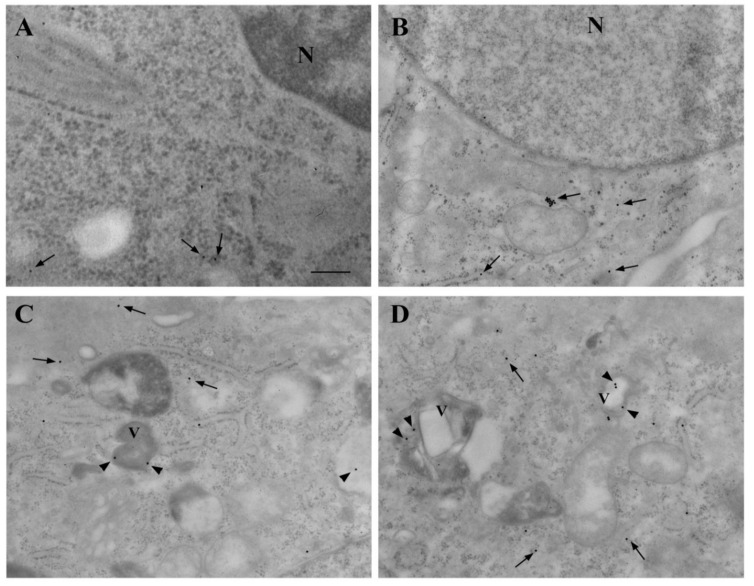
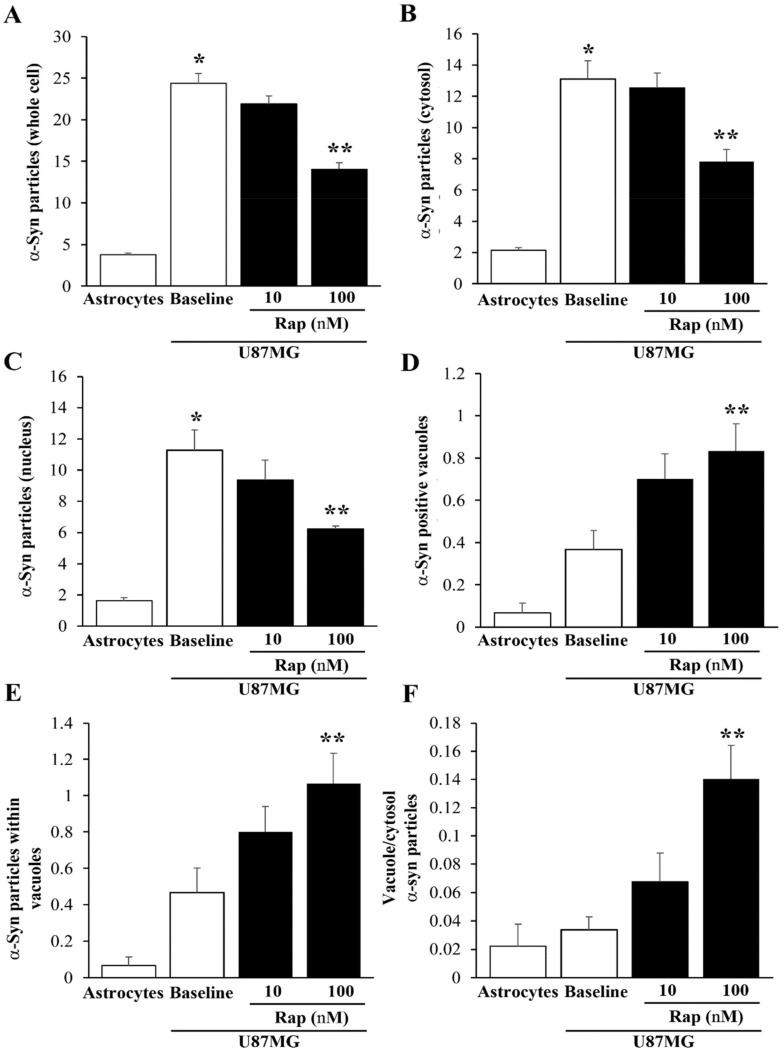
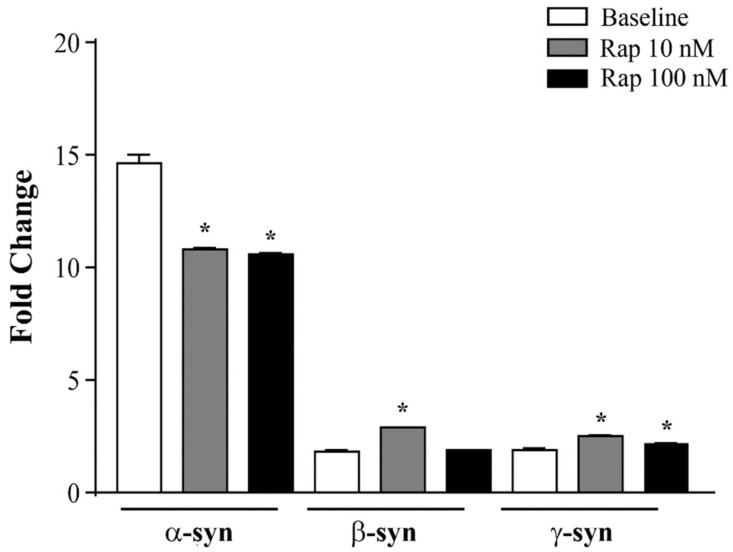
Alpha-synuclein (α-syn) is a protein considered to be detrimental in a number of degenerative disorders (synucleinopathies) of which α-syn aggregates are considered a pathological hallmark. The clearance of α-syn strongly depends on autophagy, which can be stimulated by inhibiting the mechanistic target of rapamycin (mTOR). Thus, the overexpression of mTOR and severe autophagy suppression may produce α-syn accumulation, including the proteinase K-resistant protein isoform. Glioblastoma multiforme (GBM) is a lethal brain tumor that features mTOR overexpression and severe autophagy inhibition. Cell pathology in GBM is reminiscent of a fast, progressive degenerative disorder. Therefore, the present work questions whether, as is analogous to neurons during degenerative disorders, an overexpression of α-syn occurs within GBM cells. A high amount of α-syn was documented in GBM cells via real-time PCR (RT-PCR), Western blotting, immunohistochemistry, immuno-fluorescence, and ultrastructural stoichiometry, compared with the amount of β- and γ-synucleins and compared with the amount of α-syn counted within astrocytes. The present study indicates that (i) α-syn is overexpressed in GBM cells, (ii) α-syn expression includes a proteinase-K resistant isoform, (iii) α-syn is dispersed from autophagy-like vacuoles to the cytosol, (iv) α-syn overexpression and cytosol dispersion are mitigated by rapamycin, and (v) the α-syn-related GBM-like phenotype is mitigated by silencing the SNCA gene.

Keywords: autophagy vacuoles; cell-clearing systems; glioblastoma multiforme; mechanistic target of rapamycin; qRT-PCR; siRNA; synucleins; transmission electron microscopy.


Conflict of interest statement

The authors declare no conflict of interest.

Figures

Figure 1
Figure 1
Differential expression of α-syn immuno-cytochemistry between astrocytes and U87MG cells. Representative pictures of α-syn immuno-cytochemistry within astrocytes (A) compared with U87MG cells (B). Immuno-peroxidase shows that, in baseline conditions, U87MG cells exhibit marked α-syn immunoreactivity in the cytosol, whereas α-syn immunostaining is barely detectable within the cytosol of astrocytes. Graphs report the densitometry of α-syn staining within the cytosol (C), nucleus (D), and whole cell (E) for α-syn staining within astrocytes, compared with GBM cells. Data are given as the mean percentage ± SEM of optical density in each experimental group (assuming the astrocytes to be control = 100% density) obtained from n = 30 cells (astrocytes or U87MG cells), in N = 3 independent experiments. * p < 0.05 compared with astrocytes. Scale bar = 32.5 μm.
Figure 2
Figure 2
Occurrence and distribution of α-syn within U87MG cells and astrocytes. Representative electron micrographs of α-syn in astrocytes (A) and U87MG cells (B). In baseline conditions, a few scattered α-syn immuno-gold particles (black arrows) were found within the cytosol of astrocytes. In contrast, in U87MG cells, α-syn immuno-gold particles were abundant (red arrows). The representative distribution suggests that α-syn occurred within vacuoles in the cytosol of astrocytes, while it was uniformly dispersed in the cytosol of U87MG cells. Graphs report the number of α-syn immuno-gold particles within the cytosol (C), nucleus (D), and whole cell (E) within astrocytes, compared with U87MG cells. N = nucleus. Data are given as the mean ± SEM from n = 30 cells (astrocytes or U87MG cells) obtained in N = 3 independent experiments. * p < 0.05 compared with astrocytes. Scale bar = 0.11 μm.
Figure 3
Figure 3
mRNA levels for α-syn, β-syn, and γ-syn in astrocytes and U87MG cells. α-Syn, β-syn, and γ-syn gene transcripts were assessed by quantitative RT-PCR analysis in astrocytes and U87MG cells in baseline conditions. Data are given as the mean ± SEM of n = 4 samples from N = 2 independent experiments, normalized with two different internal references, globin, and actin. * p < 0.05, compared with astrocytes.
Figure 4
Figure 4
Rapamycin dose-dependently reduced the pS6 ribosomal protein assessed by immunoblotting. (A) Representative immunoblotting for the ribosomal protein pS6 (pS6 RP) and the housekeeping protein β-actin in U87MG cells, in baseline conditions and following rapamycin exposure. (B) The ratio between the optical densities of pS6RP and β-actin. Data are given as the mean ± SEM of the optical density referring to n = 6 (baseline, 10 nM, 100 nM) and n = 4 (1000 nM) samples from different cultures obtained in N = 2 experiments. * p < 0.05 compared with baseline.
Figure 5
Figure 5
Rapamycin dose-dependently reduced α-syn immuno-fluorescence. Representative pictures of α-syn-positive astrocytes and U87MG cells, in baseline conditions and following rapamycin (Rap) exposure. Each cell nucleus is visualized using DAPI (blue). In these cells, the amount of α-syn is stained by a green fluorescent-labeled secondary antibody (Alexa 488, green). The graph reports the densitometry of α-syn immuno-fluorescence within astrocytes compared with U87MG cells, in baseline conditions and following rapamycin exposure. Data are given as the mean percentage ± SEM of optical density for each experimental group (assuming controls as 100%) obtained from n = 30 cells per group in a total of N = 3 independent experiments. * p < 0.05 compared with astrocytes; ** p < 0.05 compared with baseline and Rap 1 nM in U87MG. Scale bar = 12 μm.
Figure 6
Figure 6
Rapamycin dose-dependently reduced α-syn-immunostaining. Representative pictures of α-syn immuno-positive astrocytes and U87MG cells in baseline conditions and following rapamycin (Rap) administration. The graph reports densitometry for α-syn immunostaining within astrocytes compared with U87MG cells, in baseline conditions and following rapamycin administration. Data are given as the mean percentage ± SEM of optical density from n = 30 cells obtained in N = 3 independent experiments (assuming the controls to be 100%). * p < 0.05 compared with astrocytes; ** p < 0.05 compared with baseline and Rap 1 nM. Scale bar = 22.5 μm.
Figure 7
Figure 7
Rapamycin dose-dependently suppressed PK-resistant α-syn-immunostaining. Representative pictures of total (−PK) and PK-resistant (+PK) α-syn immunostaining within astrocytes and U87MG cells, in baseline conditions (baseline) and following increasing doses of rapamycin (Rap). The graph reports densitometry for α-syn immunostaining within astrocytes compared with U87MG cells, in baseline conditions and following various doses of rapamycin. Data are given as the mean percentage ± SEM of optical density from n = 30 cells per group obtained in N = 3 independent experiments (assuming controls as 100%). * p < 0.05 compared with astrocytes (baseline −PK); ** p < 0.05 compared with baseline (−PK); *** p < 0.05 compared with baseline (+PK); **** p < 0.05 compared with baseline (+PK) and Rap 1 nM. Scale bar = 25.5 μm.
Figure 8
Figure 8
Rapamycin reduced α-syn assessed by immunoblotting. (A) Representative immunoblotting for α-syn and the housekeeping β-actin in baseline conditions (baseline) and in rapamycin-treated U87MG cells. (B) The ratio between the optical densities of α-syn and β-actin is reported in the graph. Data are given as the mean ± SEM of the optical density of n = 5 values for each experimental group, measured in N = 5 independent experiments. The original figure of Figure 8A can be found in Supplementary Figure S4. * p < 0.05 compared with baseline.
Figure 9
Figure 9
Rapamycin reduced the amount of PK-resistant α-syn. (A) Representative PK-resistant immunoblotting of α-syn in baseline conditions (baseline) and in rapamycin-treated U87MG cells (data were validated in N = 3 different gels). Graphs report densitometry as a percentage of baseline (assuming the baseline to be 100%) (B) or as a ratio between PK-resistant α-syn and β-actin (as in the gel without PK treatment), assuming the baseline to be 100% (C). Data are given as the mean percentage ± SEM of optical density of n = 3 blots for each experimental group, measured in N = 3 independent experiments. The original figure of Figure 8A can be found in Supplementary Figure S5. * p < 0.05 compared with baseline.
Figure 10
Figure 10
Silencing α-syn did not alter cell viability while producing phenotypic changes. (A) Representative pictures are shown of H&E-stained U87MG cells from non-transfected, α-syn scRNA-transfected, and α-syn siRNA-transfected cells. Graphs report the percentage of H&E-stained cells (considering non-transfected cells to be 100%) (B) and the percentage of TB-positive cells among total cells (C). Values are given as the mean percentage ± SEM of n = 6 counts obtained in N = 3 independent experiments. * p < 0.05, compared with non-transfected cells. Scale bars = 70 μm (low magnification); 30 μm (high magnification).
Figure 11
Figure 11
Silencing α-syn significantly reduced the nestin immunostaining. (A) Representative pictures are shown of nestin immuno-peroxidase from non-transfected, α-syn scRNA-transfected, and α-syn siRNA-transfected cells. (B) Graph reports the densitometry measured in the whole cells. Data are given as the mean percentage ± SEM of n = 30 counts obtained in N = 3 independent experiments. * p < 0.05 compared with non-transfected cells. Scale bar = 35 μm.
Figure 12
Figure 12
Rapamycin-induced α-syn vacuolar compartmentalization in U87MG cells. Representative micrographs showing astrocytes (A) and U87MG cells (B), in baseline conditions and following rapamycin exposure at 10 nM (C) and 100 nM (D). In astrocytes, α-syn was rarely found within the cytosol, nucleus, and vacuoles, whereas, in U87MG cells, α-syn immuno-gold was abundantly present in the cytosol and nucleus, with negligible vacuolar compartmentalization. Rapamycin reduced α-syn in the cell and increased its placement within the vacuoles. Arrows = α-syn immuno-gold particles in the cytosol; arrowheads = α-syn immuno-gold particles within the vacuoles. N = nucleus; V = vacuole. Scale bar = 0.28 μm.
Figure 13
Figure 13
Counts of α-syn immuno-gold within the astrocytes and U87MG cells. Graphs report the number of α-syn immuno-gold particles within the whole cell (A), cytosol (B), and nucleus (C). The number of α-syn positive vacuoles is reported in (D), while the mean number of α-syn immuno-gold particles within each vacuole is reported in (E). The ratio of α-syn immuno-gold particles within vacuoles vs. the cytosol is reported in (F). These data were obtained from the astrocytes and U87MG cells, in baseline conditions and following rapamycin exposure (Rap 10 nM and Rap 100 nM). Data are given as the mean ± SEM from n = 30 cells per experimental group, obtained in N = 3 independent experiments. * p < 0.05 compared with astrocytes; ** p < 0.05 compared with baseline.
Figure 14
Figure 14
Rapamycin-induced α-syn + LC3- and α-syn + cathepsin D-positive vacuoles in GBM cells. Representative micrographs showing astrocytes (A,E) and U87MG cells (B,F), in baseline conditions and following rapamycin exposure at 10 nM (C,G) and 100 nM (D,H). Immuno-gold for α-syn (20 nm) and LC3 (10 nm) is shown in (AD), while immuno-gold for α-syn (20 nm) and cathepsin D (10 nm) is shown in (EH). Arrowheads = α-syn immuno-gold particles; arrows = LC3 or cathepsin D immuno-gold particles. V = vacuole. Scale bar = 0.15 μm.
Figure 15
Figure 15
Quantification of α-syn + LC3- or α-syn + cathepsin D-positive vacuoles within astrocytes and U87MG cells in baseline conditions and after rapamycin. Graphs report the total number of vacuoles per cell (A), the number of LC3-positive vacuoles per cell (B), the number of LC3 + α-syn-positive vacuoles per cell (C), the number of cathepsin D-positive vacuoles per cell (D), and the number of cathepsin D + α-syn-positive vacuoles per cell (E). These data were obtained from astrocytes and U87MG cells in baseline conditions and following rapamycin exposure (Rap 10 nM and Rap 100 nM). Data are given as the mean ± SEM from n = 30 cells per experimental group obtained in N = 3 independent experiments. * p < 0.05 compared with astrocytes; ** p < 0.05 compared with baseline.
Figure 16
Figure 16
Rapamycin-induced vacuolar compartmentalization of PK-resistant α-syn in U87MG cells. Representative micrographs show the presence of PK-resistant isoform of α-syn within astrocytes (A) and U87MG (BD) cells, in baseline conditions (A,B) and following rapamycin exposure (Rap 10 nM and Rap 100 nM, (C,D), respectively). Arrows = α-syn immuno-gold particles in the cytosol; arrowheads = α-syn immuno-gold particles within vacuoles. N = nucleus; V = vacuole. Scale bar = 0.28 μm.
Figure 17
Figure 17
Count of PK-resistant α-syn immuno-gold within astrocytes and U87MG cells. Graphs report the number of α-syn immuno-gold particles within the whole cell (A), cytosol (B), and nucleus (C). The number of α-syn-positive vacuoles is reported in (D), while the mean number of α-syn immuno-gold particles within each vacuole is reported in (E). The ratio of α-syn immuno-gold particles within vacuoles vs. the cytosol is reported in (F). These data were obtained from astrocytes and U87MG after PK treatment in baseline conditions and following rapamycin exposure (Rap 10 nM and Rap 100 nM). Data are given as the mean ± SEM from n = 30 cells per experimental group, obtained from N = 3 independent experiments. * p < 0.05 compared with astrocytes; ** p < 0.05 compared with baseline.
Figure 18
Figure 18
Effects of rapamycin on the mRNA levels of α-syn, β-syn, and γ-syn in U87MG cells. α-Syn, β-syn, and γ-syn gene transcripts were assessed by quantitative RT-PCR analysis in U87MG cells in baseline conditions (baseline), and following rapamycin exposure (Rap 10 nM and Rap 100 nM). Data are given as the mean ± SEM from n = 4 samples from N = 2 independent experiments, normalized with two different internal references, globin, and actin. * p < 0.05 compared with baseline.

Similar articles

Cited by

References

    1. Polymeropoulos M.H., Lavedan C., Leroy E., Ide S.E., Dehejia A., Dutra A., Pike B., Root H., Rubenstein J., Boyer R., et al. Mutation in the alpha-synuclein gene identified in families with Parkinson’s disease. Science. 1997;276:2045–2047. doi: 10.1126/science.276.5321.2045. - DOI - PubMed
    1. Singleton A.B., Farrer M., Johnson J., Singleton A., Hague S., Kachergus J., Hulihan M., Peuralinna T., Dutra A., Nussbaum R., et al. Alpha-synuclein locus triplication causes Parkinson’s disease. Science. 2003;302:841. doi: 10.1126/science.1090278. - DOI - PubMed
    1. Vekrellis K., Xilouri M., Emmanouilidou E., Rideout H.J., Stefanis L. Pathological roles of α-synuclein in neurological disorders. Lancet Neurol. 2011;10:1015–1025. doi: 10.1016/S1474-4422(11)70213-7. - DOI - PubMed
    1. Stoica G., Lungu G., Bjorklund N.L., Taglialatela G., Zhang X., Chiu V., Hill H.H., Schenk J.O., Murray I. Potential role of α-synuclein in neurodegeneration: Studies in a rat animal model. J. Neurochem. 2012;122:812–822. doi: 10.1111/j.1471-4159.2012.07805.x. - DOI - PubMed
    1. Doherty K.M., Silveira-Moriyama L., Parkkinen L., Healy D.G., Farrell M., Mencacci N.E., Ahmed Z., Brett F.M., Hardy J., Quinn N., et al. Parkin disease: A clinicopathologic entity? JAMA Neurol. 2013;70:571–579. doi: 10.1001/jamaneurol.2013.172. - DOI - PMC - PubMed

LinkOut - more resources