

Molecular Signatures of Tumour and Its Microenvironment for Precise Quantitative Diagnosis of Oral Squamous Cell Carcinoma: An International Multi-Cohort Diagnostic Validation Study
- PMID: 35326543
- PMCID: PMC8945999
- DOI: 10.3390/cancers14061389
Molecular Signatures of Tumour and Its Microenvironment for Precise Quantitative Diagnosis of Oral Squamous Cell Carcinoma: An International Multi-Cohort Diagnostic Validation Study
Abstract
Background: Heterogeneity in oral potentially malignant disorder (OPMD) poses a problem for accurate prognosis that impacts on treatment strategy and patient outcome. A holistic assessment based on gene expression signatures from both the tumour cells and their microenvironment is necessary to provide a more precise prognostic assessment than just tumour cell signatures alone.
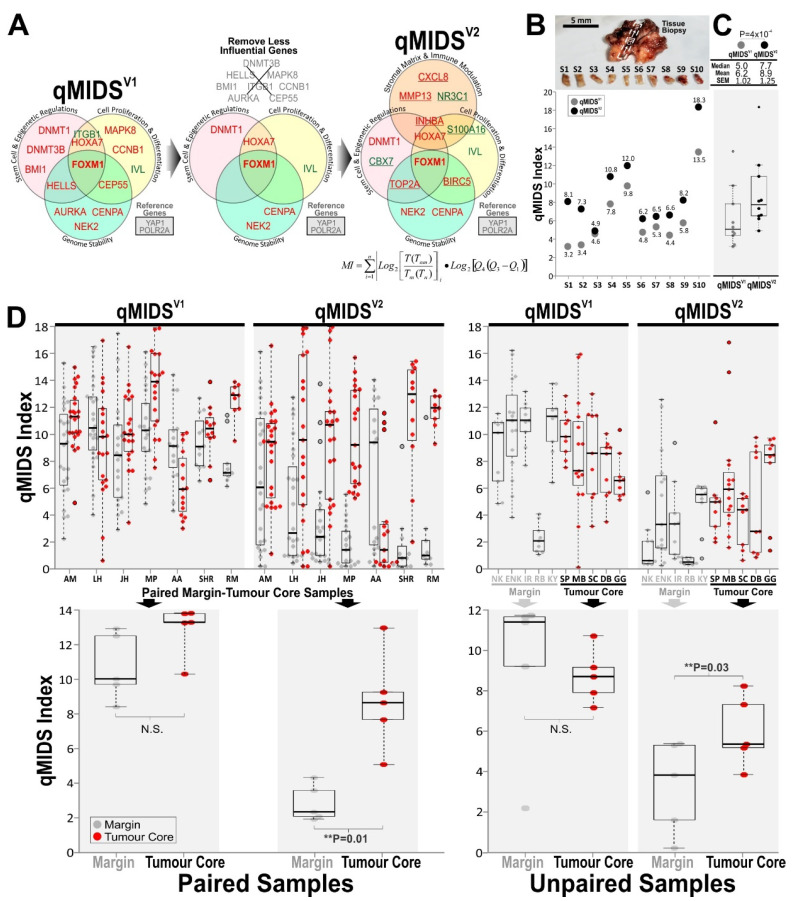
Methods: We reformulated our previously established multigene qPCR test, quantitative Malignancy Index Diagnostic System (qMIDS) with new genes involved in matrix/stroma and immune modulation of the tumour microenvironment. An algorithm calculates and converts a panel of 16 gene mRNA expression levels into a qMIDS index to quantify risk of malignancy for each sample.
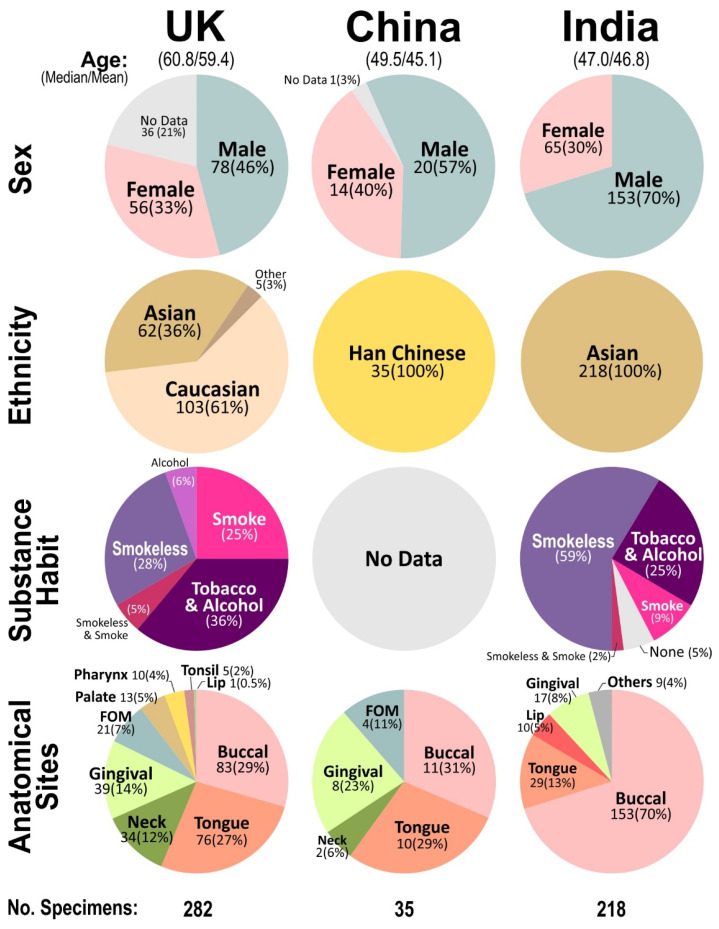
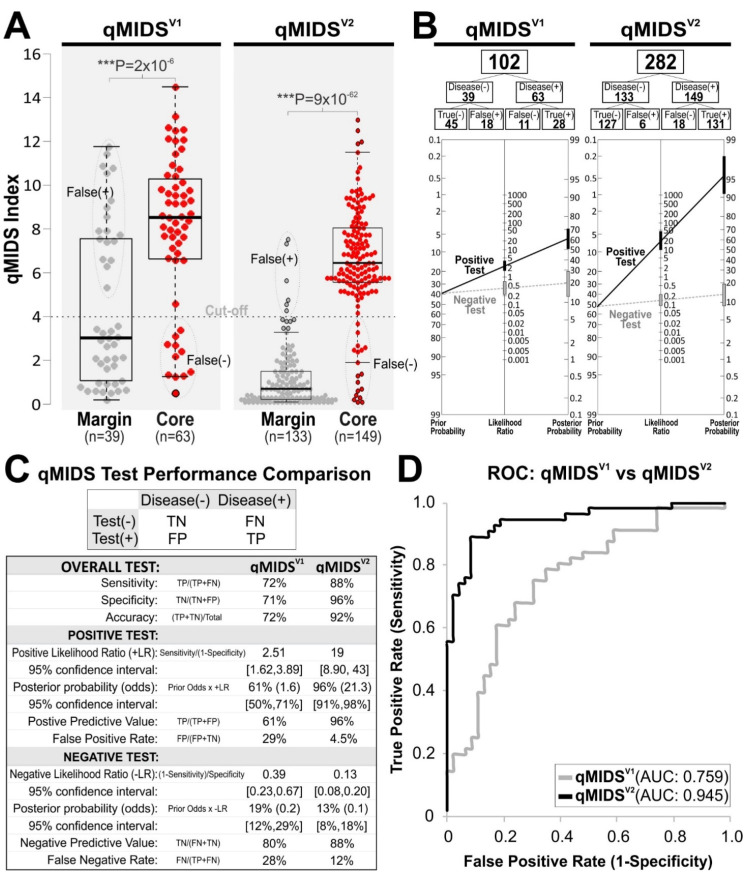
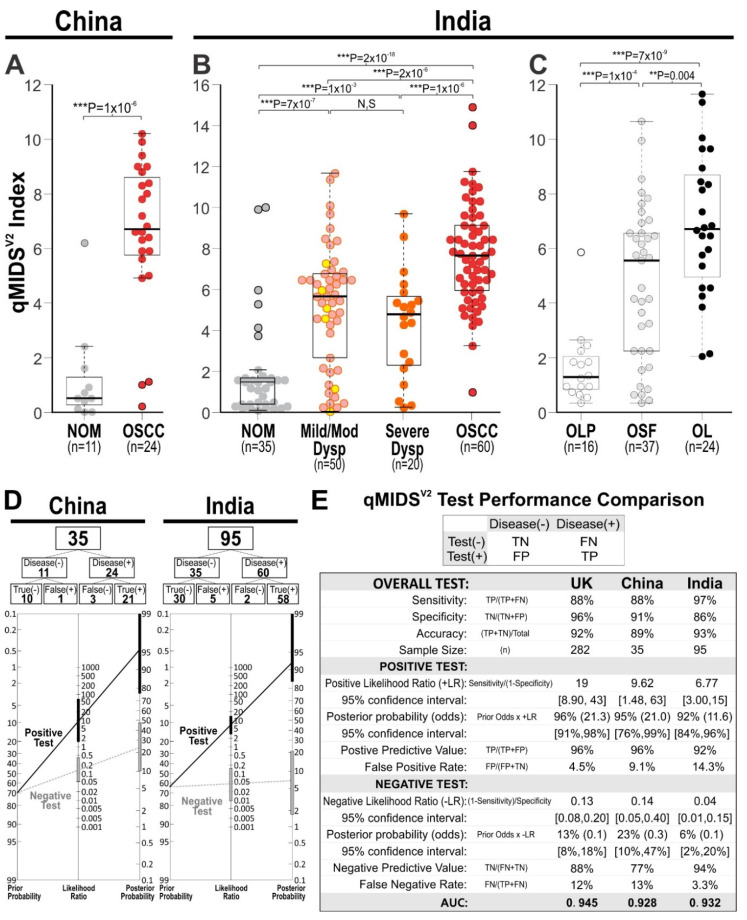
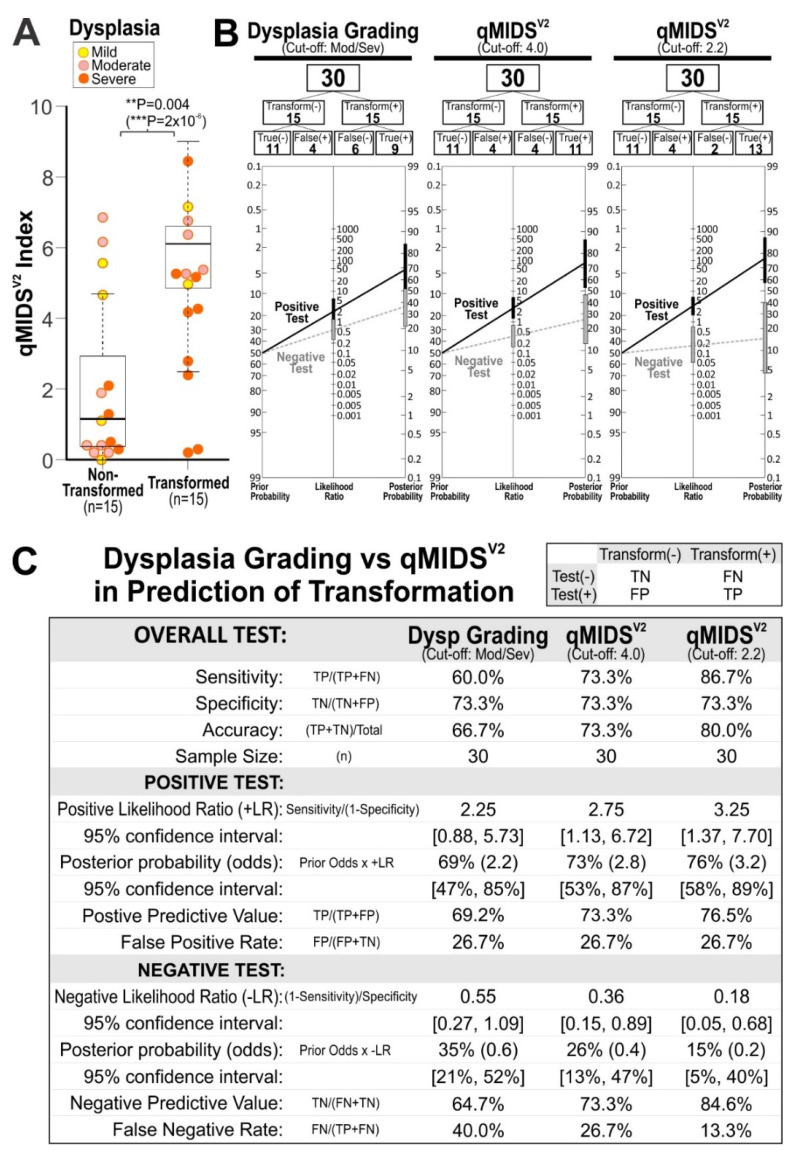
Results: The new qMIDSV2 assay was validated in a UK oral squamous cell carcinoma (OSCC) cohort (n = 282) of margin and tumour core samples demonstrating significantly better diagnostic performance (AUC = 0.945) compared to previous qMIDSV1 (AUC = 0.759). Performance of qMIDSV2 were independently validated in Chinese (n = 35; AUC = 0.928) and Indian (n = 95; AUC = 0.932) OSCC cohorts. Further, 5-year retrospective analysis on an Indian dysplastic lesion cohort (n = 30) showed that qMIDSV2 was able to significantly differentiate between lesions without transformation and those with malignant transformation.
Conclusions: This study validated a novel multi-gene qPCR test on a total of 535 tissue specimens from UK, China and India, demonstrating a rapid minimally invasive method that has a potential application for dysplasia risk stratification. Further study is required to establish if qMIDSV2 could be used to improve OPMD patient management, guide treatment strategy and reduce oral cancer burden.
Keywords: FOXM1 diagnostic biomarkers; clinical translation; dysplasia; early detection; early oral cancer biomarkers; microenvironment; molecular diagnostics; oral premalignant disorders; personalised medicine; prognostic biomarkers; qMIDS; squamous cell carcinoma.
Conflict of interest statement
The authors declare no conflict of interest. The funders had no role in the design of the study; in the collection, analyses, or interpretation of data; in the writing of the manuscript, or in the decision to publish the results.
Figures
Similar articles
-
Independent evaluation of a FOXM1-based quantitative malignancy diagnostic system (qMIDS) on head and neck squamous cell carcinomas.Oncotarget. 2016 Aug 23;7(34):54555-54563. doi: 10.18632/oncotarget.10512. Oncotarget. 2016. PMID: 27409343 Free PMC article.
-
Exploiting FOXM1-orchestrated molecular network for early squamous cell carcinoma diagnosis and prognosis.Int J Cancer. 2013 May 1;132(9):2095-106. doi: 10.1002/ijc.27886. Epub 2012 Oct 25. Int J Cancer. 2013. PMID: 23034676
-
Gene Expression Clustering and Selected Head and Neck Cancer Gene Signatures Highlight Risk Probability Differences in Oral Premalignant Lesions.Cells. 2020 Aug 3;9(8):1828. doi: 10.3390/cells9081828. Cells. 2020. PMID: 32756466 Free PMC article.
-
Molecular diagnostics in oral cancer and oral potentially malignant disorders-A clinician's guide.J Oral Pathol Med. 2020 Jan;49(1):1-8. doi: 10.1111/jop.12920. Epub 2019 Aug 3. J Oral Pathol Med. 2020. PMID: 31309636 Review.
-
State of the Art in the Diagnosis and Assessment of Oral Malignant and Potentially Malignant Disorders: Present Insights and Future Outlook-An Overview.Bioengineering (Basel). 2024 Feb 28;11(3):228. doi: 10.3390/bioengineering11030228. Bioengineering (Basel). 2024. PMID: 38534502 Free PMC article. Review.
Cited by
-
Personalized Medicine in Oral Oncology: Imaging Methods and Biological Markers to Support Diagnosis of Oral Squamous Cell Carcinoma (OSCC): A Narrative Literature Review.J Pers Med. 2023 Sep 19;13(9):1397. doi: 10.3390/jpm13091397. J Pers Med. 2023. PMID: 37763165 Free PMC article. Review.
-
Salivary Metabolomics for Oral Cancer Detection: A Narrative Review.Metabolites. 2022 May 12;12(5):436. doi: 10.3390/metabo12050436. Metabolites. 2022. PMID: 35629940 Free PMC article. Review.
-
Molecular Research on Oral Diseases and Related Biomaterials: A Journey from Oral Cell Models to Advanced Regenerative Perspectives.Int J Mol Sci. 2022 May 9;23(9):5288. doi: 10.3390/ijms23095288. Int J Mol Sci. 2022. PMID: 35563679 Free PMC article. Review.
-
Knockdown of PGC1α suppresses dysplastic oral keratinocytes proliferation through reprogramming energy metabolism.Int J Oral Sci. 2023 Sep 4;15(1):37. doi: 10.1038/s41368-023-00242-3. Int J Oral Sci. 2023. PMID: 37661238 Free PMC article.
-
Identification of multidrug chemoresistant genes in head and neck squamous cell carcinoma cells.Mol Cancer. 2023 Sep 4;22(1):146. doi: 10.1186/s12943-023-01846-3. Mol Cancer. 2023. PMID: 37667354 Free PMC article.
References
LinkOut - more resources
Full Text Sources
Miscellaneous
