. 2022 Mar 9;14(6):1393.
doi: 10.3390/cancers14061393.

Pro-Inflammatory Cytokines Trigger the Overexpression of Tumour-Related Splice Variant RAC1B in Polarized Colorectal Cells

Affiliations

Pro-Inflammatory Cytokines Trigger the Overexpression of Tumour-Related Splice Variant RAC1B in Polarized Colorectal Cells

Joana F S Pereira et al. Cancers (Basel). .

Erratum in

Abstract

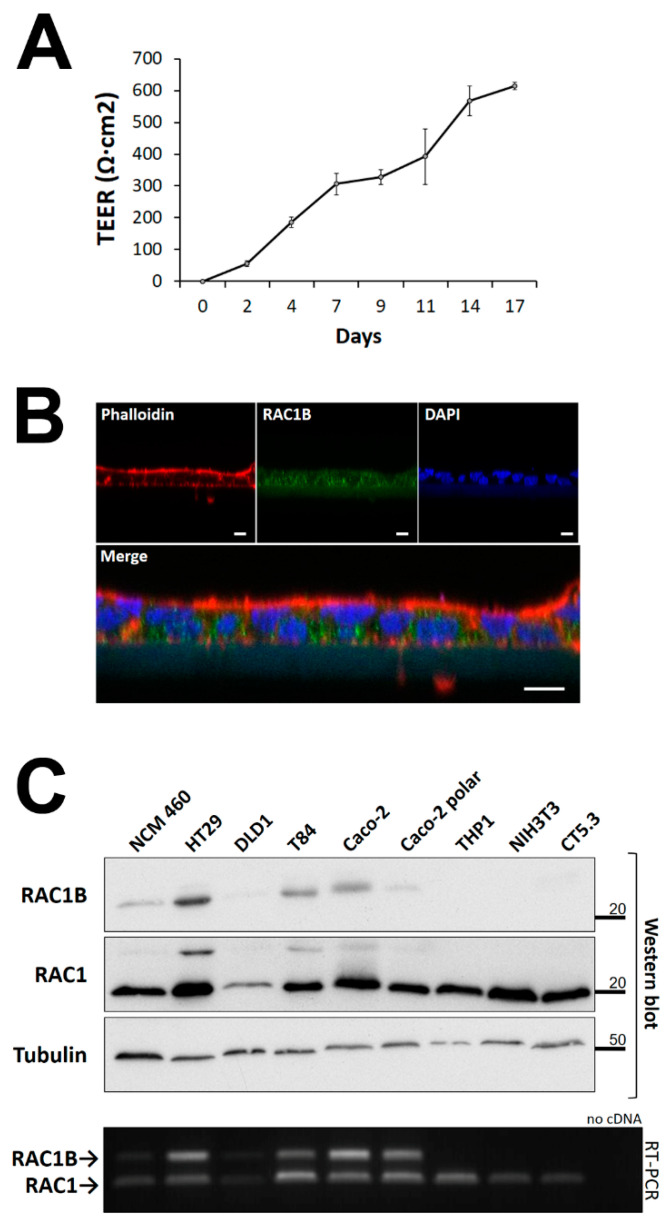
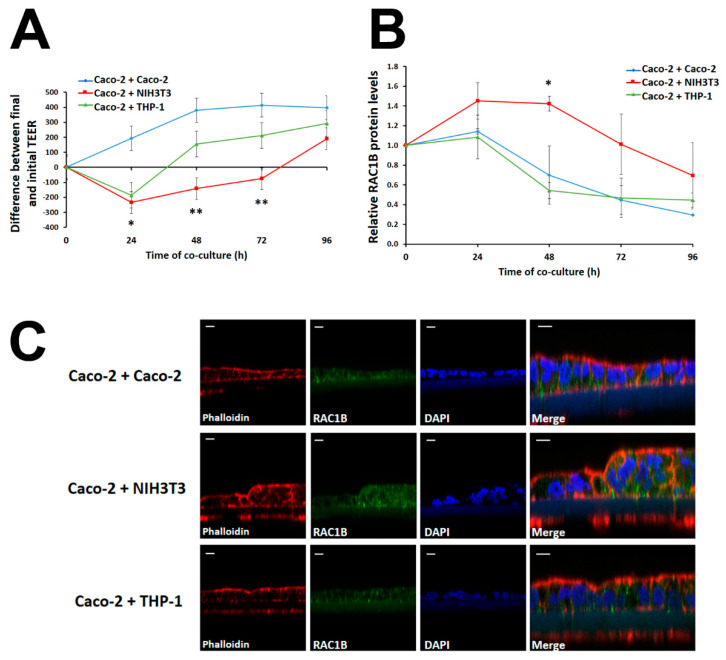
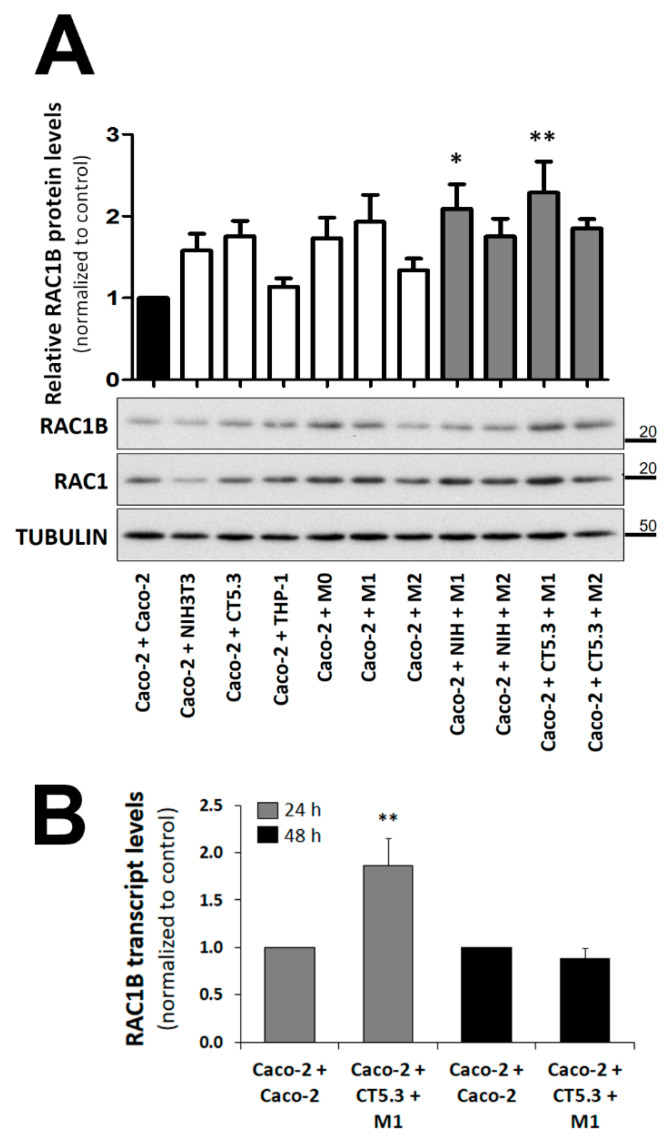
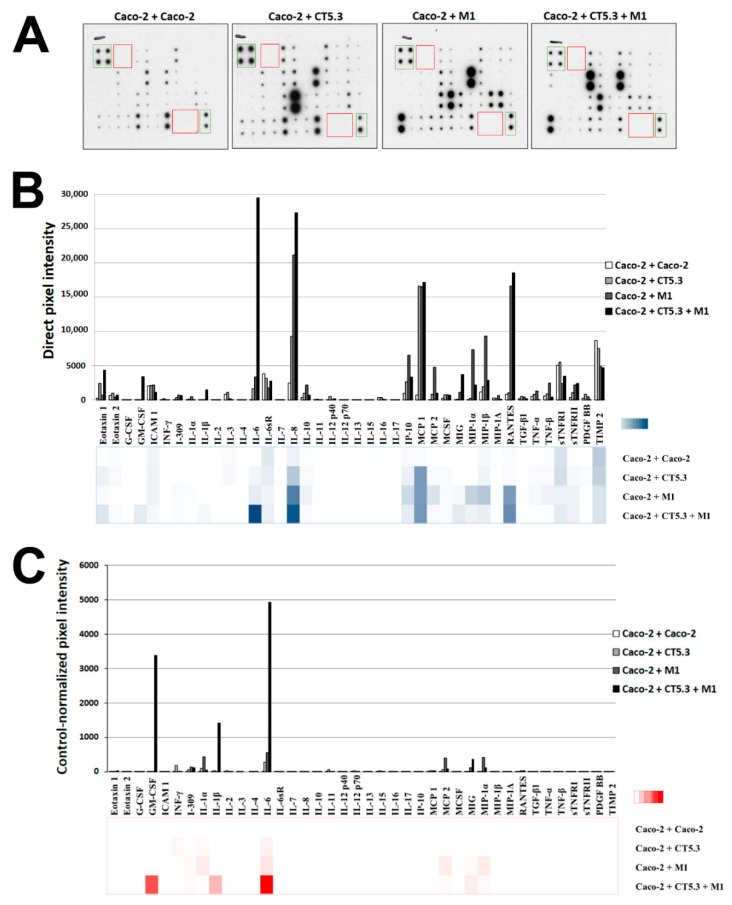
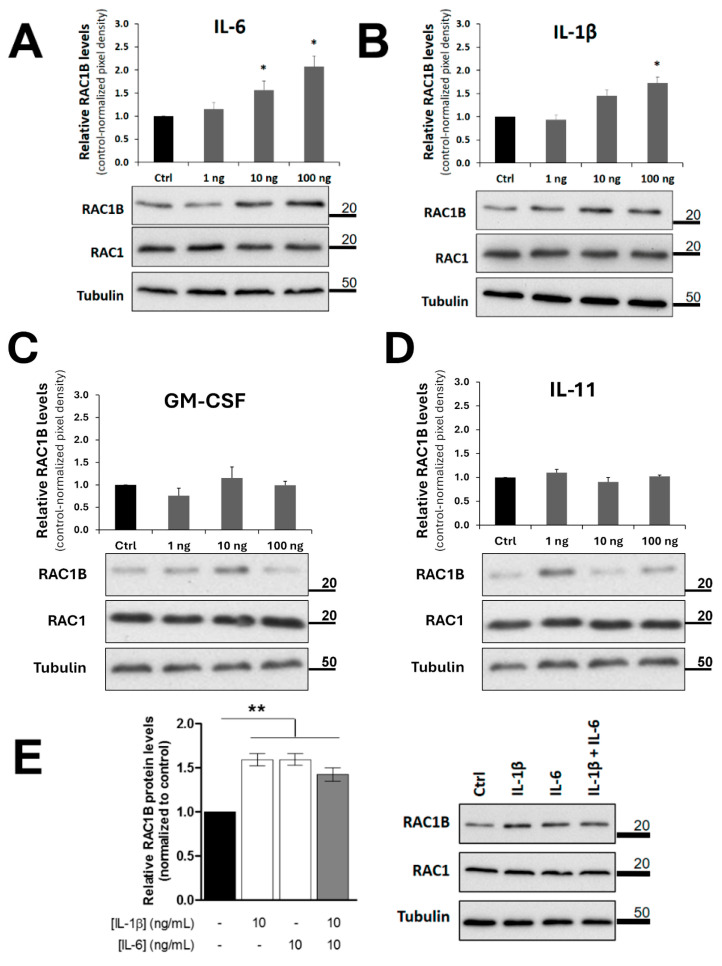
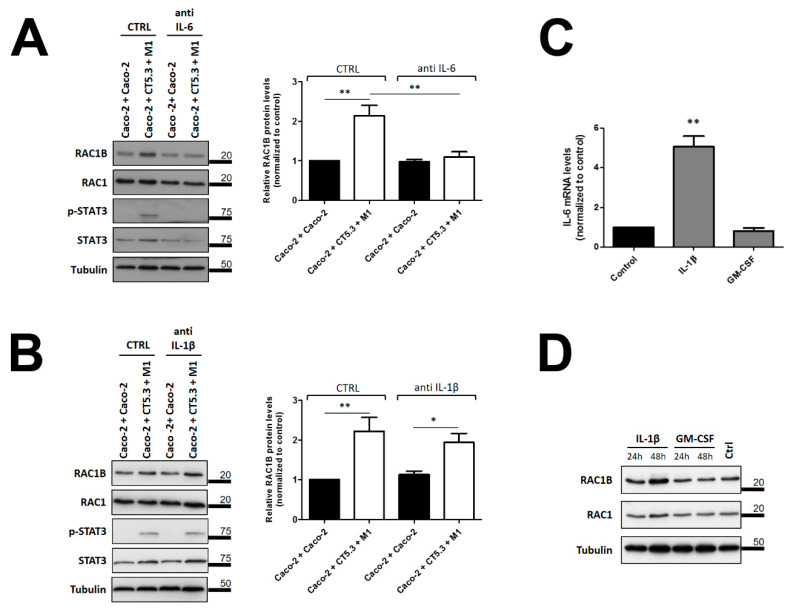
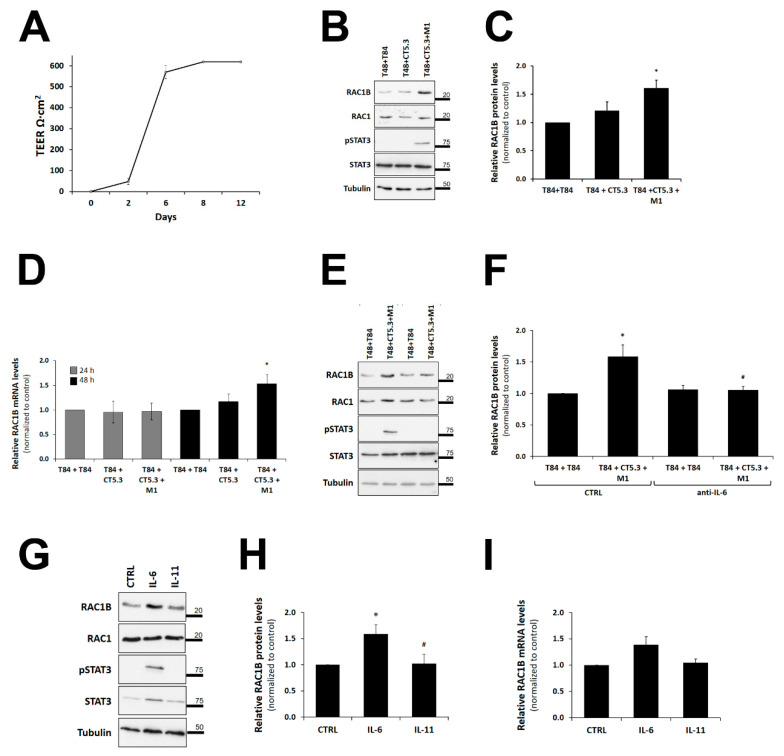
An inflammatory microenvironment is a tumour-promoting condition that provides survival signals to which cancer cells respond with gene expression changes. One example is the alternative splicing variant Rat Sarcoma Viral Oncogene Homolog (Ras)-Related C3 Botulinum Toxin Substrate 1 (RAC1)B, which we previously identified in a subset of V-Raf Murine Sarcoma Viral Oncogene Homolog B (BRAF)-mutated colorectal tumours. RAC1B was also increased in samples from inflammatory bowel disease patients or in an acute colitis mouse model. Here, we used an epithelial-like layer of polarized Caco-2 or T84 colorectal cancer (CRC) cells in co-culture with fibroblasts, monocytes or macrophages and analysed the effect on RAC1B expression in the CRC cells by RT-PCR, Western blot and confocal fluorescence microscopy. We found that the presence of cancer-associated fibroblasts and M1 macrophages induced the most significant increase in RAC1B levels in the polarized CRC cells, accompanied by a progressive loss of epithelial organization. Under these conditions, we identified interleukin (IL)-6 as the main trigger for the increase in RAC1B levels, associated with Signal Transducer and Activator of Transcription (STAT)3 activation. IL-6 neutralization by a specific antibody abrogated both RAC1B overexpression and STAT3 phosphorylation in polarized CRC cells. Our data identify that pro-inflammatory extracellular signals from stromal cells can trigger the overexpression of tumour-related RAC1B in polarized CRC cells. The results will help to understand the tumour-promoting effect of inflammation and identify novel therapeutic strategies.

Keywords: RAC1; colorectal cancer; inflammation; interleukin; macrophage; signal transduction.


Conflict of interest statement

The authors declare no conflict of interest.

Figures

Figure 1
Figure 1
Characterization of RAC1B expression in colorectal cells. (A) Caco-2 cells were seeded on filter inserts for the formation of a polarized cell layer and polarization progress was monitored by TEER measurement with a Chopstick Electrode STX2, for up to seventeen days. (B) Caco-2 cell polarization and RAC1B localization were analysed by confocal immunofluorescence microscopy at day 14 of culture. Merge is the overlay of three confocal immunofluorescence images, with cell nuclei in blue (DAPI), endogenous RAC1B protein in green, and the actin filament marker phalloidin in red; scale bar = 10 µm. (C) Expression of RAC1B and RAC1 protein (Western blot) and mRNA (RT-PCR) in whole cell lysates from colon and stromal cell lines. Proteins were separated by SDS-PAGE and the indicated proteins detected by WB with alpha-Tubulin used as a loading control. Migration position of molecular weight markers is indicated in kDa. Note that the anti-RAC1 antibody also stains RAC1B as a weak band of higher molecular weight. Below, the ethidium bromide-stained agarose gel shows the corresponding amplification of the two RAC1 gene-derived transcripts of 238 and 181 bp, respectively.
Figure 2
Figure 2
RAC1B levels and changes in polarization of Caco-2 cells under co-culture with stromal cells. Filter inserts with fully polarized Caco-2 monolayers were placed into pre-seeded 24-well plates with Caco-2 (control), NIH3T3 fibroblasts, or THP-1 monocytes. The Caco-2 cells were exposed to different co-culture lengths: 0 h, 24 h, 48 h, 72 h, and 96 h. (A) Changes in the polarization state were assessed by the differences between final and initial TEER measurement (ΔTEER) of Caco-2 after different co-culture times. (B) RAC1B protein levels in lysates from polarized Caco-2 cells were analysed by SDS-PAGE and WB techniques after different co-cultures times. Data are shown as fold-change relative to the 0 h control and represent means ± SEM, of at least 8 independent experiments. Statistical analysis was carried out with two-way ANOVA tests ((A) F = 5.39, p = 0.0458; (B) F = 4.77, p = 0.0576), followed by Bonferroni post hoc tests to assess significant differences from control conditions (Caco-2 + Caco-2) at each timepoint (* p < 0.05; ** p < 0.01). (C) Morphology of polarized Caco-2 cell layers after 48 h of co-culture with stromal cells. Cell polarization and RAC1B expression and localization were analysed by confocal immunofluorescence microscopy. Merge is the overlay of three confocal immunofluorescence images, which detected cell nuclei in blue (DAPI), the localization of endogenous RAC1B protein in green, and actin (phalloidin) in red; scale bars = 10 µm.
Figure 3
Figure 3
Effect of different co-culture conditions on the RAC1B expression levels in polarized Caco-2 cells. Polarized Caco-2 cells were co-cultured with the indicated control or stromal cells and lysed after 48 h of culture. (A) Proteins from the whole-cell lysates were analysed by SDS-PAGE and the indicated proteins detected by WB. The control of the assay corresponds to the co-culture of Caco-2 with Caco-2, and the α-tubulin protein served as a loading control. Migration position of molecular weight markers is indicated in kDa. The corresponding quantification of RAC1B levels in Caco-2 was obtained from at least three independent biological replicate experiments. Band intensities were measured and normalized to tubulin levels. Then, the RAC1B/RAC1 ratio was calculated (as both are derived from the same pre-mRNA transcript). Data are shown as the fold-change in the RAC1B/RAC1 ratio relative to control and represent means ± SEM, of at least 5 independent experiments. Statistical analysis was carried out with a one-way ANOVA test (F = 2.82; p < 0.0056), followed by a Tukey’s post hoc test. * or ** significantly different from the corresponding control (Caco-2 + Caco-2) with p < 0.05 or p < 0.01, respectively. (B) Total RNA was extracted from polarized Caco-2 cells after 24 h and 48 h of the indicated co-culture, cDNA synthetized, and RAC1 and RAC1B transcripts amplified by qRT-PCR. Data are shown as fold-change relative to control of the RAC1B/RAC1 ratio (both derive from the same pre-mRNA) and represent mean values ± standard error of the mean (SEM), of 5 independent experiments. Statistical analysis was carried out with a one-way ANOVA test (F = 79.69, p < 0.001), followed by Tukey’s post hoc test; ** significantly different from the corresponding control with p < 0.01.
Figure 4
Figure 4
Identification of cytokines from the co-culture medium. Following the co-culture of polarized Caco-2 cells with the indicated cell types, the corresponding media were incubated with antibody arrays and their cytokine composition detected by a WB-like procedure. (A) Shown are the observed signal intensities, with positive and negative control spots marked by green or red boxes, respectively. (B) Graphic display of the direct pixel intensities observed for each cytokine under the four conditions. (C) Graphic display of the pixel intensities after normalization to the background values obtained in the control co-culture with Caco-2 itself.
Figure 5
Figure 5
RAC1B protein levels in polarized Caco-2 cells after addition of purified candidate cytokines. Polarized Caco-2 cells were grown on filter inserts and then the indicated (AD) purified cytokines or (E) cytokine combinations were added to the basolateral growth medium. Cells were lysed after 48 h, proteins analysed by SDS-PAGE and the indicated proteins detected by WB. Detection of the α-tubulin protein served as a loading control. Data are shown as fold change in RAC1B protein levels relative to control (addition of antibody solvent PBS to the medium) and represent mean values ± SEM, of at least 3 independent experiments. Statistical analysis was carried out with a one-way ANOVA test (F = 39.04, p < 0.001), followed by Tukey’s post hoc tests; * or ** significantly different from the corresponding control (PBS) with p < 0.05 or p < 0.01, respectively.
Figure 6
Figure 6
Effect of neutralizing antibodies against IL-6 or IL-1β on phospho-STAT3 and RAC1B protein levels in Caco-2 cells. Polarized Caco-2 cells were co-cultured with the indicated control or with CT5.3 and M1 macrophages, in the presence of 500 ng/mL of neutralizing antibody against (A) human-IL-6 or (B) human IL-1β. Cells were lysed after 48 h of culture, proteins from the whole-cell lysates analysed by SDS-PAGE and the indicated proteins detected by WB. Detection of the tubulin protein served as a loading control and migration position of molecular weight markers is indicated in kDa. The control of the assay corresponds to the co-culture of Caco-2 with Caco-2 cells in the presence of antibody solvent (PBS). Graphics show the fold change in RAC1B protein relative to the control co-culture and represent mean values ± SEM of at least 3 independent experiments. Statistical analysis was carried out with a one-way ANOVA test ((A): F = 13.21, p < 0.001; (B): F = 9.15, p < 0.001), followed by Tukey’s post hoc tests; * or ** significantly different from the corresponding control condition (Caco-2 + Caco-2 or PBS) with p < 0.05 or p < 0.01, respectively. (C,D) Effect of purified IL-1β on (C) endogenous IL-6 mRNA expression and (D) RAC1B protein in Caco-2 cells. Polarized Caco-2 cells were incubated in the presence of 10 ng/mL of indicated purified cytokines. The control of the assay corresponds to Caco-2 cells incubated with antibody solvent (PBS). In (C), the endogenous IL-6 transcript levels in Caco-2 cells are shown after 24 h, as determined by qRT-PCR. Data are shown as fold change relative to control and represent mean values ± SEM, of at least 3 independent experiments. Statistical analysis was carried out with a one-way ANOVA test [F = 79.69, p < 0.001], followed by Tukey’s post hoc tests; ** significantly different from the corresponding control with p < 0.01. In (D), the corresponding IL-1 β effect on RAC1B and control protein levels after 24 and 48 h are shown in whole-cell lysates by WB.
Figure 7
Figure 7
Effect of pro-inflammatory co-culture conditions or of purified IL-6 on RAC1B levels in polarized T84 cells. (A) Progress of cell polarization of T84 cells grown on filter inserts was monitored by TEER measurement with a Chopstick Electrode STX2, during up to twelve days. (BD) Effect of co-culture conditions on RAC1B levels. Polarized T84 cells were co-cultured with control T84 or the indicated stromal cells and lysed after 24 h or 48 h of culture. (B) Proteins from the whole-cell lysates were analysed by SDS-PAGE and the indicated proteins detected by WB. Migration position of molecular weight markers is indicated in kDa. The control of the assay corresponds to the co-culture of T84 with T84 cells. Corresponding quantification of (C) RAC1B protein and (D) transcript levels by qRT-PCR in T84 cells obtained from at least six independent biological replicate experiments. Band intensities were measured and the RAC1B/RAC1 ratios calculated as before. Data are shown as fold-change of the RAC1B/RAC1 ratio relative to control and represent mean values ± SEM of 5 independent experiments. Statistical analysis was carried out with a one-way ANOVA test (F = 5.49, p = 0.0113 for (C) and F = 4.82, p = 0.0219 for (D)) followed by Tukey’s post hoc tests; * significantly different from the corresponding control (T84 + T84) with p < 0.01 in (C) or p < 0.05 in (D). (E,F) Effect of neutralizing antibodies against IL-6 on RAC1B and phospho-STAT3 protein levels. Polarized T84 cells were co-cultured with the indicated control or with CT5.3 and M1 macrophages, in the presence of 500 ng/mL of neutralizing antibody against human-IL-6. Graphic shows the fold change in RAC1B protein relative to control and represent mean values ± SEM of at least 5 independent experiments. Statistical analysis was carried out with a one-way ANOVA test (F = 9.62, p = 0.0003), followed by Tukey’s post hoc tests; * or # significantly different with p < 0.01 from the corresponding controls (T84 + T84) or (T48 + CT5.3 + M1), respectively. (GI) RAC1B levels after addition of purified cytokines. Polarized T84 cells were grown on filter inserts and then 10 ng/mL of purified IL-6 or IL-11 (negative control) were added to the basolateral growth medium, and cells lysed after 48 h. (G) Proteins were analysed by SDS-PAGE and the indicated proteins detected by WB. Graphs show data as fold change in (H) RAC1B protein or (I) transcript levels by qRT-PCR relative to control (addition of antibody solvent PBS to the medium) and represent mean values ± SEM, of at least 6 independent experiments. Statistical analysis was carried out with a one-way ANOVA test (F = 4.81, p = 0.0112), followed by Tukey’s post hoc tests; * and # indicate significant differences (p < 0.05) from the control (PBS) and IL-6, respectively.

Similar articles

Cited by

References

    1. Zhang K., Hornef M.W., Dupont A. The intestinal epithelium as guardian of gut barrier integrity: The epithelium as a barrier to infection. Cell. Microbiol. 2015;17:1561–1569. doi: 10.1111/cmi.12501. - DOI - PubMed
    1. Sung H., Ferlay J., Siegel R.L., Laversanne M., Soerjomataram I., Jemal A., Bray F. Global Cancer Statistics 2020: GLOBOCAN Estimates of Incidence and Mortality Worldwide for 36 Cancers in 185 Countries. CA Cancer J. Clin. 2021;71:209–249. doi: 10.3322/caac.21660. - DOI - PubMed
    1. Velho S., Moutinho C., Cirnes L., Albuquerque C., Hamelin R., Schmitt F., Carneiro F., Oliveira C., Seruca R. BRAF, KRAS and PIK3CA mutations in colorectal serrated polyps and cancer: Primary or secondary genetic events in colorectal carcinogenesis? BMC Cancer. 2008;8:255. doi: 10.1186/1471-2407-8-255. - DOI - PMC - PubMed
    1. Brenner H., Kloor M., Pox C.P. Colorectal cancer. Lancet. 2014;383:1490–1502. doi: 10.1016/S0140-6736(13)61649-9. - DOI - PubMed
    1. Jordan P. Colorectal Cancer Subtypes—The Current Portrait. In: Jordan P., editor. Targeted Therapy of Colorectal Cancer Subtypes. Volome 1110. Springer International Publishing; Cham, Switzerland: 2018. pp. 1–6. Advances in Experimental Medicine and Biology. - PubMed