Anandamide-Modulated Changes in Metabolism, Glycosylation Profile and Migration of Metastatic Melanoma Cells
- PMID: 35326572
- PMCID: PMC8946642
- DOI: 10.3390/cancers14061419
Anandamide-Modulated Changes in Metabolism, Glycosylation Profile and Migration of Metastatic Melanoma Cells
Abstract
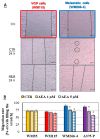
An effective therapy for advanced melanoma, a skin cancer with the highest mortality, has not yet been developed. The endocannabinoid system is considered to be an attractive target for cancer treatment. The use of endocannabinoids, such as anandamide (AEA), is considered to be much greater than as a palliative agent. Thus, we checked its influence on various signaling pathways in melanoma cells. Our investigation was performed on four commercial cell lines derived from different progression stages (radial WM35 and vertical WM115 growth phases, lymph node WM266-4 metastasis, solid tumor A375-P metastasis). Cell viability, glucose uptake, quantification of reactive oxygen species production, expression of selected genes encoding glycosyltransferases, quantification of glycoproteins production and changes in the glycosylation profile and migration, as well as in cell elastic properties were analyzed. The cell glycosylation profile was investigated using the biophysical profiling method-the quartz crystal microbalance with dissipation monitoring (QCM-D). Anandamide treatment of only metastatic cells resulted in: an increase in the cell metabolism, a decrease in GFAT-1 and DPM1 expression, followed by a decrease in L1-CAM glycoprotein production, which further influenced the reduction in the cell glycosylation profile and migration. Considering our results, AEA usage is highly recommended in the combined therapy of advanced melanoma.
Keywords: anandamide; biophysical methods; glycosylation profile; lectin–glycan interaction; melanoma metastasis; metabolism; migration.
Conflict of interest statement
The authors declare no conflict of interest.
Figures


Similar articles
-
AFM and QCM-D as tools for the distinction of melanoma cells with a different metastatic potential.Biosens Bioelectron. 2017 Jul 15;93:274-281. doi: 10.1016/j.bios.2016.08.088. Epub 2016 Aug 27. Biosens Bioelectron. 2017. PMID: 27591901
-
Novel diagnostic and prognostic factors for the advanced melanoma based on the glycosylation-related changes studied by biophysical profiling methods.Biosens Bioelectron. 2022 May 1;203:114046. doi: 10.1016/j.bios.2022.114046. Epub 2022 Jan 29. Biosens Bioelectron. 2022. PMID: 35121451
-
Expression of fucosyltransferases contributes to melanoma invasive phenotype.Med Chem. 2007 Sep;3(5):418-24. doi: 10.2174/157340607781745401. Med Chem. 2007. PMID: 17897065
-
The Role of Glycosylation in Melanoma Progression.Cells. 2021 Aug 19;10(8):2136. doi: 10.3390/cells10082136. Cells. 2021. PMID: 34440905 Free PMC article. Review.
-
Cellular adhesion pathways and metastatic potential of human melanoma.Cancer Biol Ther. 2002 Sep-Oct;1(5):459-65. doi: 10.4161/cbt.1.5.158. Cancer Biol Ther. 2002. PMID: 12496470 Review.
Cited by
-
Anandamide modulation of monocyte-derived Langerhans cells: implications for immune homeostasis and skin inflammation.Front Immunol. 2024 Jun 24;15:1423776. doi: 10.3389/fimmu.2024.1423776. eCollection 2024. Front Immunol. 2024. PMID: 38979427 Free PMC article.
-
A zebrafish HCT116 xenograft model to predict anandamide outcomes on colorectal cancer.Cell Death Dis. 2022 Dec 23;13(12):1069. doi: 10.1038/s41419-022-05523-z. Cell Death Dis. 2022. PMID: 36564370 Free PMC article.
-
Exploring Extracellular Vesicles of Probiotic Yeast as Carriers of Biologically Active Molecules Transferred to Human Intestinal Cells.Int J Mol Sci. 2023 Jul 12;24(14):11340. doi: 10.3390/ijms241411340. Int J Mol Sci. 2023. PMID: 37511103 Free PMC article.
-
Application of Biophysical Techniques to Cellular and Molecular Oncology.Cancers (Basel). 2023 May 26;15(11):2919. doi: 10.3390/cancers15112919. Cancers (Basel). 2023. PMID: 37296882 Free PMC article.
References
-
- Campagna R., Pozzi V., Sartini D., Salvolini E., Brisigotti V., Molinelli E., Campanati A., Offidani A., Emanuelli M. Beyond Nicotinamide Metabolism: Potential Role of Nicotinamide N-Methyltransferase as a Biomarker in Skin Cancers. Cancers. 2021;13:4943. doi: 10.3390/cancers13194943. - DOI - PMC - PubMed
Grants and funding
LinkOut - more resources
Full Text Sources
Miscellaneous

