

A Novel Framework for the Optimization of Simultaneous ThermoBrachyTherapy
- PMID: 35326574
- PMCID: PMC8946271
- DOI: 10.3390/cancers14061425
A Novel Framework for the Optimization of Simultaneous ThermoBrachyTherapy
Abstract
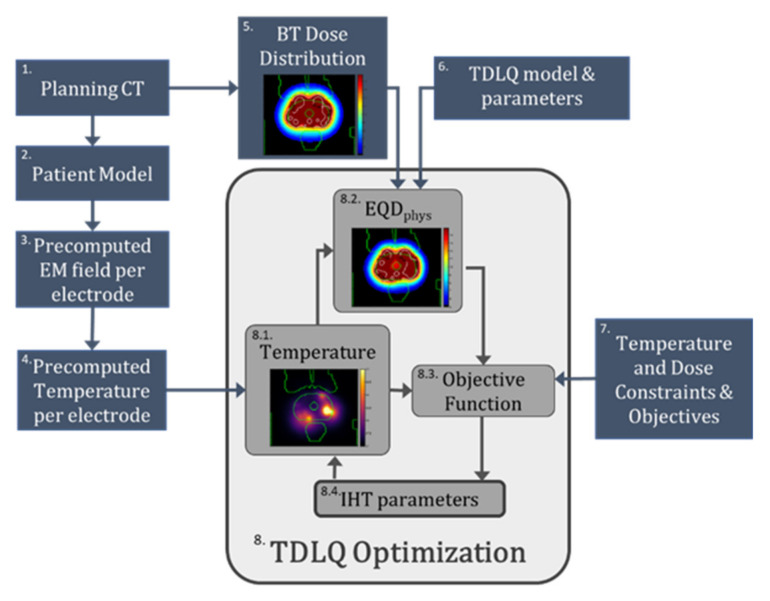
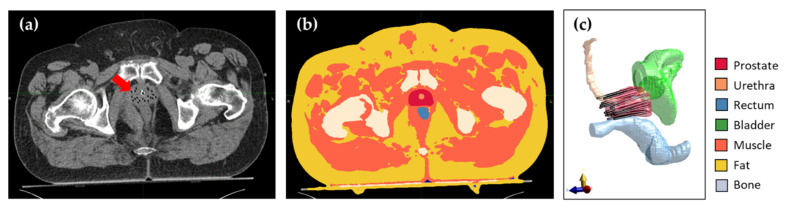
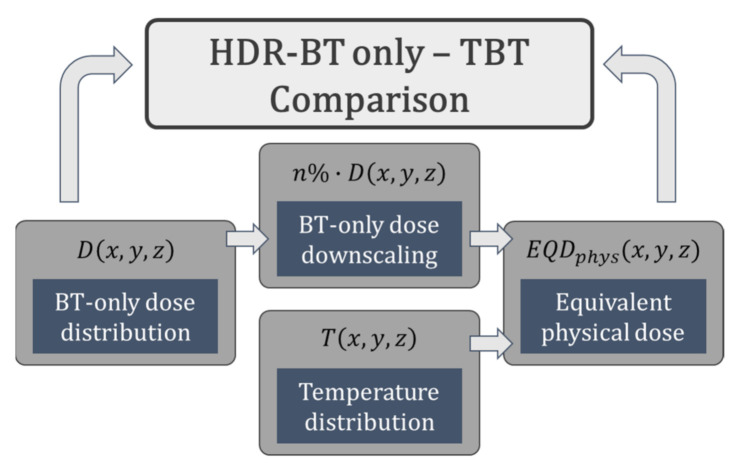
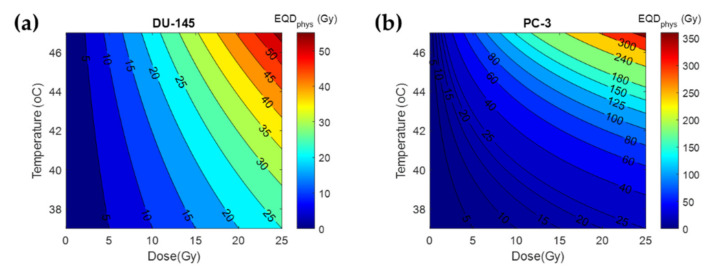
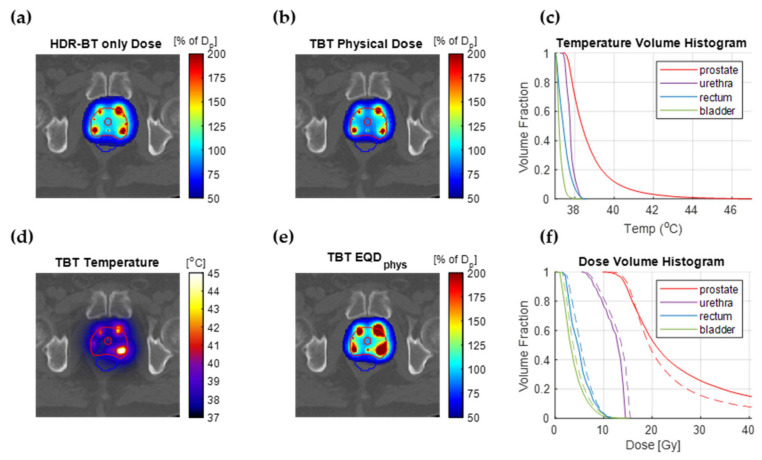
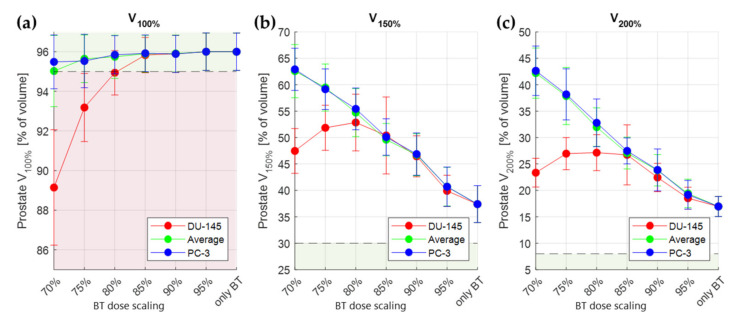
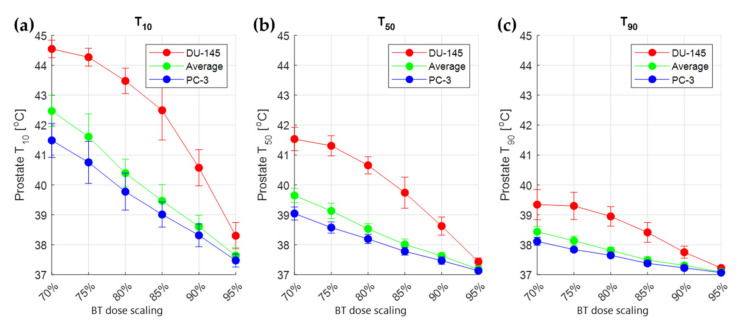
In high-dose-rate brachytherapy (HDR-BT) for prostate cancer treatment, interstitial hyperthermia (IHT) is applied to sensitize the tumor to the radiation (RT) dose, aiming at a more efficient treatment. Simultaneous application of HDR-BT and IHT is anticipated to provide maximum radiosensitization of the tumor. With this rationale, the ThermoBrachyTherapy applicators have been designed and developed, enabling simultaneous irradiation and heating. In this research, we present a method to optimize the three-dimensional temperature distribution for simultaneous HDR-BT and IHT based on the resulting equivalent physical dose (EQDphys) of the combined treatment. First, the temperature resulting from each electrode is precomputed. Then, for a given set of electrode settings and a precomputed radiation dose, the EQDphys is calculated based on the temperature-dependent linear-quadratic model. Finally, the optimum set of electrode settings is found through an optimization algorithm. The method is applied on implant geometries and anatomical data of 10 previously irradiated patients, using reported thermoradiobiological parameters and physical doses. We found that an equal equivalent dose coverage of the target can be achieved with a physical RT dose reduction of 20% together with a significantly lower EQDphys to the organs at risk (p-value < 0.001), even in the least favorable scenarios. As a result, simultaneous ThermoBrachyTherapy could lead to a relevant therapeutic benefit for patients with prostate cancer.
Keywords: biological modeling; brachytherapy; hyperthermia; induced; interstitial hyperthermia; linear quadratic model; prostate; prostatic neoplasms; thermoradiotherapy; treatment plan optimization.
Conflict of interest statement
The authors declare no conflict of interest. The funders had no role in the design of the study; in the collection, analyses, or interpretation of data; in the writing of the manuscript, or in the decision to publish the results.
Figures
Similar articles
-
Preclinical prototype validation and characterization of a thermobrachytherapy system for interstitial hyperthermia and high-dose-rate brachytherapy.Phys Imaging Radiat Oncol. 2024 Jun 27;31:100606. doi: 10.1016/j.phro.2024.100606. eCollection 2024 Jul. Phys Imaging Radiat Oncol. 2024. PMID: 39100864 Free PMC article.
-
Simultaneous ThermoBrachytherapy: Electromagnetic Simulation Methods for Fast and Accurate Adaptive Treatment Planning.Sensors (Basel). 2022 Feb 9;22(4):1328. doi: 10.3390/s22041328. Sensors (Basel). 2022. PMID: 35214230 Free PMC article.
-
Optimisation-based thermal treatment planning for catheter-based ultrasound hyperthermia.Int J Hyperthermia. 2010 Feb;26(1):39-55. doi: 10.3109/02656730903341332. Int J Hyperthermia. 2010. PMID: 20100052
-
High dose rate brachytherapy in the treatment of prostate cancer.World J Urol. 2003 Sep;21(4):220-8. doi: 10.1007/s00345-003-0358-8. Epub 2003 Aug 5. World J Urol. 2003. PMID: 12905008 Review.
-
Interstitial thermoradiotherapy: review on technical and clinical aspects.Am J Clin Oncol. 1990 Aug;13(4):352-63. Am J Clin Oncol. 1990. PMID: 2198798 Review.
Cited by
-
Preclinical prototype validation and characterization of a thermobrachytherapy system for interstitial hyperthermia and high-dose-rate brachytherapy.Phys Imaging Radiat Oncol. 2024 Jun 27;31:100606. doi: 10.1016/j.phro.2024.100606. eCollection 2024 Jul. Phys Imaging Radiat Oncol. 2024. PMID: 39100864 Free PMC article.
-
Oncologic Thermoradiotherapy: Need for Evidence, Harmonisation, and Innovation.Cancers (Basel). 2022 May 13;14(10):2418. doi: 10.3390/cancers14102418. Cancers (Basel). 2022. PMID: 35626026 Free PMC article.
-
Biological treatment evaluation in thermoradiotherapy: application in cervical cancer patients.Strahlenther Onkol. 2024 Jun;200(6):512-522. doi: 10.1007/s00066-023-02185-4. Epub 2024 Jan 4. Strahlenther Onkol. 2024. PMID: 38177701 Free PMC article.
References
-
- Miralbell R., Roberts S.A., Zubizarreta E., Hendry J.H. Dose-Fractionation Sensitivity of Prostate Cancer Deduced from Radiotherapy Outcomes of 5,969 Patients in Seven International Institutional Datasets: α/β = 1.4 (0.9–2.2) Gy. Int. J. Radiat. Oncol. Biol. Phys. 2012;82:e17–e24. doi: 10.1016/j.ijrobp.2010.10.075. - DOI - PubMed
-
- Gocho T., Hori M., Fukushima Y., Someya M., Kitagawa M., Hasegawa T., Tsuchiya T., Hareyama M., Takagi M., Hashimoto K. Evaluation of the Urethral α/β Ratio and Tissue Repair Half-Time for Iodine-125 Prostate Brachytherapy with or without Supplemental External Beam Radiotherapy. Brachytherapy. 2020;19:290–297. doi: 10.1016/j.brachy.2020.02.007. - DOI - PubMed
-
- Brand D.H., Brüningk S.C., Wilkins A., Fernandez K., Naismith O., Gao A., Syndikus I., Dearnaley D.P., Tree A.C., van As N. Estimates of Alpha/Beta (α/β) Ratios for Individual Late Rectal Toxicity Endpoints: An Analysis of the CHHiP Trial. Int. J. Radiat. Oncol. Biol. Phys. 2021;110:596–608. doi: 10.1016/j.ijrobp.2020.12.041. - DOI - PMC - PubMed
Grants and funding
LinkOut - more resources
Full Text Sources
Research Materials
