. 2022 Mar 15;14(6):1497.
doi: 10.3390/cancers14061497.

Conversion of a Non-Cancer-Selective Promoter into a Cancer-Selective Promoter

Affiliations

Conversion of a Non-Cancer-Selective Promoter into a Cancer-Selective Promoter

Praveen Bhoopathi et al. Cancers (Basel). .

Abstract

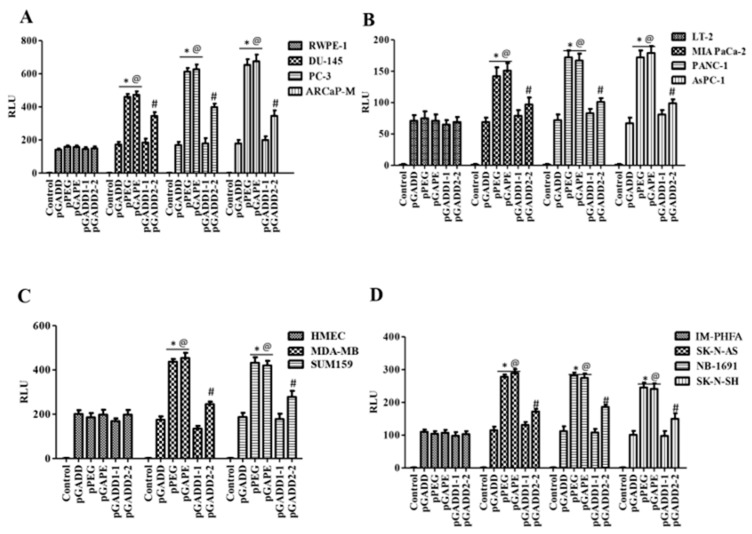
Progression-elevated gene-3 (PEG-3) and rat growth arrest and DNA damage-inducible gene-34 (GADD34) display significant sequence homology with regulation predominantly transcriptional. The rat full-length (FL) and minimal (min) PEG-3 promoter display cancer-selective expression in rodent and human tumors, allowing for cancer-directed regulation of transgenes, viral replication and in vivo imaging of tumors and metastases in animals, whereas the FL- and min-GADD34-Prom lack cancer specificity. Min-PEG-Prom and min-GADD34-Prom have identical sequences except for two single-point mutation differences (at -260 bp and +159 bp). Engineering double mutations in the min-GADD34-Prom produce the GAPE-Prom. Changing one base pair (+159) or both point mutations in the min-GADD34-Prom, but not the FL-GADD34-Prom, results in cancer-selective transgene expression in diverse cancer cells (including prostate, breast, pancreatic and neuroblastoma) vs. normal counterparts. Additionally, we identified a GATA2 transcription factor binding site, promoting cancer specificity when both min-PEG-Prom mutations are present in the GAPE-Prom. Taken together, introducing specific point mutations in a rat min-GADD34-Prom converts this non-cancer-specific promoter into a cancer-selective promoter, and the addition of GATA2 with existing AP1 and PEA3 transcription factors enhances further cancer-selective activity of the GAPE-Prom. The GAPE-Prom provides a genetic tool to specifically regulate transgene expression in cancer cells.

Keywords: GADD34; GATA2; PEG-3; cancer selective promoter; transcriptional regulation; tumor and metastasis imaging.


Conflict of interest statement

P.B.F. is a scientific co-founder and has equity in InterLeukin Combinatorial Therapies, Inc. (ILCT). VCU also has equity in ILCT. L.E. is the PI of a sponsored research agreement with ILCT, which is being managed by VCU. L.E. is also the PI of a Catalyst Matching Fund grant between ILCT and VCU. The other authors declare no conflict of interest.

Figures

Figure 1
Figure 1
pGAPE displays similar elevated expression in cancer cells, as does the pPEG. (A) Schematic representation of conversion of pGADD to pGAPE. (B) Immortalized human prostate epithelial (RWPE-1) and prostate cancer (DU-145, PC-3 and ARCaP-M) cells. (C) Human immortalized pancreatic mesenchymal (LT-2) and pancreatic cancer (MIA PaCa-2, AsPC-1 and PANC-1) cells. (D) Primary human mammary epithelial (HMEC) and breast cancer (MDA-MB-231 and SUM159) cells. (E) Immortalized primary human fetal astrocytes (IM-PHFA) and neuroblastoma (SK-N-AS, NB-1691 and SK-N-SH) cells were transfected with the PGL4-Luc (Control), rat min-GADD34-Prom (pGADD), min-PEG-Prom (pPEG) or GAPE-Prom (pGAPE) for 48 h. Expression was normalized using pRL-TK, and the luminescence readings were plotted as relative luminescence units (RLU). The results presented are from three independent experiments with triplicate samples for each experimental variable. *, p < 0.01 vs. pGADD in each cell line (FDR corrected); @, p < 0.01 vs. pPEG/pGAPE (FDR corrected) in normal primary or immortal cell line.
Figure 2
Figure 2
Tumor specificity of pGAPE. (A) DU-145 tumor xenografts in male athymic nude mice (n = 5) were intravenously injected with a Luc expression construct pGADD-Luc-PEI polyplex, pPEG-Luc-PEI polyplex or pGAPE-Luc-PEI polyplex, and BLI was performed after 48 h by IVIS. pGADD tumors negative for imaging are shown with white broken circles, and pPEG and pGAPE tumors positive for imaging are shown with solid red circles. (B) Tumor-bearing transgenic PyMT (n = 5) mice were treated as above, and BLI was performed after 48 h by IVIS. pGADD tumors negative for imaging are shown with white broken circles, and pPEG and pGAPE tumors positive for imaging are shown with solid red circles. (C) Tumor-bearing transgenic Hi-Myc mice (n = 5) were treated as above, and BLI was performed after 48 h by IVIS. We used control vector without the luciferase gene in the pNull group. (D) 4T1 breast cancer cells were intravenously injected into immune-competent mice (Left panel), and PC3-ML cells were intravenously injected into nude mice (right panel) followed by intravenous injection of pPEG-Luc-PEI polyplex or pGAPE-Luc-PEI polyplex, respectively. BLI was performed after 48 h by IVIS. (E) ROI determination for different tumor models. (Left panel) Total ROI calculated from DU-145 tumor-bearing mice (from A) and represented in graphical manner. (Center panel) Total ROI is calculated from PyMT (from B) and represented in graphical manner. (right) Total ROI is calculated from Hi-Myc mice and represented in graphical manner. *, p < 0.01 vs. pGADD.
Figure 3
Figure 3
A single C-T mutation in the pGADD results in cancer specificity, which is less active than pGADD with two mutations. (A) Immortalized human prostate epithelial (RWPE-1) and prostate cancer (DU-145, PC-3 and ARCaP-M) cells. (B) Human immortalized pancreatic mesenchymal (LT-2) and pancreatic cancer (MIA PaCa-2, AsPC-1 and PANC-1) cells. (C) Primary human mammary epithelial (HMEC) and breast cancer (MDA-MB-231 and SUM159) cells. (D) Immortalized primary human fetal astrocytes (IM-PHFA) and neuroblastoma (SK-N-AS, NB-1691 and SK-N-SH) cells were transfected with PGL4-Luc (control), pGADD, pPEG, pGAPE, pGADD1-1 or pGADD2-2 for 48 h. Expression was normalized using pRL-TK, and the luminescence readings were plotted as relative luminescence units (RLU). The results presented are from three independent experiments with three replicates per experimental condition. *, p < 0.01 vs. pGADD (FDR corrected) within the individual cell lines; #, p < 0.05 vs. pGADD (FDR corrected) within the individual cell line; @, p < 0.01 vs. pPEG/pGAPE (FDR corrected) in a normal primary or immortalized normal cell line.
Figure 4
Figure 4
Changes in GATA2 expression affect cancer specificity. (A) Western blotting analysis for GATA2 expression levels in different cancer cells (prostate, pancreas, breast and neuroblastoma) compared with immortalized or primary normal cells. (B) RWPE-1/DU-145 cells were either transfected with a GATA2 overexpression (OE) plasmid or with an shGATA2 (small hairpin inhibitory RNA) plasmid, then were cultured for 48 h, and cells were collected, lysed and used for Western blotting. Blots were stained for GATA2, or β-Actin as a loading control. (C) RWPE-1 and (D) DU-145 cells were either transfected with a GATA2 OE plasmid or with a shGATA2 plasmid, cultured for 48 h and transfected with PGL4-Luc (control), pGADD, pPEG or pGAPE for an additional 48 h. Expression was normalized using pRL-TK, and the luminescence readings were plotted as relative luminescence units (RLU). The results presented are from three independent experiments. #, p < 0.01 vs. pGADD; *, p < 0.01 vs. pGADD-GATA2 OE; @, p < 0.05 vs. pPEG/pGAPE control (FDR corrected).
Figure 5
Figure 5
Quantitative ChIP analysis confirms cancer specificity of pGAPE. (A) DU-145/RWPE-1 cells were transfected with pGAPE for 48 h and used for ChIP assay. ChIP assays were performed using the GATA2 antibody and different primer sets (pGAPE, pGADD, pGADD1-1 and pGADD2-2-Prom) with the pPEG as the target for PCR amplification. (B) DU-145/RWPE-1 cells were transfected with pGADD for 48 h and used for ChIP assay. ChIP assays were performed using the GATA2 antibody with different primer sets (pGAPE, pGADD, pGADD1-1 and pGADD2-2) and pPEG as the target for PCR amplification. Quantitative real-time PCR (qPCR) was performed to quantify the DNA in the samples with different sets of primers (pGAPE, pGADD34, pGADD1-1 and pGADD2-2 primers) as indicated. The results presented are from three independent experiments. *, p < 0.01 vs. pGAPE-control. (C) GATA2 was either overexpressed or downregulated in DU-145/RWPE-1 cells and transfected with the indicated plasmids. ChIP assays were performed using GATA2 antibody with pGAPE primer sets using pGAPE as the target for PCR amplification (left and center panel), with pGADD primer sets with pGAPE as the target for PCR amplification (right panel). Quantitative real-time PCR (qPCR) was performed to quantify the DNA in the samples. The results presented are from three independent experiments. *, p < 0.01 vs. control; #, p < 0.05 vs. control (FDR corrected).
Figure 6
Figure 6
Promoter analysis of full length GADD34-Prom (pT-GADD) with single or double mutations in different cancer cells. (A) Immortalized human prostate epithelial (RWPE-1) and prostate cancer (DU-145, PC-3 and ARCaP-M) cells. *, p < 0.01 vs. RWPE-pGADD (FDR corrected); @, p < 0.01 vs. RWPE-pGADD (FDR corrected); #, not significant compared to PEG/GAPE between the cell lines. (B) Human immortalized pancreatic mesenchymal (LT-2) and pancreatic cancer (MIA PaCa-2, AsPC-1 and PANC-1) cells were transfected with PGL4-Luc (Control), pGADD34, pPEG, pGAPE, pT-GADD, pT-GADD1-1, pT-GADD2-2, or pT-GADD-2. Expression was normalized using pRL-TK, and the luminescence readings were plotted as relative luminescence units (RLU). The results presented are from three independent experiments. *, p < 0.01 vs. RWPE-pGADD (FDR corrected); @, p < 0.01 vs. RWPE-pGADD (FDR corrected); #, not significant compared to PEG/GAPE between the cell lines. (C) Flow chart showing the effect of different mutations in the pGADD and resultant properties. pGADD1-1 single mutation (bp −260, G-A), pGADD2-2 single mutation (bp +159, C-T) and pGAPE double mutants (bp −260 and bp +159). pGADD2-2 shows partial cancer selectivity, while pGAPE shows enhanced cancer selectivity. pGAPE can be used to generate transgene-expressing constructs that express uniquely at elevated levels in cancer cells, with minimal expression in normal cells.

Similar articles

References

    1. Vogelstein B., Kinzler K.W. The multistep nature of cancer. Trends Genet. 1993;9:138–141. doi: 10.1016/0168-9525(93)90209-Z. - DOI - PubMed
    1. Carbone M., Pass H.I. Multistep and multifactorial carcinogenesis: When does a contributing factor become a carcinogen? Semin. Cancer Biol. 2004;14:399–405. doi: 10.1016/j.semcancer.2004.06.002. - DOI - PubMed
    1. Chaffer C.L., Weinberg R.A. How does multistep tumorigenesis really proceed? Cancer Discov. 2015;5:22–24. doi: 10.1158/2159-8290.CD-14-0788. - DOI - PMC - PubMed
    1. Adolph K.W., Reddy P.G., Su Z.-Z., Fisher P.B. In: Chromosome and Genetic Analysis: Methods in Molecular Genetics. Adolph K.W., editor. Volume 1. Academic; Orlando, FL, USA: 1993. pp. 68–102.
    1. Su Z.Z., Shi Y., Fisher P.B. Subtraction hybridization identifies a transformation progression-associated gene PEG-3 with sequence homology to a growth arrest and DNA damage-inducible gene. Proc. Natl. Acad. Sci. USA. 1997;94:9125–9130. doi: 10.1073/pnas.94.17.9125. - DOI - PMC - PubMed

LinkOut - more resources