. 2022 Mar 15;14(6):1499.
doi: 10.3390/cancers14061499.

Ion Channel Drugs Suppress Cancer Phenotype in NG108-15 and U87 Cells: Toward Novel Electroceuticals for Glioblastoma

Affiliations

Ion Channel Drugs Suppress Cancer Phenotype in NG108-15 and U87 Cells: Toward Novel Electroceuticals for Glioblastoma

Juanita Mathews et al. Cancers (Basel). .

Abstract

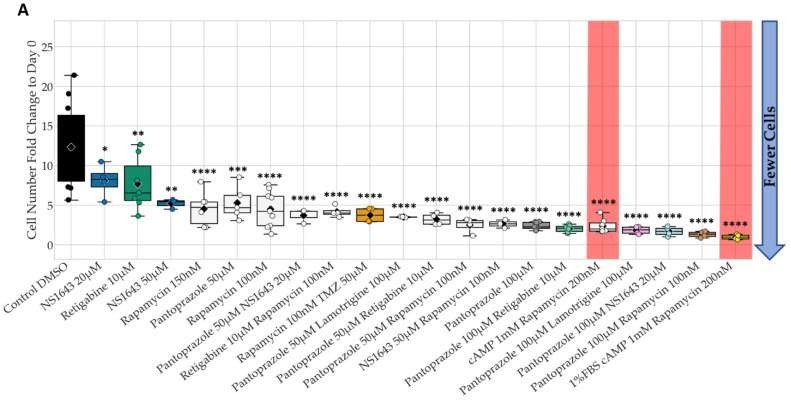
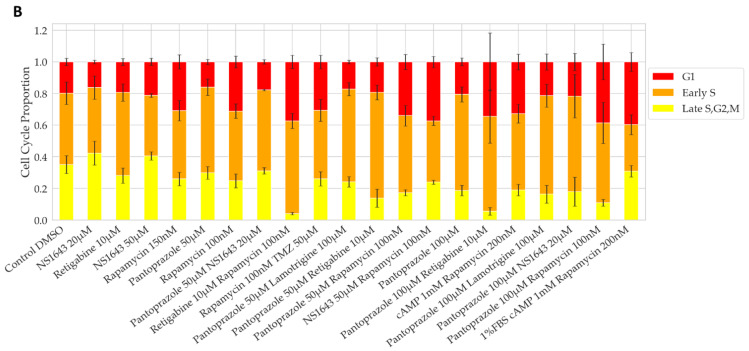
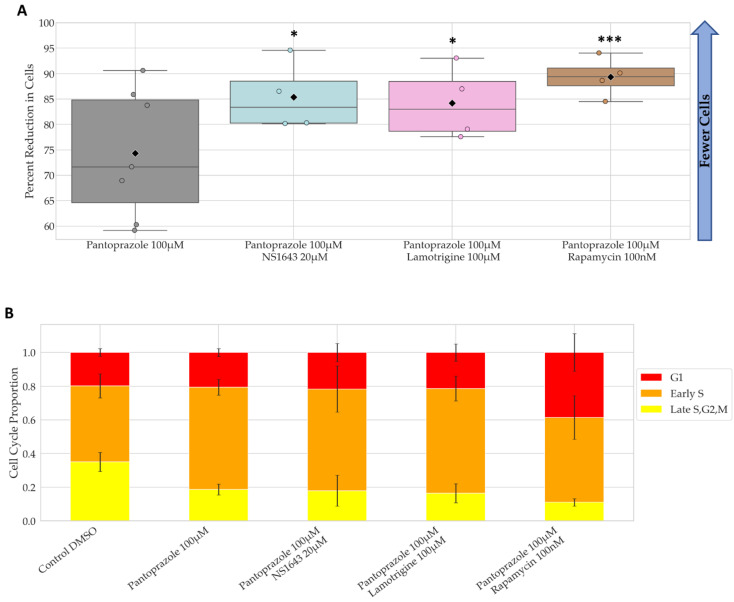
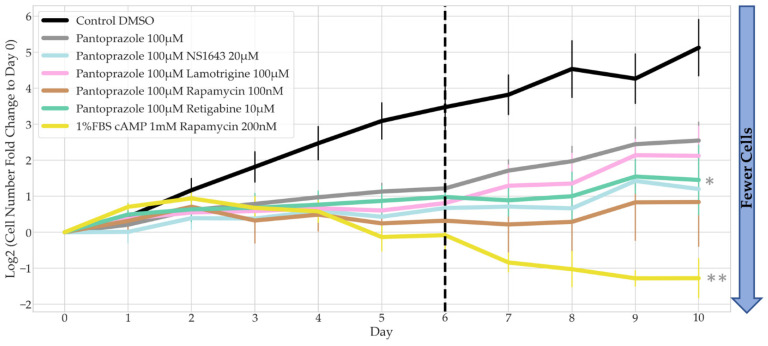
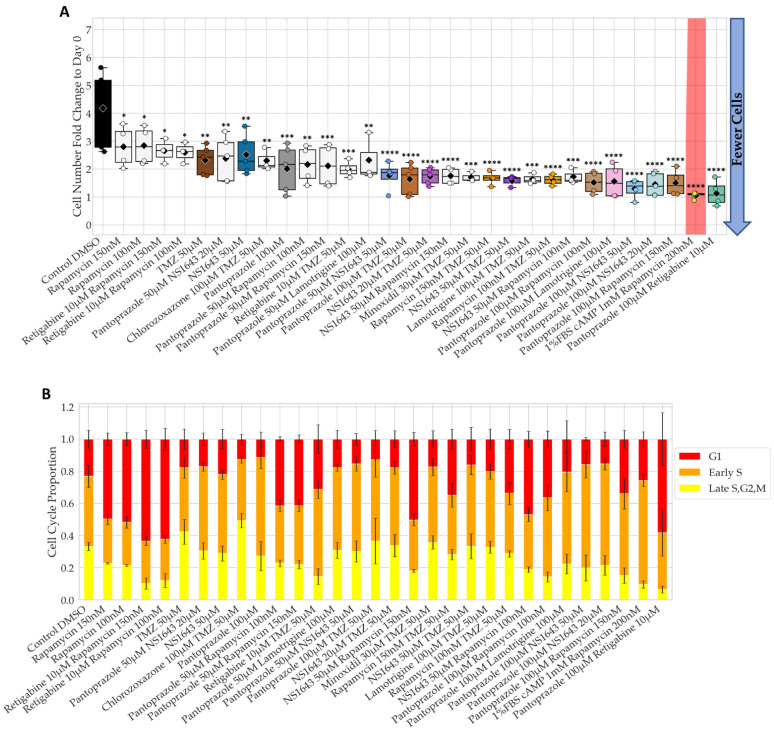
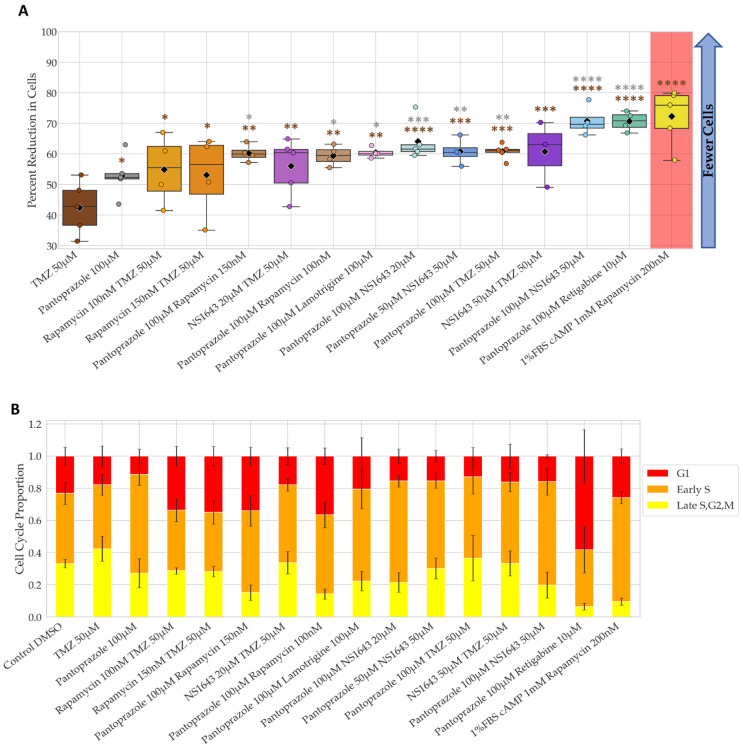
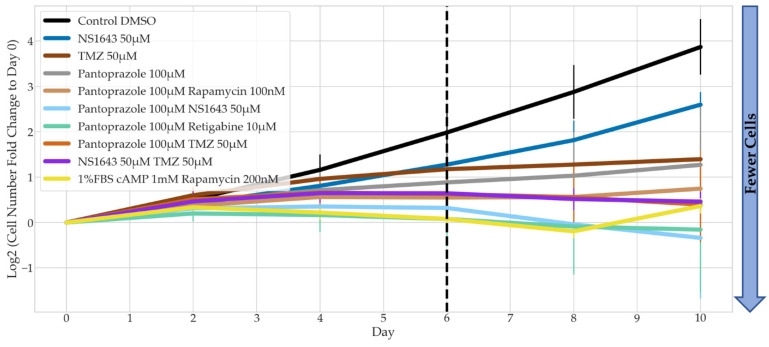
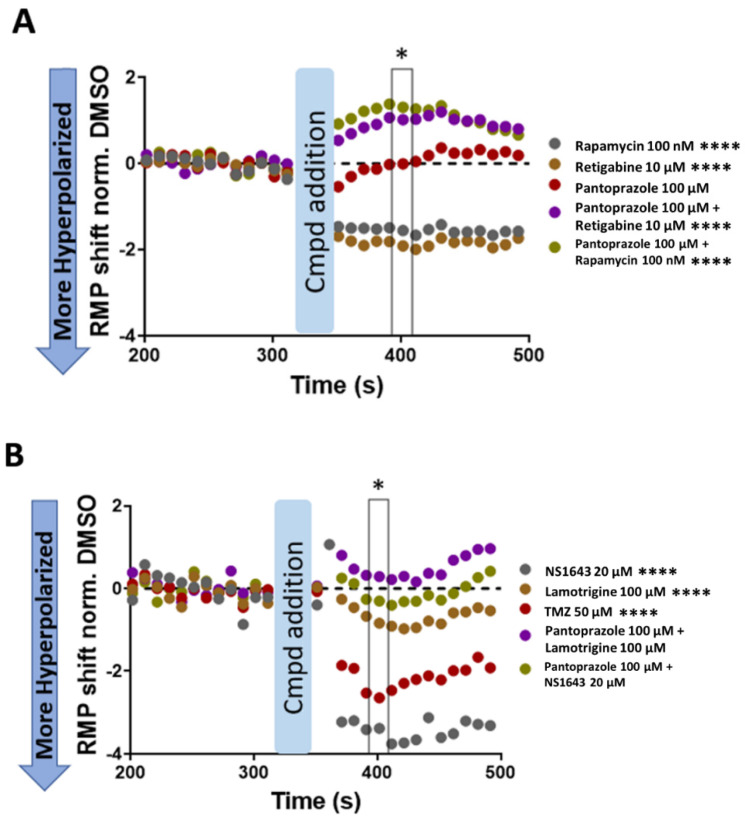
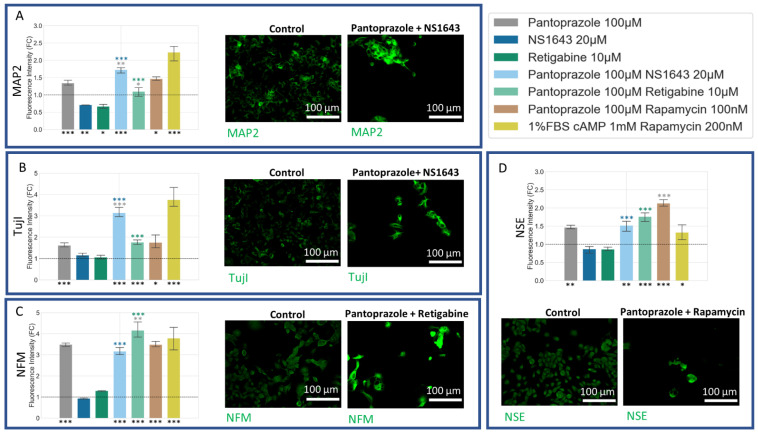
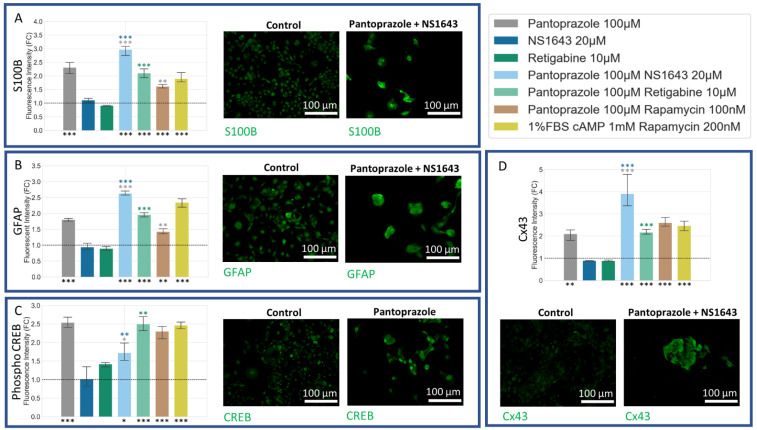
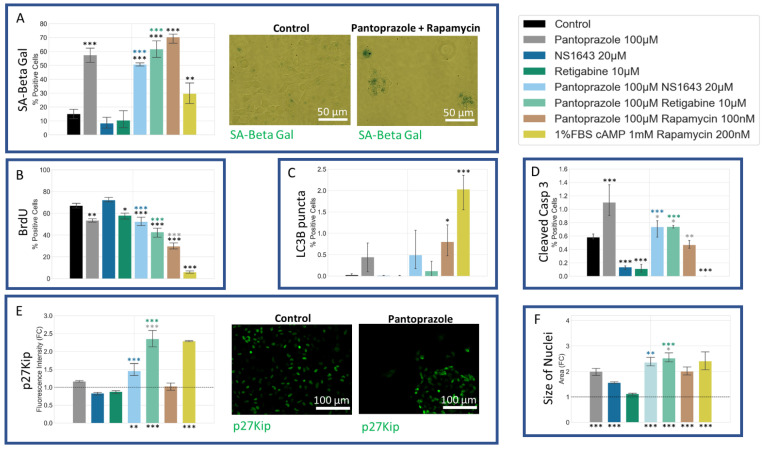
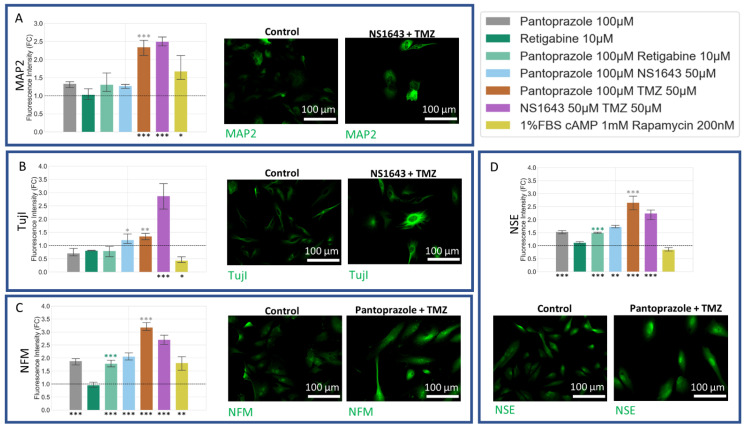
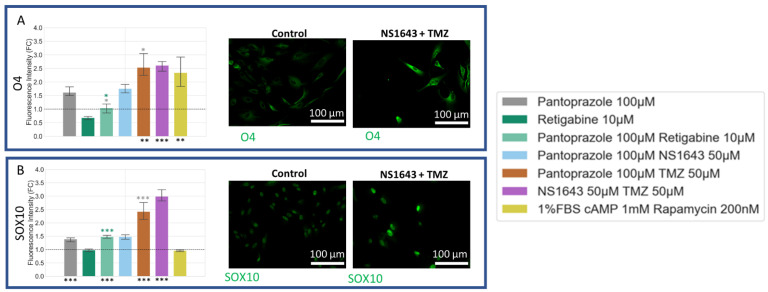
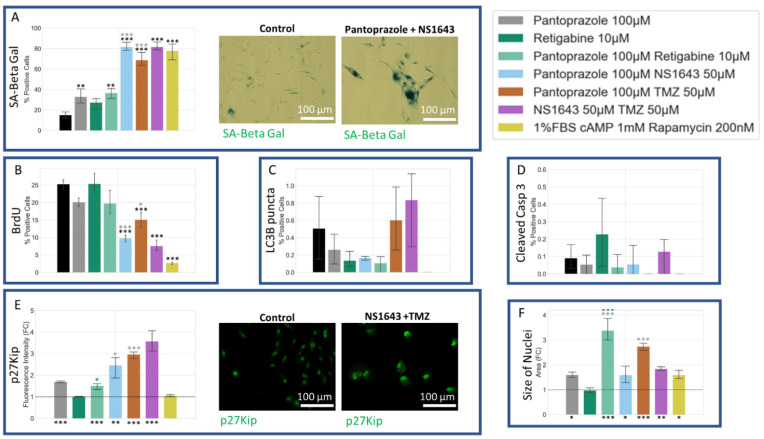
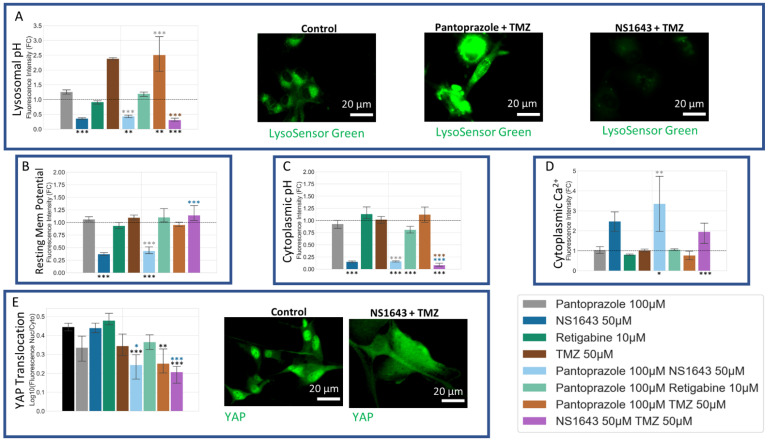
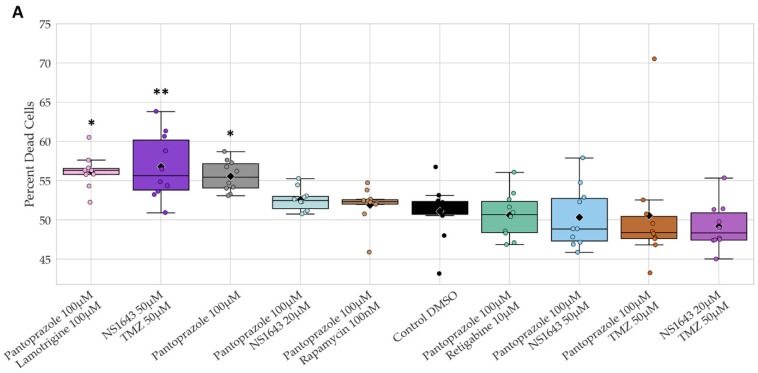
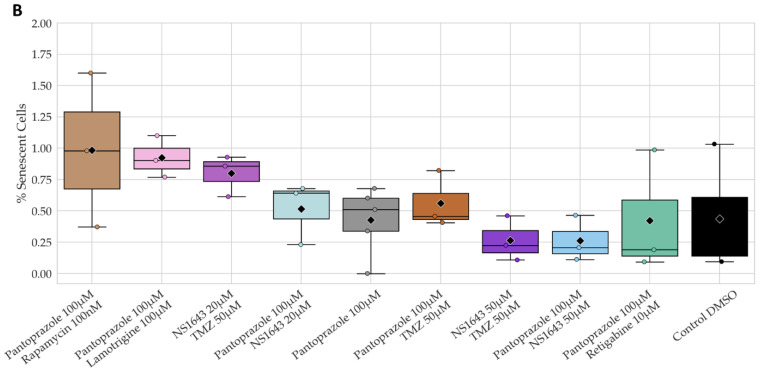
Glioblastoma is a lethal brain cancer that commonly recurs after tumor resection and chemotherapy treatment. Depolarized resting membrane potentials and an acidic intertumoral extracellular pH have been associated with a proliferative state and drug resistance, suggesting that forced hyperpolarization and disruption of proton pumps in the plasma membrane could be a successful strategy for targeting glioblastoma overgrowth. We screened 47 compounds and compound combinations, most of which were ion-modulating, at different concentrations in the NG108-15 rodent neuroblastoma/glioma cell line. A subset of these were tested in the U87 human glioblastoma cell line. A FUCCI cell cycle reporter was stably integrated into both cell lines to monitor proliferation and cell cycle response. Immunocytochemistry, electrophysiology, and a panel of physiological dyes reporting voltage, calcium, and pH were used to characterize responses. The most effective treatments on proliferation in U87 cells were combinations of NS1643 and pantoprazole; retigabine and pantoprazole; and pantoprazole or NS1643 with temozolomide. Marker analysis and physiological dye signatures suggest that exposure to bioelectric drugs significantly reduces proliferation, makes the cells senescent, and promotes differentiation. These results, along with the observed low toxicity in human neurons, show the high efficacy of electroceuticals utilizing combinations of repurposed FDA approved drugs.

Keywords: NG108-15; U89; blockers; cancer; glioblastoma; ion channel; openers.


Conflict of interest statement

The authors declare no conflict of interest. The funder had no role in the design of the experiments, the collection, analyses, or interpretation of data, in the writing of the manuscript, or in the decision to publish the results.

Figures

Figure 1
Figure 1
NG108-15 Proliferation is Significantly Lowered with Bioelectric Treatment and Show Changes in Cell Cycle Ratios. (A) Fold change to start cell counts (cells at day 6/cells at day 0) after 6 days of treatment. Low values indicate less cell growth. Colors indicate treatments followed up for further analysis, and hues represent concentrations and combinations. Red shaded treatments correspond to positive controls that cannot be used clinically. Only treatments with significant values are shown out of 33 treatments compared to DMSO control. ****: q < 0.0001 ***: q < 0.001, **: q < 0.01, *: q < 0.05 (one-way ANOVA with FDR post hoc analysis n > 3 biological replicates). (B) FUCCI cell cycle data at day 6. Increased red and orange fractions indicate cell cycle arrest at G1 or G1 to S transition.
Figure 1
Figure 1
NG108-15 Proliferation is Significantly Lowered with Bioelectric Treatment and Show Changes in Cell Cycle Ratios. (A) Fold change to start cell counts (cells at day 6/cells at day 0) after 6 days of treatment. Low values indicate less cell growth. Colors indicate treatments followed up for further analysis, and hues represent concentrations and combinations. Red shaded treatments correspond to positive controls that cannot be used clinically. Only treatments with significant values are shown out of 33 treatments compared to DMSO control. ****: q < 0.0001 ***: q < 0.001, **: q < 0.01, *: q < 0.05 (one-way ANOVA with FDR post hoc analysis n > 3 biological replicates). (B) FUCCI cell cycle data at day 6. Increased red and orange fractions indicate cell cycle arrest at G1 or G1 to S transition.
Figure 2
Figure 2
Combinations of Pantoprazole with Bioelectric Compounds Significantly Decrease Proliferation Compared to Pantoprazole Alone and Show Changes in Cell Cycle Ratio. (A) Percent reduction in cells compared to control after 6 days of treatment. Treatments that were significantly more effective than pantoprazole alone are shown out of 32 treatments. Statistical analysis was conducted on the log2 of the fold change in cell number to control on day 6. ***: q < 0.001, *: q < 0.05 (one-way ANOVA with FDR post hoc analysis n > 3 biological replicates). (B) FUCCI cell cycle data at day 6. Increased red and orange fractions indicate cell cycle arrest at G1 or G1 to S transition.
Figure 3
Figure 3
Recovery Test of Bioelectric Treatments in Combination with Pantoprazole in NG108-15 FUCCI Cells. The log2 of the fold change in cell counts to Day 0 were recorded for 10 days. Dotted line marks the day on which drug treatment was removed and replaced with control media (n > 3 biological replicates). Combination drug treatment slopes from Day 6 to Day 10 were compared to pantoprazole alone, significance is shown with grey stars next to the corresponding line **: p < 0.01, *: p < 0.05 (one-way ANOVA with Dunnett post hoc analysis n > 3 biological replicates).
Figure 4
Figure 4
Bioelectric Drugs in Combination with Each Other, Pantoprazole, and TMZ Reduced Proliferation in U87 cells and Changed the Cell Cycle Ratio Compared to Control. (A) Fold change to start cell counts (cells at day 6/cells at day 0) after 6 days of treatment. Low values indicate less cell growth. Colors indicate treatments followed up for further analysis and hues represent concentrations and combinations. Red shaded treatment corresponds to positive control that cannot be used clinically. Only treatments with significant values are shown out of 42 treatments compared to DMSO control. ****: q < 0.0001 ***: q < 0.001, **: q < 0.01, *: q < 0.05 (one-way ANOVA with FDR post hoc analysis n > 3 biological replicates). (B) FUCCI cell cycle data at day 6. Increased red and orange fractions indicate cell cycle arrest at G1 or G1 to S transition.
Figure 5
Figure 5
Treatments with Bioelectric Compounds and Pantoprazole or TMZ were Significantly Better than TMZ or Pantoprazole Alone at Reducing Proliferation in U87 cells and Changed the Cell Cycle Ratio Compared to Control. (A) Percent reduction in cells compared to control after 6 days of treatment. Treatments that were significantly more effective than TMZ alone are shown out of 42 treatments with brown stars. Treatments with pantoprazole that were significantly better than pantoprazole alone are shown out of 18 treatments with grey stars. Red shaded treatment corresponds to positive control that cannot be used clinically. Statistical analysis was conducted on the log2 of the fold change in cell number to control on day 6. ****: q < 0.0001, ***: q < 0.001, **: q < 0.01, *: q < 0.05 (one-way ANOVA with FDR post hoc analysis n > 3 biological replicates). (B) FUCCI cell cycle data at day 6. Increased red and orange fractions indicate cell cycle arrest at G1 or G1 to S transition.
Figure 6
Figure 6
Recovery Test of Bioelectric Treatments in Combination with Pantoprazole or TMZ in U87 cells. The log2 of the fold change in cell counts to Day 0 were recorded for 10 days. Dotted line marks the day on which drug treatment was removed and replaced with control media (n > 3 biological replicates). Combination drug treatment slopes from Day 6 to Day 10 were compared to pantoprazole or TMZ alone, but no significance was found (one-way ANOVA with Dunnett post hoc analysis n > 3 biological replicates). 3.5. Electrophysiology of NG108-15 Cells Show Changes in Resting Membrane Potential Induced by Treatment.
Figure 7
Figure 7
Resting Membrane Potential Changes Caused by Treatments in NG108-15 FUCCI Cells. The change in resting membrane potential is normalized to DMSO control. The negative values represent an increase in hyperpolarization. (A,B) were conducted on different days. There were n = 55–63 cells per condition. Statistics were calculated for the 400 s time point (black box with star on top). Significant values shown next to legend. ****: p < 0.0001, were calculated using an ANOVA with Dunnett post hoc analysis.
Figure 8
Figure 8
Differentiation Analysis of NG108-15 Cells Reveals that Treatments with Pantoprazole Increased Neuronal Markers after 6 days. Immunofluorescence of cells was analyzed with CellProfiler and quantified for integrated fluorescence intensity. (A) Stain of Microtubule Associated Protein 2 (MAP2). (B) Stain of Neuron-Specific Class III β-Tubulin (Tuj I). (C) Stain of Neural Filament Medium Chain (NFM). (D) Stain of Neuron-Specific Enolase (NSE). Treatments corresponding to the colored bars are outlined in the figure itself. The log of the fold change in intensity was compared between single treatments and combined treatments, except the positive control, with significant values shown in the color of the treatment compared. The initial fluorescence intensities were compared to their corresponding control, with significant values shown under the bars as, ***: p < 0.001, **: p < 0.01, *: p < 0.05 (one-way ANOVA with Tukey post hoc analysis n > 3 technical replicates).
Figure 9
Figure 9
Differentiation Analysis of NG108-15 Cells Reveals that Treatments with Pantoprazole Increased Astrocytic and Differentiation Markers after 6 days. Immunofluorescence of cells was conducted and analyzed with CellProfiler and measured for integrated fluorescence intensity. (A) Stain of S100 calcium-binding protein B (S100B). (B) Stain Glial Fibrillary Acidic Protein (GFAP). (C) Stain of the phosphorylated cAMP-Response Element Binding Protein (Phospho CREB). (D) Stain of Connexin 43 (Cx43). Treatments corresponding to the colored bars are outlined in the figure itself. The log of the fold change in intensity was compared between single treatments and combined treatments, except the positive control, with significant values shown in the color of the treatment compared. The initial fluorescence intensities were compared to their corresponding control, with significant values shown under the bars as, ***: p < 0.001, **: p < 0.01, *: p < 0.05 (one-way ANOVA with Tukey post hoc analysis n > 3 technical replicates).
Figure 10
Figure 10
Senescence and Proliferation Analysis of NG108-15 Cells Reveals that Treatments with Pantoprazole Increased Senescence, Decreased BrdU Incorporation, and Increased a p27Kip1 after 6 days. A senescence associated beta-galactosidase stain was conducted and scored by eye. Immunofluorescence of cells was conducted and analyzed with CellProfiler for integrated fluorescence intensity or presence or absence of a cellular signal. (A) Stain of senescence associated beta-galactosidase stain (SA-Beta Gal). (B) Stain of bromodeoxyuridine incorporation (BrdU). (C) Stain of the microtubule-associated protein light chain 3 B (LC3B). (D) Stain of cleaved caspase 3 (Casp 3). (E) Stain of cyclin-dependent kinase inhibitor 1B (p27Kip). (F) Size of Nuclei, determined by area of the Hoechst stain. Treatments corresponding to the colored bars are outlined in the figure itself. The log of the fold change in intensity was compared between single treatments and combined treatments, except the positive control, with significant values shown in the color of the treatment compared. The initial fluorescence intensities were compared to their corresponding control, with significant values shown under the bars. The logit of the percent positive cells was compared between single treatments and control, in cases of 0 values, the arcsine transformation was used. Significance was expressed as, ***: p < 0.001, **: p < 0.01, *: p < 0.05 (one-way ANOVA with Tukey post hoc analysis n > 3 technical replicates).
Figure 11
Figure 11
Differentiation Analysis of U87 Cells Reveals that Treatments with Pantoprazole Increased Neuronal Markers after 6 days. Immunofluorescence of cells was conducted and analyzed with CellProfiler for integrated fluorescence intensity. (A) Stain of Microtubule Associated Protein 2 (MAP2). (B) Stain of Neuron-Specific Class III β-Tubulin (TujI). (C) Stain of Neural Filament Medium Chain (NFM). (D) Stain of Neuron-Specific Enolase (NSE). Treatments corresponding to the colored bars are outlined in the figure itself. The log of the fold change in intensity was compared between single treatments and combined treatments, except the positive control, with significant values shown in the color of the treatment compared. The initial fluorescence intensities were compared to their corresponding control, with significant values shown under the bars as, ***: p < 0.001, **: p < 0.01, *: p < 0.05 (one-way ANOVA with Tukey post hoc analysis n > 3 technical replicates).
Figure 12
Figure 12
Differentiation Analysis of U87 Cells Reveals that Treatments with Pantoprazole Increased Astrocytic and Differentiation Markers after 6 days. Immunofluorescence of cells was conducted and analyzed with CellProfiler for integrated fluorescence intensity. (A) Stain of Vimentin. (B) Stain of the phosphorylated cAMP-Response Element Binding Protein (CREB). (C) Stain of S100 calcium binding protein B (S100B). (D) Stain Glial Fibrillary Acidic Protein (GFAP). Treatments corresponding to the colored bars are outlined in the figure itself. The log of the fold change in intensity was compared between single treatments and combined treatments, except the positive control, with significant values shown in the color of the treatment compared. The initial fluorescence intensities were compared to their corresponding control, with significant values shown under the bars as, ***: p < 0.001, **: p < 0.01, *: p < 0.05 (one-way ANOVA with Tukey post hoc analysis n > 3 technical replicates).
Figure 13
Figure 13
Differentiation Analysis of U87 Cells Reveals that Treatments with Pantoprazole Increased Oligodendrocyte Markers after 6 days. Immunofluorescence of cells was conducted and analyzed with CellProfiler for integrated fluorescence intensity. (A) Stain of oligodendrocyte marker O4. (B) Stain of the Sry-related HMg-Box gene 10 (SOX10). Treatments corresponding to the colored bars are outlined in the figure itself. The log of the fold change in intensity was compared between single treatments and combined treatments, except the positive control, with significant values shown in the color of the treatment compared. The initial fluorescence intensities were compared to their corresponding control, with significant values shown under the bars as, ***: p < 0.001, **: p < 0.01, *: p < 0.05 (one-way ANOVA with Tukey post hoc analysis n > 3 technical replicates).
Figure 14
Figure 14
Senescence and Proliferation Analysis of U87 Cells Reveals that Treatments with Pantoprazole or NS164 with TMZ Increased Senescence, Decreased BrdU Incorporation, and Increased a p27Kip1 after 6 days A senescence associated beta-galactosidase stain was conducted and scored by eye. Immunofluorescence of cells was conducted and analyzed with CellProfiler for integrated fluorescence intensity or presence or absence of a cellular signal. (A) Stain of senescence associated beta-galactosidase stain (SA-Beta Gal). (B) Stain of bromodeoxyuridine incorporation (BrdU). (C) Stain of the microtubule-associated protein light chain 3 B (LC3B). (D) Stain of cleaved caspase 3 (Casp 3). (E) Stain of cyclin-dependent kinase inhibitor 1B (p27Kip). (F) Size of Nuclei, determined by area of the Hoechst stain. Treatments corresponding to the colored bars are outlined in the figure itself. The log of the fold change in intensity was compared between single treatments and combined treatments, except the positive control, with significant values shown in the color of the treatment compared. The initial fluorescence intensities were compared to their corresponding control, with significant values shown under the bars. The logit of the percent positive cells was compared between single treatments and control, in cases of 0 values, the arcsine transformation was used. Significance was expressed as, ***: p < 0.001, **: p < 0.01, *: p < 0.05 (one-way ANOVA with Tukey post hoc analysis n > 3 technical replicates).
Figure 15
Figure 15
Voltage Dyes Showed that U87 Cells Treated with NS1643 and a Combination of NS1643 and Pantoprazole for 6 Days Showed a Hyperpolarization and YAP Increases its Translocation to the Cytoplasm in NS1643 or Pantoprazole with TMZ, and Pantoprazole with NS1643 Treatment. Immunofluorescence of cells was conducted and analyzed with CellProfiler for integrated fluorescence intensity. Dye assays were analyzed for mean intensity, except for LysoSensor Green which was analyzed for integrated intensity. (A) Stain of lysosomal pH with LysoSensor Green, low levels indicate alkalization. (B) Dye indicator of membrane voltage, DiBAC4(3), low levels indicate hyperpolarization. (C) Dye indicator of cytoplasmic pH, pHRodo Green, low levels indicate alkalization. (D) Dye indicator of cytoplasmic calcium, Fluo-4AM, high levels indicate an increase in calcium. (E) The ratio of nuclear to cytoplasmic Yes-associated protein (YAP), lower levels indicate translocation to the cytoplasm. Treatments corresponding to the colored bars are outlined in the figure itself. The log of the fold change in intensity was compared between single treatments and combined treatments, except the positive control, with significant values shown in the color of the treatment compared. The initial fluorescence intensities were compared to their corresponding control, with significant values shown under the bars as, ***: p < 0.001, **: p < 0.01, *: p < 0.05 (one-way ANOVA with Tukey post hoc analysis n > 3 technical replicates).
Figure 16
Figure 16
Live/Dead assay and Senescence assay of Human Neuronal Cells After 3 Day Treatment Shows Low Level of Toxicity. Low values indicate less death or senescent cells. (A) Live/Dead assay conducted on human neuronal cells cultured with drug for 3 days. (B) Senescence assay results of senescence associated beta-galactosidase staining on human neuronal cells cultured with drug for 3 days. Treatments with best reduction of proliferation in NG108-15 or U87 cells are shown out of a 24-sample toxicity screen, with significant values shown. **: q < 0.01, *: q < 0.05 (one-way ANOVA with FDR post hoc analysis n > 3 technical replicates). Increase in percent dead or senescent cells indicative of toxic treatment.
Figure 16
Figure 16
Live/Dead assay and Senescence assay of Human Neuronal Cells After 3 Day Treatment Shows Low Level of Toxicity. Low values indicate less death or senescent cells. (A) Live/Dead assay conducted on human neuronal cells cultured with drug for 3 days. (B) Senescence assay results of senescence associated beta-galactosidase staining on human neuronal cells cultured with drug for 3 days. Treatments with best reduction of proliferation in NG108-15 or U87 cells are shown out of a 24-sample toxicity screen, with significant values shown. **: q < 0.01, *: q < 0.05 (one-way ANOVA with FDR post hoc analysis n > 3 technical replicates). Increase in percent dead or senescent cells indicative of toxic treatment.

Similar articles

Cited by

References

    1. Hanif F., Muzaffar K., Perveen K., Malhi S.M., Simjee Sh U. Glioblastoma Multiforme: A Review of its Epidemiology and Pathogenesis through Clinical Presentation and Treatment. Asian Pac. J. Cancer Prev. 2017;18:3–9. doi: 10.22034/APJCP.2017.18.1.3. - DOI - PMC - PubMed
    1. Davis M.E. Glioblastoma: Overview of Disease and Treatment. Clin. J. Oncol. Nurs. 2016;20((Suppl. 5)):S2–S8. doi: 10.1188/16.CJON.S1.2-8. - DOI - PMC - PubMed
    1. Lemee J.M., Clavreul A., Aubry M., Com E., de Tayrac M., Eliat P.A., Henry C., Rousseau A., Mosser J., Menei P. Characterizing the peritumoral brain zone in glioblastoma: A multidisciplinary analysis. J. Neurooncol. 2015;122:53–61. doi: 10.1007/s11060-014-1695-8. - DOI - PubMed
    1. Weller M., Cloughesy T., Perry J.R., Wick W. Standards of care for treatment of recurrent glioblastoma—Are we there yet? Neuro Oncol. 2013;15:4–27. doi: 10.1093/neuonc/nos273. - DOI - PMC - PubMed
    1. Fan X., Xiong Y., Wang Y. A reignited debate over the cell(s) of origin for glioblastoma and its clinical implications. Front. Med. 2019;13:531–539. doi: 10.1007/s11684-019-0700-1. - DOI - PubMed

LinkOut - more resources